Article Text

Abstract
Background Young drivers of low socioeconomic status (SES) have a disproportionally high risk of crashing compared with their more affluent counterparts. Little is known if this risk persists into adulthood and if it differs between men and women.
Methods We used data from a 2003/2004 Australian survey of young drivers (n=20 806), which included measures of drivers’ demographics and established crash risk factors. These data were linked to police-reported crash, hospital and death data up to 2016. We used negative binomial regression models to estimate the association between participants’ SES, with car crash.
Results After adjusting for confounding, drivers of lowest SES had 1.30 (95% CI 1.20 to 1.42), 1.90 (95% CI 1.25 to 2.88), 3.09 (95% CI 2.41 to 3.95) and 2.28 (95% CI 1.85 to 2.82) times higher rate of crash, crash-related hospitalisation, crash in country areas and crash on streets with a speed limit of 80 km/hour or above compared with drivers of highest SES, respectively. For single-vehicle crashes, women in the lowest SES groups had 2.88 (95% CI 1.83 to 4.54) times higher rate of crash compared with those in the highest SES group, but no differences were observed for men from different SES groups.
Conclusion Young drivers who lived in areas of low SES at the time of the survey had a sustained increased risk of crash over the following 13 years compared with drivers from the most affluent areas. Our findings suggest that in addition to traditional measures, road transport injury prevention needs to consider the wider social determinants of health.
- injury
- social inequalities
- social and life-course epidemiology
Data availability statement
Data may be obtained from a third party and are not publicly available.
Statistics from Altmetric.com
Introduction
Motor vehicle crashes are one of the leading causes of deaths and injury worldwide.1 2 Drivers of low socioeconomic status (SES) are disproportionally affected by motor vehicle crashes with up to four times higher injury and mortality rates compared with their more affluent counterparts.3–6 These differences are more pronounced for crashes resulting in serious injuries and deaths as well as certain types of crashes such as frontal and overtaking collisions and single-vehicle crashes.4 5 7 Although overall rates of fatal road crashes have decreased in high-income countries over the past decades, social inequalities have not.5 8 There is limited evidence on the underlying reasons for these inequalities, but drivers from lower socioeconomic backgrounds driving older and less safe vehicles have been shown to contribute to these differences.8–10 Moreover, in Australia, a large proportion of drivers of low SES live in rural and remote areas, which have higher rates of crashes resulting in hospitalisation and deaths.11 Risky driving behaviour,8 impaired driving12 and higher driving exposure7 have also been suggested to contribute to higher rates of crashes in drivers of low SES compared with those of high SES.
To date, most of the evidence on socioeconomic differences in car crash and crash-related injury and death stems from cross-sectional studies, cohort studies with short follow-up time13 or cohort studies which did not adjust for confounding or only a limited number of confounders.5–7 13 Although the negative life course effects of low SES during childhood and youth on health as an adult have been highlighted,14 15 there is limited information on the effect of growing up in areas of low SES and risk of car crash during adulthood and whether this impacts differently on men and women. Previous cohort studies from Sweden showed an increased risk of car crash for young adults who grew up in households of low SES7 16; however, these studies were not able to adjust for established crash risk factors. In an updated analysis of the Swedish cohort, these differences were not observed after adjusting for driver characteristics, car safety level and crash circumstances,9 but the updated study did not adjust for other established confounders such as driving exposure, risk-taking behaviour and rurality of residency.
Previous studies reported a socioeconomic gradient in transport injuries for men, but no differences between socioeconomic groups for women.17 18 However, these studies did not adjust for known crash risk factors and therefore could not investigate if differential exposure to risk factors plays a role in differences between men and women.
The aim of this study was to investigate if drivers living in areas of low SES as young adults have a higher risk of car crash during adulthood compared with drivers from areas of high SES and if these differences vary by gender and crash characteristics. Towards this aim, we investigated car crashes in a sample of drivers up to 13 years after they first obtained their driver’s licence using longitudinal linked data from the DRIVE study, an Australian prospective cohort study of young drivers.19
Methods
Study area
New South Wales (NSW) is the most populous state in Australia with 7.5 million residents at the 2016 census.20 In 2018, NSW had with 4.28 million the largest number of registered passenger vehicles of any state in Australia and 5 million people held a car licence.21 22
Data sources
We used data from a 2003/2004 NSW survey of 20 822 young drivers, the DRIVE study. The study cohort comprised 20 806 participants after excluding 16 duplicate records. Data collection and the DRIVE study cohort have been previously described in detail.19 Briefly, drivers aged 17–24 years holding their first independent motor vehicle driver’s licence from NSW, Australia were eligible to participate. Information on driver demographics, driving exposure, driving experiences and training, and known and hypothesised crash risk factors was collected.
The DRIVE survey data were linked with crash data from the NSW Centre for Road Safety, hospital data from the NSW Admitted Patient Data Collection (APDC), and death data from the NSW Registry of Births, Deaths and Marriages (RBDM) and Australian Bureau of Statistics (ABS) Causes of Death data up to 2016. The NSW Centre for Health Record Linkage (www.cherel.org.au) performed probabilistic linkage of the data and supplied deidentified data sets for analysis.
The NSW Centre for Road Safety CrashLink system provides information on all police-reported road crashes that occur on NSW classified and local roads. The APDC includes records for all hospital separations (discharges, transfers and deaths) from all NSW public and private hospitals and day procedure centres, coded according to the Australian Modification of the International Statistical Classification of Diseases and Related Problems, 10th Revision.23 The NSW RBDM contains information on all deaths in NSW. The ABS Causes of Death data include information derived from the death certificate or coronial report on the cause of deaths.
Variables and statistical analysis
The outcome measures were the total number of crashes (ie, police-recorded crash, crash resulting in hospitalisation or death), crash-related hospitalisations, single-vehicle crashes, crashes on streets with a speed limit of 80 km/hour or more, crashes in country areas, crashes in wet conditions and crashes in the dark during follow-up (2003–2016). Crashes related to vehicles that the study participant could not legally drive with an NSW car licence and hospitalisations where the study participant was not the driver of the vehicle were excluded. The total number of crashes was derived from linkage of the cohort data with the crash, hospital and death data. Crash-related hospital admissions on the same day or within 1 day of a record in the crash data were considered the same crash.
The exposure under investigation was SES at the time of the baseline survey (2003–2004). This was derived from the ABS 2001 area-level Socio-Economic Indexes for Areas index of education and occupation.24 The index was matched to participants by postal area at study recruitment and was divided into population quartile groups, highest SES (mean men: 1139, SD 42; women: 1135, SD 41), second quartile (mean men: 1033, SD 27; women: 1034, SD 27), third quartile (mean men: 968, SD 15; women: 968, SD 15) and lowest SES (mean men: 920, SD 26; women: 920, SD 26). Mean SES scores were commensurate with those of the NSW population aged 15–24 at the 2006 census (mean highest SES men: 1135; women: 1141; mean lowest SES men and women: 921). The index of education and occupation was chosen for consistency with previous analysis of the DRIVE data.13
The impact of using the Index of Relative Socio-economic Advantage and Disadvantage was explored in sensitivity analysis (results not shown). Little differences between the two indices were found. At the time of the study 91% of participants lived with their parents.
Although completeness of recording of survey variables used in the analysis was high (93%–100%), the joint percentage of missing data across analysis variables was 15%. Missing values in the survey data were imputed using chained equations in Stata with 30 imputation cycles.25
The association between SES and car crash was examined in univariate and multivariate negative binomial regression models. Stratified analyses by gender were carried out to assess if social inequalities vary between women and men. Selection of covariates for the multivariate regression model was informed by previous analyses of the DRIVE data and international studies on risk factors for crash and SES and crash.7 13 16 26–29 The DRIVE questionnaire, method of data collection and variables in the data set have been described in detail elsewhere.26 The following variables available in the baseline survey were identified as potential confounders: measures of driver demographic characteristics (age, sex, geographical remoteness of place of residence), drivers’ mental health (self-harm), lifestyle (cannabis, drug and alcohol use), driver training and experience (lessons with professional driving instructor, months on learner licence, number of attempts on learner licence, self-rated driving ability, months between provisional licence and study entry, previous crash), driving behaviour and attitude (risk-taking behaviour, risk perception, sensation seeking) and driving exposure (table 1).19 All covariates were entered into the model at the same time.
Cohort characteristics. DRIVE cohort, NSW, Australia, 2003–2016
Geographical remoteness of residence was classified using the Accessibility/Remoteness Index of Australia,30 grouped into three (metropolitan, inner and outer regional, remote and very remote).
Time between survey and end of follow-up (31 December 2016) was included as an offset variable in the regression models to account for different lengths of exposure. Participants who died during follow-up were censored at the date of death. All statistical analyses were carried out using Stata V.15 (www.stata.com).
Results
Cohort characteristics
The study cohort comprised 20 806 novice drivers (54.6% women). The mean follow-up time was 13 years (SD 0.6). Most participants were born in Australia or New Zealand (85.9%) and lived in metropolitan areas (74.3%) (table 1). Participants of low SES (third and fourth quartiles) were younger, and a higher proportion were born in Australia and lived in remote areas compared with those from the highest SES (online supplemental table S1).
Supplemental material
There was little variation in measures of driving-training and experience, lifestyle and driving behaviour across socioeconomic groups. Drivers of low SES reported a higher number of weekly driving hours (mean 10.2, 95% CI 9.7 to 10.7) and a lower proportion had a high-risk perception score (34.4%) compared with those of high SES (mean 6.8 (95% CI 6.6 to 7.0) and 40.5%, respectively).
A higher proportion of women stayed on the learner licence for over 1.5 years (30.4%) compared with men (20.3%), and a higher proportion of men rated their driving ability as high (22.9%) and scored highest on risk perception (43.9%), risk-taking (39.1%) and sensation-seeking scores (40.4%) compared with women (13.8%, 24.3%, 27.7% and 28.0%, respectively) (online supplemental table S1).
Crashes
During the study period, a total of 2166 women (19.1%) and 2136 men (22.6%) were involved in a crash (table 2). Of these, 139 (1.2%) women and 79 (0.8%) men were hospitalised due to crash-related injuries and three women and six men died in car crashes. A total of 572 (5.0%) women crashed in country areas, 465 (4.1%) in areas with a speed limit of 80 km/hour or above, 469 (4.1%) in wet conditions, 536 (4.7%) in darkness and 213 (1.9%) were involved in single-vehicle crashes, compared with 586 (6.2%), 482 (5.1%), 523 (5.5%), 718 (7.6%) and 368 (3.9%) of men, respectively. For all crash outcomes, except for crashes that resulted in hospitalisation or deaths, men of all SES groups had higher rates of crash compared with women (online supplemental table S2). The largest differences between men and women were observed for the highest SES group for single-vehicle crashes and crashes in country areas with 3.7 (95% CI 2.4 to 5.6) and 2.2 (95% CI 1.4 to 3.4) times higher rates in men compared with women, respectively. Rates of single-vehicle crashes (7.7 per 10 000 person-years (95% CI 5.1 to 11.1)) and crashes in country areas (8.9 per 10 000 person-years (95% CI 6.0 to 12.4)) were low in women of the highest SES group.
Number of crash events by gender. DRIVE cohort, NSW, Australia, 2003–2016
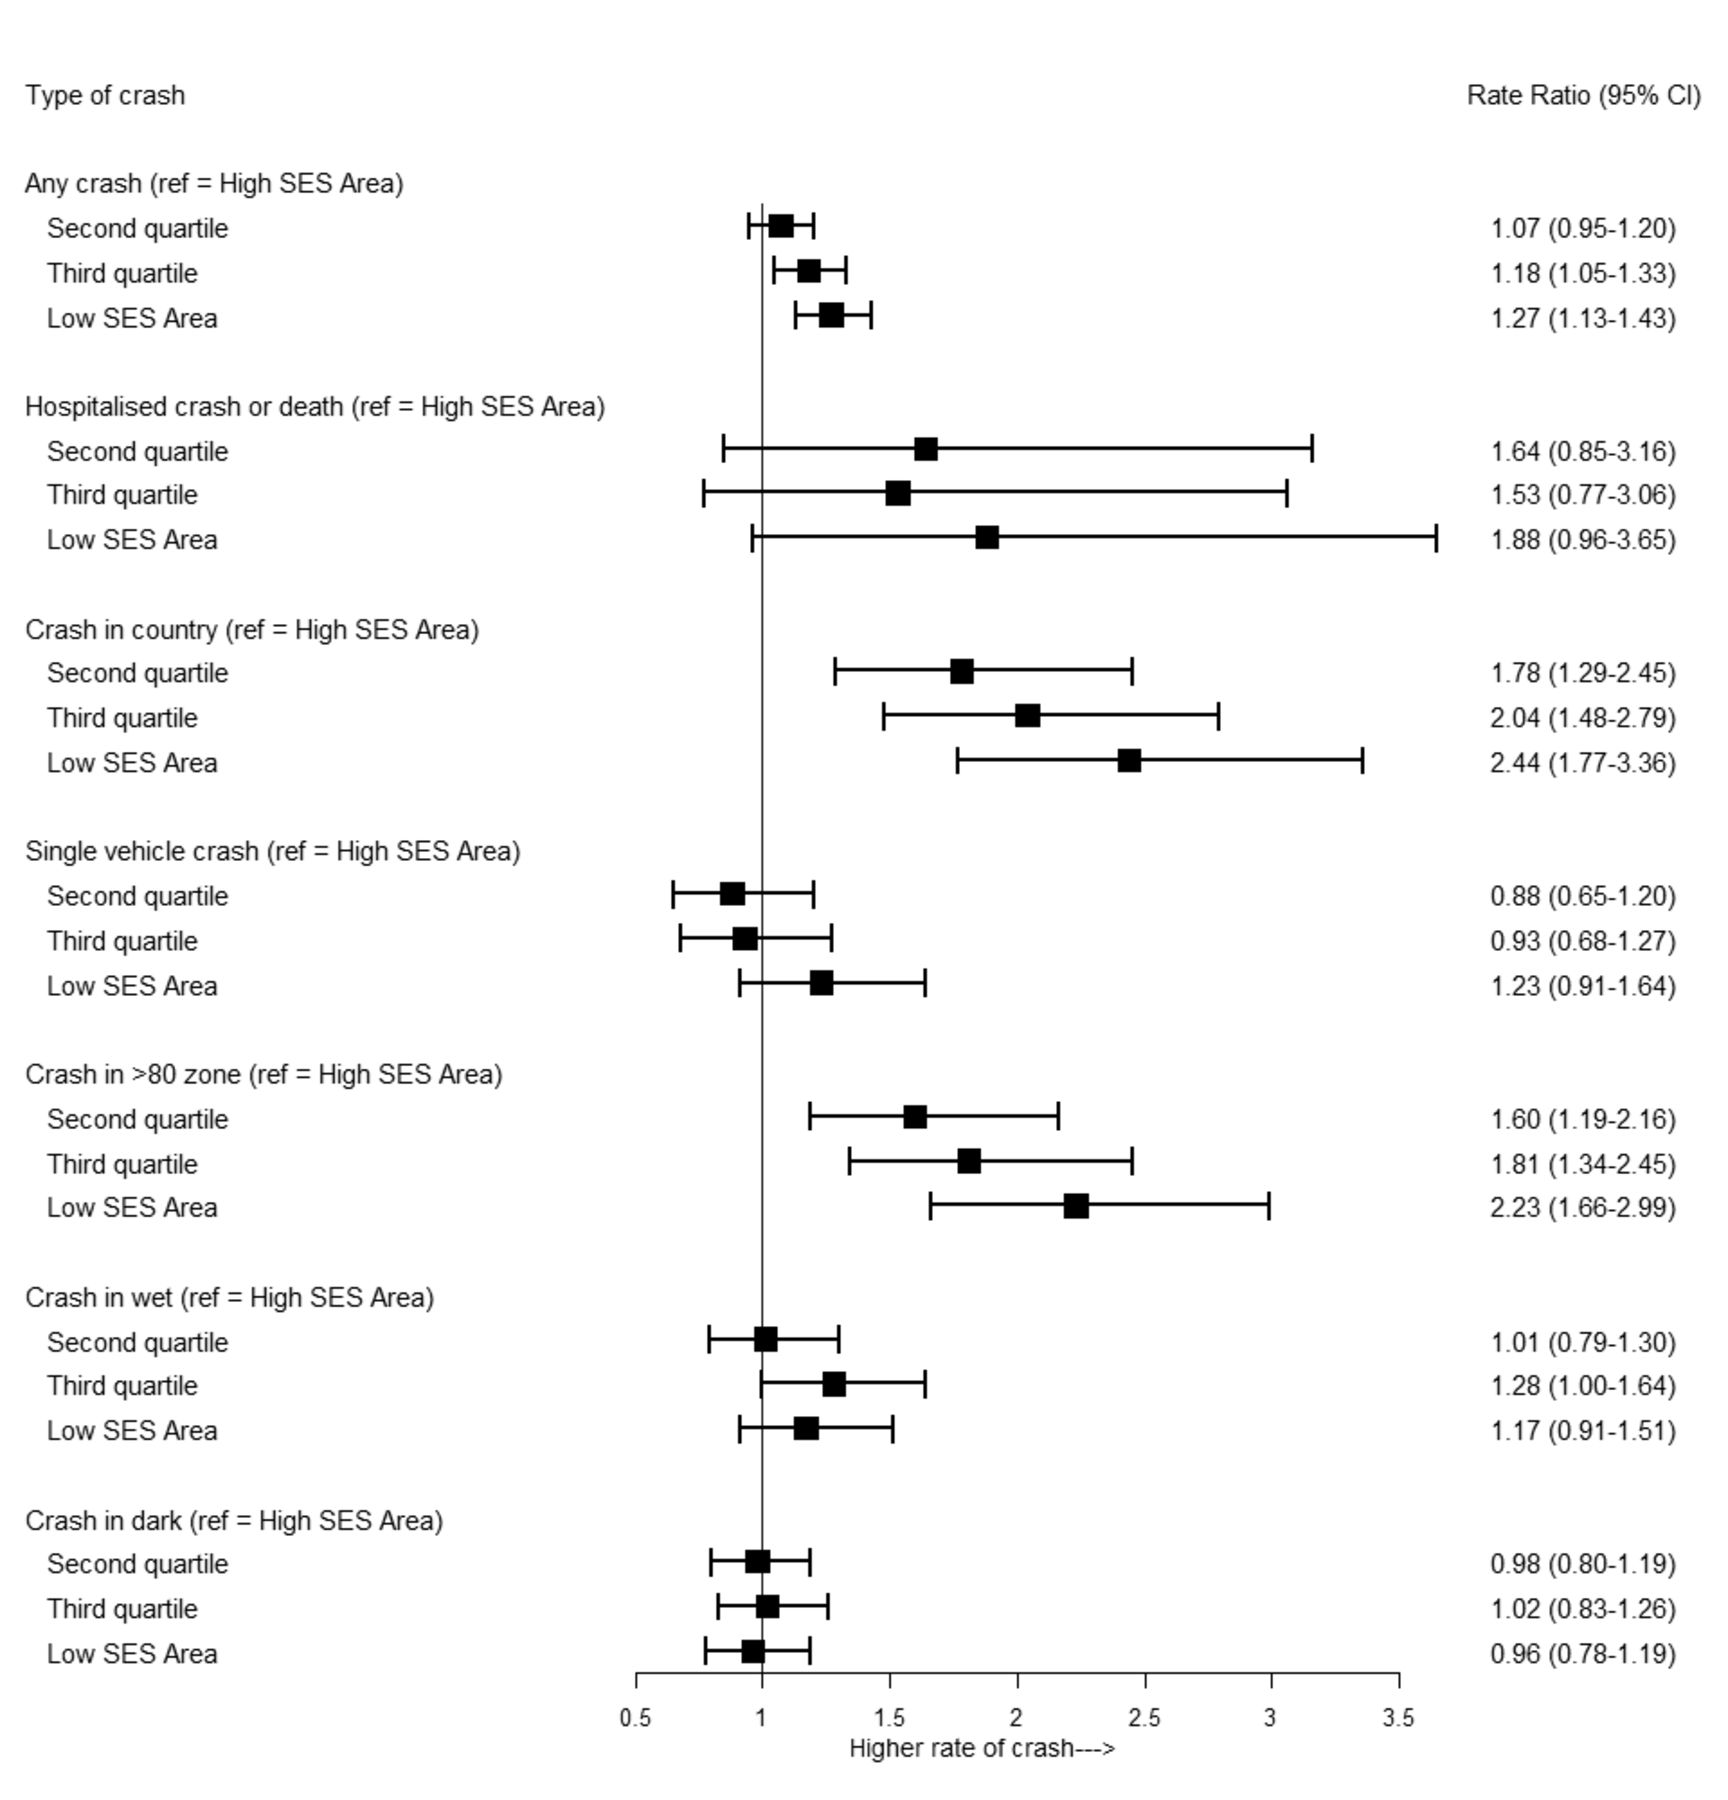
After adjusting for confounding in the multivariable analysis, women and men of low SES had 1.33 (95% CI 1.18 to 1.50) and 1.27 (95% CI 1.12 to 1.43) times higher rates of crash compared with those of high SES, respectively (figures 1 and 2, table 3). Women of low SES had 2.14 (95% CI 1.26 to 3.65), 4.32 (95% CI 2.89 to 6.45), 2.88 (95% CI 1.83 to 4.54), 2.33 (95% CI 1.71 to 3.17) and 1.35 (95% CI 1.03 to 1.77) times higher rates of crashes that resulted in hospitalisation or deaths, crashes in country areas, single-vehicle crashes, crashes in areas with a speed limit of 80 km/hour or above and crashes in wet conditions, respectively, compared with women of high SES. There were no differences in crashes in darkness between women from different SES groups. Men of lowest SES had 2.44 (95% CI 1.77 to 3.36) and 2.23 (95% CI 1.66 to 2.99) times higher rates of crashes in country areas and areas with a speed limit of 80 km/hour or above, respectively, compared with men of highest SES. There were no differences between men from different SES groups for hospitalised crash or death, crashes in wet conditions, darkness and single-vehicle crashes.
Rate ratios* of crash by SES. DRIVE cohort, NSW, Australia, 2003–2016
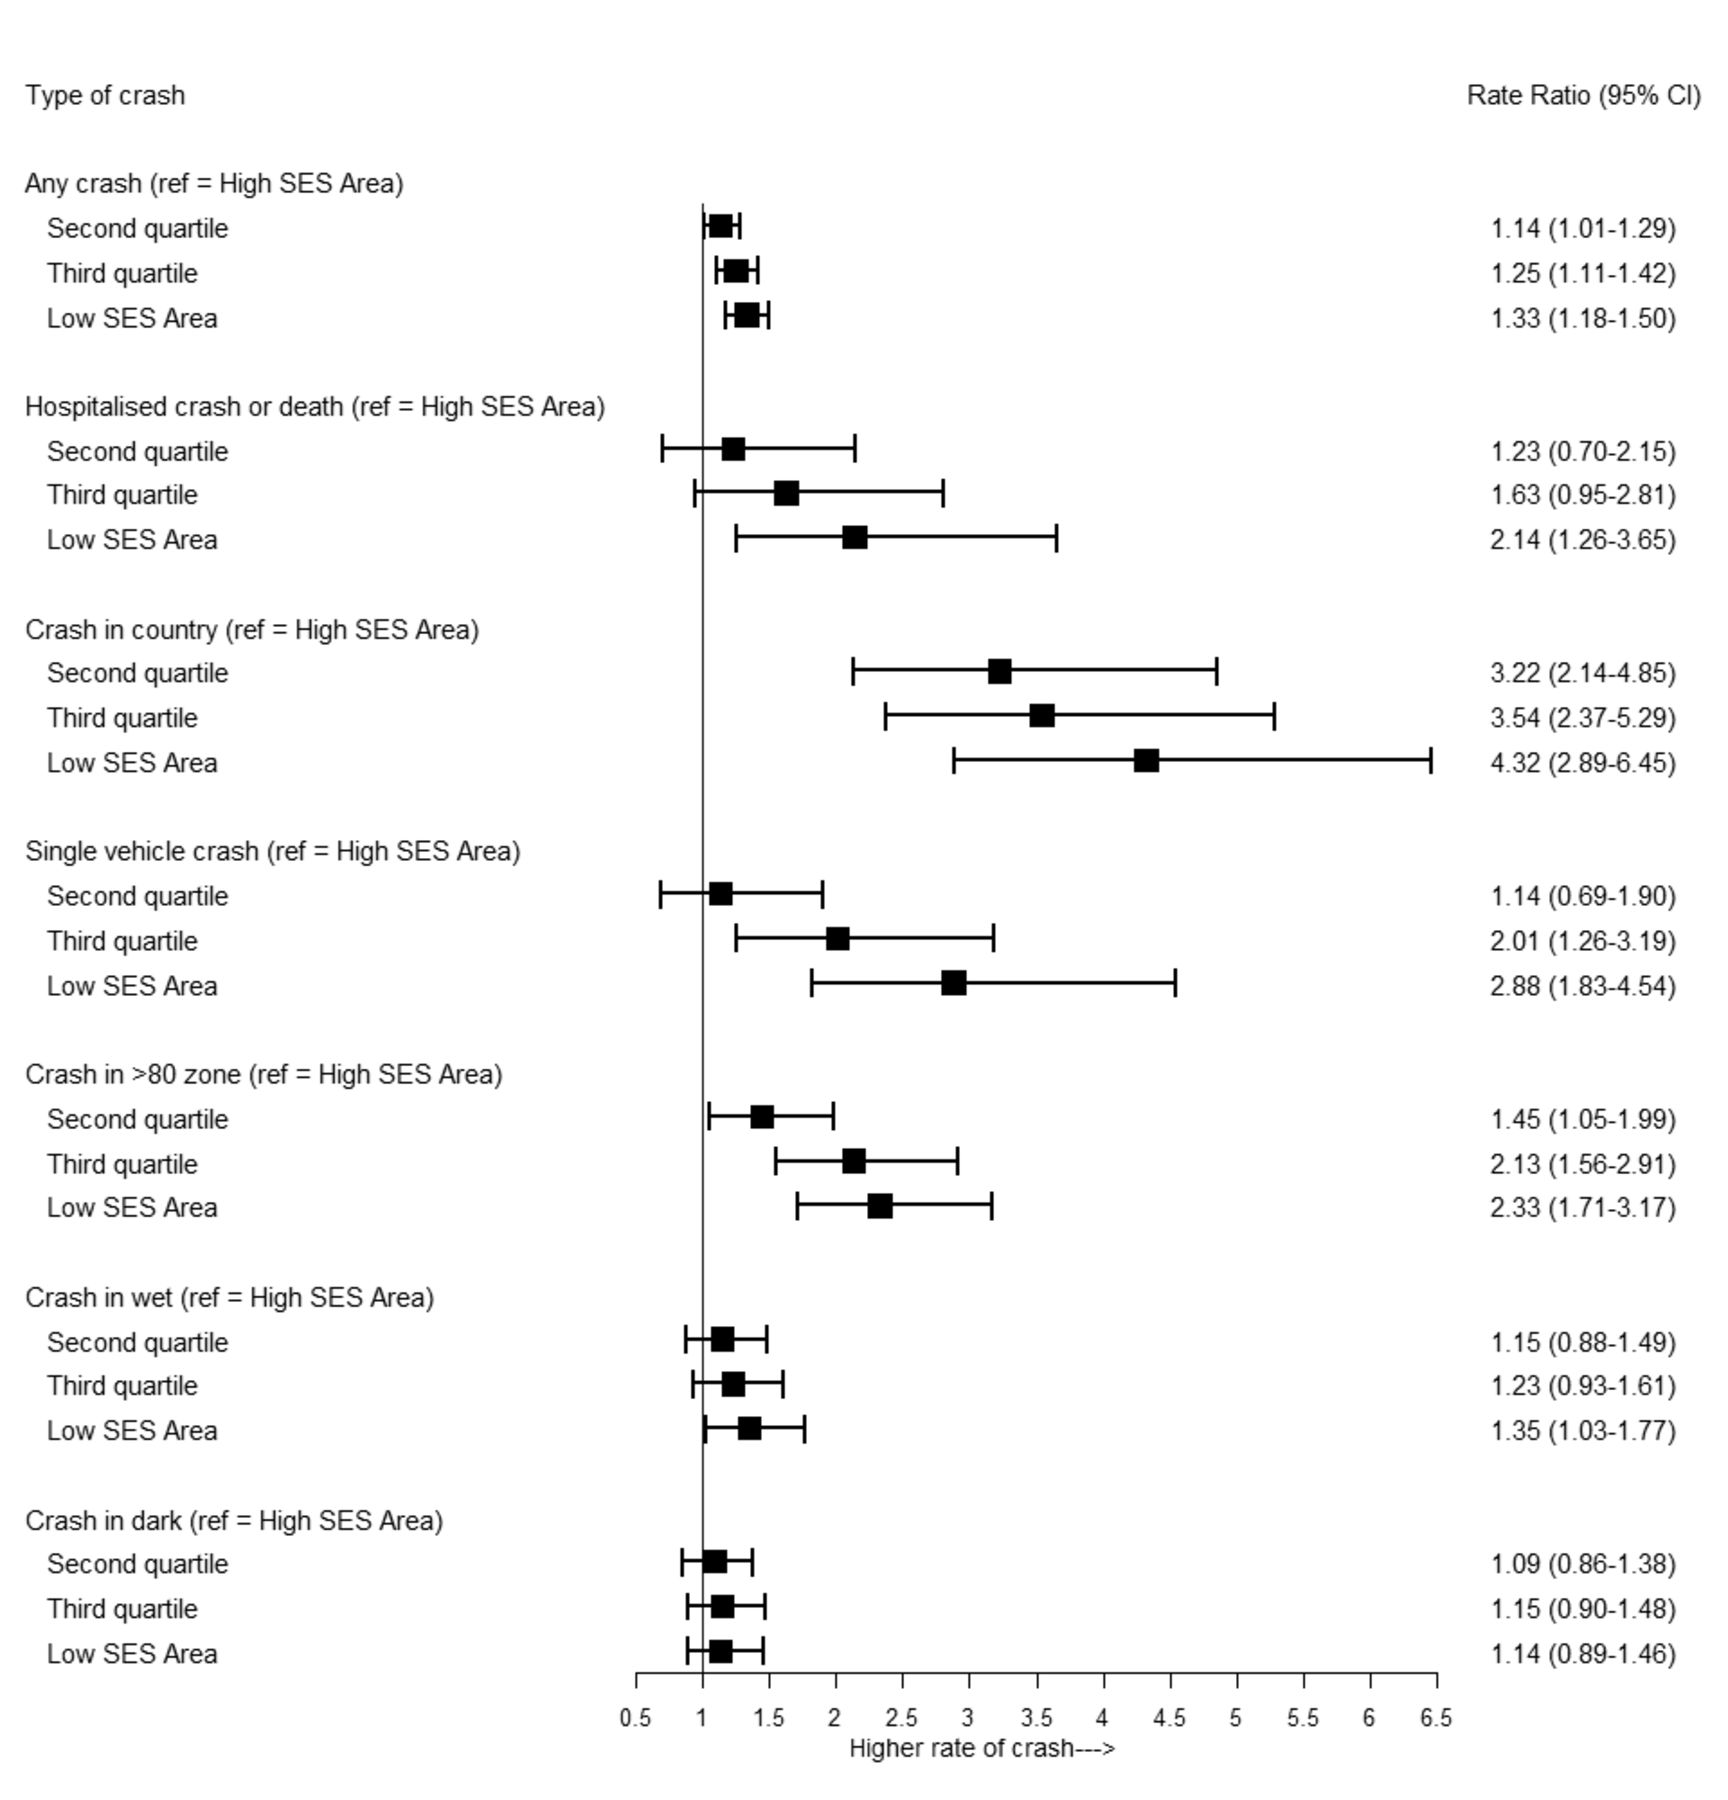
Rate ratios (adjusted for all variables in table 1: SES, age, geographical remoteness, alcohol audit summary score, cannabis smoking, self-rated driving ability, number of attempts on driving test, risk perception score, risk-taking score, sensation score, crash before study, professional training, length on learner licence and average weekly driving) of crash for women by SES. DRIVE cohort, New South Wales, Australia, 2003–2016. SES, socioeconomic status.
Rate ratios (adjusted for all variables in table 1: SES, age, geographical remoteness, alcohol audit summary score, cannabis smoking, self-rated driving ability, number of attempts on driving test, risk perception score, risk-taking score, sensation score, crash before study, professional training, length on learner licence and average weekly driving) of crash for men by SES. DRIVE cohort, New South Wales, Australia, 2003–2016. SES, socioeconomic status.
Discussion
Drivers who lived in areas of low SES as young adults had a higher risk of car crash during adulthood compared with those who lived in areas of high SES. These differences remained after adjusting for driver demographics and known crash risk factors in the multivariable analysis. Socioeconomic inequalities were more pronounced for crashes that required hospitalisation, crashes in country areas and crashes on streets with a speed limit of 80 km/hour or above. Socioeconomic differences were similar and for some outcomes even larger in women compared with men. Men had higher rates of crash for all groups of SES than women, except for crashes that required hospital admission.
Our findings of higher crash rates of drivers of low SES compared with those of high SES are in line with the findings of other Australian8 13 and international studies.5–7 18 Previous analysis of the DRIVE data showed that after adjusting for remoteness of residence and other confounders, drivers of low SES had 1.8 times higher rates of crash-related hospital admissions compared with drivers of high SES during the first 2 years after obtaining a driver’s licence.13 This study was limited by its short follow-up time and it only considered crashes that required hospital admissions. In comparison, our study showed that inequalities between socioeconomic groups persisted into adulthood over the 13-year follow-up period of this study. Moreover, we were able to show the differential impact of SES and crash on women and men and to investigate a range of outcome measures explaining the circumstances of crash. In line with our findings, a previous cohort study from Sweden also showed an increased risk of crash for adult drivers who lived in households of low SES during youth compared with those of higher SES.7 Similar to our findings, this study showed highest inequalities between drivers of low and high SES for severe and fatal crashes and single-vehicle crashes.7 However, this study was not able to adjust for important confounders such as driving exposure and risk-taking behaviour. In an updated analysis of the same data adjusting for crash circumstances and car safety levels, the differences were not observed any longer.9 In comparison, we observed crash differences between drivers from low and high SES groups after adjusting for established crash risk factors and driving exposure in the analysis, suggesting that other factors contribute to the differences in crash observed. It is noteworthy here that, while this included adjustment for rurality of residence, the correlation of rural residence and SES in the cohort was low at 0.36 (analysis not shown).
Lower levels of car safety have been shown to contribute to crashes in drivers of low SES.8 10 Moreover, worse road infrastructure and more hazardous nature of the road environment in areas of low SES31 as well as lower access to information on road safety might also contribute to the socioeconomic differences in crash. Additionally, lack of access to medical facilities in rural areas and areas of low SES might contribute to worse crash outcomes.32 However, an increasing body of research shows that growing up in poverty negatively affects cognitive functioning, such as selective attention, inhibitory control and decision-making.33 It seems plausible that poverty might also negatively influence attention and decision-making while driving and thus contribute to crash. Consequently, high-level measures, addressing the wider social determinants of health underlying these inequalities, might also be successful in reducing social inequalities in road transport crashes.
We observed similar and for some outcomes even larger relative social inequalities in crash for women compared with men. In comparison, previous studies reported lower socioeconomic differences in women compared with men, but none of these studies were able to adjust for driving exposure and other crash risk factors.9 18 34 Our results suggest that when taking confounders into account, those differences in crash between women of low SES compared with those from high SES are at least as pronounced if not greater compared with men.
Socioeconomic differences for crashes in country areas, areas with a speed limit of 80 km/hour or above and single-vehicle crashes might at least in part reflect differences in exposure. The more than twofold higher risk of crashes at high speeds and for single-vehicle crashes in female drivers of lowest compared with highest SES is of particular concern. These crashes pose a high risk of serious injury or fatality. Drug and alcohol use has been shown to be a major risk factor for single-vehicle crashes.35 However, analysis of alcohol involvement in the crash (results not shown) showed no difference by SES groups in our cohort.
Compared with previous studies which reported higher rates of crash in men compared with women,17 18 36 we were able to show that these differences exist for all groups of SES. These findings reiterate the importance of road safety measures specifically targeted at men.
Strengths and limitations
The strengths of this study are its large sample size of over 20 000 participants, the rich information on potential confounders and the long follow-up of up to 13 years.
Some of the limitations are inherent to the use of routinely collected data and survey data relying on self-report. Crash data were derived from routinely collected police, hospital and death data. Crashes that were not reported to police, did not require hospital admission and did not result in deaths were not covered in the analysis. Potential limitations around the DRIVE study sample have been discussed in detail elsewhere.19 Like other large cohort studies, participants in the DRIVE study were volunteers; as such, the cohort was not a representative sample of the general population. Consequently, it can only provide generalisable estimates of the relative associations between risk factors and outcome,37 but not absolute numbers or incidence rates. The distribution of demographic characteristics in the cohort, such as SES and remoteness of area of residence, was largely similar to the general population at the 2006 census and the study population exhibited wide variation in the risk factors of interest at baseline, which are important requirements for comparison of groups.
Another limitation was potential bias in self-reported data, which could, for example, occur from recall bias or social desirable responding to interview questions.38 39
Measures of SES and confounders such as driving exposure and driving behaviour were based on information from the baseline interview. We were not able to adjust for changes during follow-up. The DRIVE survey measured total driving exposure and did not distinguish between work and non-work-related driving, because at the time of the survey most participants (77%) attended school or university and only 6% reported they were in full-time employment. We do not know to what extent work-related driving contributed to differences in crash involvement between SES groups. Drivers of lowest SES reported the highest driving exposure at baseline, which might have increased further through choice of jobs that require driving. However, those driving for work have been shown to be more likely to engage in safety practices, thus potentially having lower risk of crash compared with non-work-related driving.40 There is limited information on differences in driving exposure by SES in Australia. Evidence from the NSW household travel survey showed that those with lower incomes tend to walk and take public transport more and drive less commuting or for work than those with higher incomes.41
In our study, measure of SES was based on a postal area-level measure at the time of the survey, when most study participants still lived with their parents. Previous research suggests that inequalities are likely to be even greater if smaller area-level measures were used.42
Conclusion
Our findings suggest that in addition to a safe system approach proposed in the Australian National Road Safety Strategy43 as well as measures specifically targeted at drivers from low SES and gender-sensitive approaches, road transport injury prevention also needs to consider the intersection of the wider social determinants of health to reduce the crash inequalities observed in this study. This broader, temporal concept is embodied in the recently proposed life course approach to injury prevention.44 This implies that, in addition to creating safe systems to avoid road crashes,43 road transport injury prevention also needs to address the underlying causes of social inequalities to reduce the crash inequalities observed in this study. Additionally, policy measures that reduce driving exposure such as easily accessible and affordable public transport and urban design not relying on cars as the main form of transport as well as other measures that reduce traffic volume have the potential to reduce car crashes and crash inequalities.45–47
Further studies are needed to better understand the underlying mechanisms for the inequalities observed in this study.
What is already known on this subject
Young drivers of low socioeconomic status (SES) are disproportionally affected by motor vehicle crashes compared with their more affluent counterparts. It is not known if these differences persist into adulthood and if social inequalities in crash differ between men and women.
What this study adds
After adjusting for multiple crash risk factors, drivers who lived in areas of low SES as young adults (aged 17–24) had a sustained higher risk of car crash up to 13 years later compared with those who lived in areas of high SES.
Socioeconomic inequalities were more pronounced for crashes that required hospitalisation, crashes in country areas and crashes on streets with a speed limit of 80 km/hour or above.
Men had higher rates of crash in all socioeconomic groups compared with women.
We observed similar and for some outcomes even larger relative social inequalities in crash for women compared with men.
Data availability statement
Data may be obtained from a third party and are not publicly available.
Ethics statements
Ethics approval
This study was approved by the AH&MRC Ethics Committee, UNSW Human Research Ethics Committee and the NSW Population and Health Services Research Ethics Committee (reference: HREC/16/CIPHS/9).
References
Supplementary materials
Supplementary Data
This web only file has been produced by the BMJ Publishing Group from an electronic file supplied by the author(s) and has not been edited for content.
Footnotes
Contributors All authors contributed to the conceptualisation and design of the study. KR cleaned the linked data. HM led the analysis and wrote the draft of the manuscript. All authors contributed to the interpretation of the findings and revision of the manuscript. RI, SB and TS contributed to the design of the DRIVE cohort study and PC and KR to the relinkage of the DRIVE cohort.
Funding Relinkage of the DRIVE study was funded by the National Roads and Motorists’ Association (NRMA)-Australian Capital Territory Road Safety Trust. The original DRIVE study was funded by the National Health and Medical Research Council (NHMRC) of Australia, Roads and Traffic Authority of New South Wales, NRMA Motoring and Services, NRMA-Australian Capital Territory Road Safety Trust, New South Wales Health, and the Motor Accidents Authority of New South Wales. RI was funded by an NHMRC Senior Research Fellowship (grant ID: APP1136430) and PC by an NHMRC Early Career Fellowship (grant ID: APP1158223). This research was supported by the Centre of Research Excellence: Driving Global Investment in Adolescent Health funded by the NHMRC (grant ID: APP1171981), and also by the Wellbeing Health & Youth Centre of Research Excellence in Adolescent Health funded by the NHMRC (grant ID: APP1134894).
Competing interests None declared.
Provenance and peer review Not commissioned; externally peer reviewed.
Supplemental material This content has been supplied by the author(s). It has not been vetted by BMJ Publishing Group Limited (BMJ) and may not have been peer-reviewed. Any opinions or recommendations discussed are solely those of the author(s) and are not endorsed by BMJ. BMJ disclaims all liability and responsibility arising from any reliance placed on the content. Where the content includes any translated material, BMJ does not warrant the accuracy and reliability of the translations (including but not limited to local regulations, clinical guidelines, terminology, drug names and drug dosages), and is not responsible for any error and/or omissions arising from translation and adaptation or otherwise.