Article Text

Abstract
Background The objective of this study was to quantify and compare the relative influence of community violent crime and socioeconomic deprivation in modifying associations between ozone and emergency department (ED) visits for asthma among children.
Methods We used a spatiotemporal case-crossover analysis for all New York City EDs for the months May–September from 2005 to 2011 from a statewide administrative ED dataset. The data included 11 719 asthmatic children aged 5–18 years, and the main outcome measure was percentage of excess risk of asthma ED visit based on Cox regression analysis.
Results Stronger ozone–asthma associations were observed for both elevated crime and deprivation (eg, on lag day 2, we found 20.0% (95% CI 10.2% to 30.6 %) and 21.0% (10.5% to 32.5%) increased risk per 10 ppb ozone, for communities in the highest vs lowest quartiles of violent crime and deprivation, respectively). However, in varied models accounting for both modifiers, only violence retained significance.
Conclusions The results suggest stronger spatiotemporal ozone–asthma associations in communities of higher violent crime or deprivation. Notably, violence was the more consistent and significant modifier, potentially mediating a substantial portion of socioeconomic position–related susceptibility.
- air pollution
- violence
- asthma
- paediatric
- poverty
This is an open access article distributed in accordance with the Creative Commons Attribution Non Commercial (CC BY-NC 4.0) license, which permits others to distribute, remix, adapt, build upon this work non-commercially, and license their derivative works on different terms, provided the original work is properly cited, appropriate credit is given, any changes made indicated, and the use is non-commercial. See: http://creativecommons.org/licenses/by-nc/4.0/.
Statistics from Altmetric.com
Introduction
Child health is impacted by complex and interacting factors in the social and physical environment,1 and nascent theories emphasise the need to integrate exposures. Ecosocial theory, for example, draws attention to ‘discrete, yet interacting’ products of discrimination and concentrated disadvantage2—including economic and social deprivation, socially inflicted trauma and toxic substances. Additionally, given rapid global urbanisation, urban design is emphasising disease intervention models related to traffic, pollution, noise and crime.3
Pollution accounted for approximately 9 million premature deaths (16% of all deaths) worldwide in 2015, and disproportionately impacts lower-socioeconomic position (SEP) populations.4 Accordingly, studies have reported stronger air pollution health effects among lower-SEP children,5 although the underlying causal factors are not fully elucidated. Evidence suggests that chronic psychosocial stress may account for a substantial portion of SEP-related pollution susceptibility6 as chronic stress is linked to immune, endocrine and metabolic function.7
Exposure to violence is a critical psychosocial stressor in many urban communities, impacting health, particularly among children and adolescents8–10; mediating health impacts of poverty through direct psychosocial impacts, behaviour or susceptibility to other exposures11; and, consequently, playing a larger role in stress than previously understood. Studies have validated associations between community violence and perceived stress,12 and New York City (NYC) focus groups prioritised violence above all other community stressors.13 Despite a substantial geography literature on spatial patterning in urban violence, few studies have examined community violence as a modifier of pollution-related health effects14 15 or disentangled psychosocial and material aspects of deprivation related to pollution susceptibility.16 However, the public health, clinical medicine and biomedical research communities are acknowledging violence as a major health determinant and elevating it as a priority,17 18 including a recent call from the National Institutes of Health in June 2018 that focuses an increased interest in the “Causes, Consequences, and Prevention of Violence” (https://grants.nih.gov/grants/guide/notice-files/NOT-MD-18-006.html). Arguably, the full extent of the health effects of violence needs to elucidated in order to prioritise and engage relevant stakeholders in the process of addressing this health determinant.
Acute childhood asthma events have been causally linked to short-term ozone exposures, with ‘suggestive evidence’ of heightened associations among lower-SEP communities.19 In NYC—despite substantial health and longevity improvements over recent decades—stark health disparities persist. In particular, children in the lowest-SEP neighbourhoods have three times the rate of asthma emergency department (ED) visits—and greater ozone-attributable risks of asthma hospitalisation and ED visits20—than those in the highest-SEP neighbourhoods. Other studies, however, show mixed results or explain lesser variation potentially due to differences in methods, or other population characteristics.21
We aim to isolate and compare the susceptibility-related effects of two components of SEP—area-level violent crime (a severe psychosocial stressor) versus other aspects of socioeconomic deprivation—to elucidate their relative influence on ozone–asthma associations. We used a case-crossover design, well suited to isolate effects of community-level factors.22 We quantified percentage excess risk of an asthma ED visit, with elevated residence-specific and day-specific ozone exposures, during warm seasons of 2005–2011. Our analysis leverages fine-scale spatiotemporal pollution exposure estimates and substantial variation in community characteristics; importantly, NYC neighbourhoods represent all combinations of deprivation and crime (eg, low-crime/high-deprivation communities, etc), and all combinations of SEP and pollution (eg, high SEP/high pollution, etc), needed to test interactions. We hypothesised that violence is driving a significant portion of observed SEP-related susceptibility to air pollution.
Methods
Area-level social stressor data
We created spatiotemporal community violent crime and deprivation exposure estimates, by residential address and year of ED visit. For generalisability and reproducibility, we used publicly available community violent crime and deprivation indicators commonly used in social and environmental epidemiology, and uniformly reported nationally. Police precinct (PP) annual felony violent crime rates (assault, felony robbery and murder) for 2004–2011 were obtained from the NYU Furman Center (http://datasearch.furmancenter.org/). To estimate community violent crime exposures, we calculate standardised Z-scores (mean=0) from 2-year average crime rates, for each PP with resident population >20 (n=78). Cases were assigned the 2-year Z-score for the case year and prior year (eg, case year 2007 assigned Z-score for 2006–2007 average). The difference in temporal resolution of the exposures is key to the hypothesised underlying mechanism of acute on chronic exposure interaction influencing an acute outcome: 2-year averages of these social stressor estimates enable us to investigate how these chronic exposures influence acute susceptibility of ED asthma visits to daily air pollution exposure via case-crossover design.
To capture socioeconomic deprivation, we combined census tract (CT)–level SEP indicators (% residents below 200% Federal Poverty Level, % adults ≥25 years not graduated from high school or equivalent, and % civilian workforce unemployed), drawn from the American Communities Survey 5-year estimates for 2005–2009 (year 2000 CT boundaries) and 2008–2012 (year 2010 CT boundaries). We calculated and summed standardised Z-scores (mean=0) for each indicator, for each CT area with resident population >20 (n=2160 and 2121 for 2000 and 2010 CT boundaries, respectively), as in Diez Roux et al.23 We assigned these composite deprivation estimates to each case maximising years preceding each case (ie, cases in years 2005–2009 were assigned 2005–2009 5-year Z-score; cases in years 2010–2011 were assigned 2008–2012 5-year Z-score). To enable direct comparisons with violent crime exposure estimates, CT-level indices were aggregated to PP areas using the centroid containment method, and Z-scores were re-calculated and re-assigned to each case.
Asthma ED visit data
The health outcome data were sourced from the NY State Department of Health Statewide Planning and Research Cooperative System, and included all NYC ED outpatient asthma visits (ICD-9 code: 493) among children aged 5 to 18 years. We restricted analyses to warm-season months (June 1–August 31), 2005–2011, to match the New York City Community Air Survey (NYCCAS) ozone monitoring season, which corresponds to months of greater photochemical transformation, and to eliminate potential confounding by seasonal spring and fall allergies, though notably there is spatial pattern consistency of ozone precursors and scavenger air pollutant (namely oxides of nitrogen) across seasons suggesting spatial pattern consistency for ozone as well.24
Air pollution and meteorological data
Spatiotemporal pollution exposures: We estimated daily residential ozone and fine particulate matter (PM2.5) exposures by integrating temporally and spatially refined data. Spatial estimates of warm-season ozone and year-round PM2.5 were derived from 2 years of NYCCAS monitoring data (2009–2010), implemented by the NYC Department of Health and Mental Hygiene.25 Data from 150 citywide street-level monitors were modelled using Land Use Regression (LUR) to predict concentrations at 100 m grid centroids. To build residence-specific exposure estimates, we estimated the mean concentration within a 300 m radial buffer around each geocoded case address.
Daily ozone and PM2.5 concentrations were derived from hourly data from the US Environmental Protection Agency (EPA) Air Quality System (AQS) monitoring stations (n=5 for ozone) in NYC, for 2005–2011 (May–September). City-wide daily time series of 24-hour average concentrations for each pollutant were constructed, as reported by Sheffield and colleagues.26 To integrate the residential (ie, spatial) ozone estimate with the temporal data, as reported by Shmool and colleagues,27 we first derived the ratio of near-residence (ie, 300 m buffer mean) concentration to the citywide average of NYCCAS concentrations across populated areas (ie, CTs with residential population >20) and then multiplied that ratio for each case residence by the daily EPA AQS concentration.
Spatiotemporal temperature estimates: We estimated daily residential temperature using a spatial surface of average overnight (3:00–5:00) temperatures derived using LUR and data from 15 min measurements from continuous HOBO sensors (Pocasset, MA) deployed at all 150 NYCCAS sites. We used overnight temperatures, which displayed substantial spatial variation across seasons, and may be less influenced by localised intermittent shading or sunlight-related microclimate effects. To derive daily temperatures, we averaged data from four local meteorological stations (JFK International, LaGuardia and Newark International Airports; Central Park), retrieved from the National Oceanic and Atmospheric Administration (NOAA) National Climatic Data Center, including daily minimum, average, maximum and dew point temperatures, which were highly correlated (rho=0.84–0.93). We averaged temperatures from 3:00 to 5:00 daily (hereafter Tmin) and adjusted this time series using the ratio of near residence (ie, 300 m buffer mean) to the citywide average. We calculated relative humidity (RH) from Tavg and TDP using NOAA equations.
Statistical analysis
We calculated Pearson correlation coefficients to characterise exposure variable relationships. To select meaningful cut-points for categorical modifiers, we summarised ozone exposure distributions within quartiles, quintiles and deciles of violent crime and deprivation; because ozone concentrations did not differ significantly across different quantile breaks of crime or deprivation, and the choice of quantiles did not reveal meaningful nuances in this relationship, we chose quartile categories for simplicity.
We used conditional logistic regression (Cox proportional hazards) in the case-crossover design to estimate the percentage of excess risk of ED visit per 10 ppm increase in 24-hour average near-residence ozone. Time-invariant individual characteristics (eg, age, sex, race/ethnicity) are inherently adjusted in case-crossover models, and we adjusted for PM2.5 (4-day average (lag days 0–3, natural spline (ns), 3 df)), Tmin (same-day (ns, df=3) and 6-day average (lag days 1–6, ns, df=3)) and RH (ns, df=3). We used symmetric bidirectional referent day selection for same day-of-week for the 2 weeks before and after case events.
We fit two separate interaction models, each using continuous ozone exposure as the primary spatiotemporal exposure of interest. To examine modification by community deprivation, we used interactions between continuous spatiotemporal ozone and quartiles of community deprivation. Separately, to examine modification by community violent crime, we used interactions with quartile of community crime. We calculated pooled standard errors and p values for the interaction, using the lowest deprivation or crime quartile, respectively, as the referent group. We fit these models separately for lags days 0 to 6.
Then, to examine relative modification by violent crime and deprivation, we developed three joint interaction model forms, listed below, because the case-crossover design is not commonly implemented using multiple modifiers; implementing separate interaction terms for crime and deprivation in the same model requires using the same spatiotemporal exposure (ozone) twice, complicating interpretability; and using separate interaction terms does not account for complex joint distributions among potentially confounded modifiers.
Cross-stratified model: We dichotomised both crime and deprivation levels at the median, cross-stratified these to create four groups (ie, ‘high crime/high deprivation’ (n=4432), ‘low/high’ (n=1489), ‘high/low’ (n=1408) and ‘low/low’ (n=4390)), then examined interactions between spatiotemporal ozone and this term, on likelihood of ED visit.
Multiple categorical modifiers: We tested models using two separate interactions, by categorical (quartile) of violence and deprivation in one model.28
Multiple continuous modifiers: We implemented models using continuous versions of both modifiers.29
Sensitivity analyses
We tested modification of continuous ozone effects by deprivation quartiles at CT, instead of PP. While this model’s results are not directly comparable with those for crime, given different units of aggregation, this type of sensitivity analysis is recommended when aggregating to larger areas, given modifiable areal unit problems.30
Statistical analyses were conducted in R V.3.2.2 (R Core Team 2015). Institutional Review Boards at the University of Pittsburgh and Icahn School of Medicine at Mount Sinai approved all aspects of this study.
Results
Our case population included 11 719 child asthma ED visits to NYC hospitals from 2005 to 2011. Asthma cases were identified in all five NYC boroughs with the largest numbers from the Bronx and some areas in upper Manhattan and Brooklyn (figure 1A). The characteristics of the case patients and spatiotemporal ozone exposure distributions for this cohort were summarised previously.27 In brief, 49.6% were for children 5–9 years, range 0–17 years (mean=10.0 (SD=3.7)); 56.4% were male patients; 36.2% had the Bronx as their borough of residence; and the distribution of cases across the years of the study showed a decline from 18.2% in 2005 to 11.9% in 2011. Additional descriptive data across exposure category of crime and deprivation appear in table 1. The spatial patterns of ozone ratios for the cases reflect the lower surface concentrations in the city core (Manhattan) and higher concentrations in the outer-lying areas of the city (figure 1B). Spatiotemporal estimates of ozone were correlated with Tmin (rho=0.36) and PM2.5 (rho=0.54). Air pollution and community stressor exposures did not vary significantly by case age categories or by sex.
Demographic characteristics and ozone exposure estimates across crime and deprivation median-dichotomised exposure categories

Violent crime and socioeconomic deprivation by childhood asthma emergency department visits in NYC, June–August, 2005–2011. Dots represent cases colour-coded by low crime/low deprivation, low crime/high deprivation, high crime/low deprivation and high crime/high deprivation. Different colour dots within the same police precinct boundary occur because cases represent 2005–2011 and crime and deprivation Z-scores changed over this period. The inset (previously published in Shmool et al 27) includes the near residence to citywide ozone ratios for cases (n=11 719; range, 0.57–1.16).
Figure 1A also shows the joint spatial distribution of median-dichotomised deprivation and violent crime for individual cases. Spatiotemporal exposure estimates for deprivation and crime are correlated (rho=0.57). While these stressor indicators are weakly correlated with spatially resolved ozone (rho <−0.08), estimated ozone exposures did not differ significantly by crime or deprivation quartiles. Compared with the citywide distribution, the case population (years 2005–2011) lived in tracts with higher deprivation and crime (data not shown), though direct comparisons are complicated in that the social modifiers were estimated for the year of asthma event, and thus these exposures vary over both time and space.
Overall associations between spatiotemporal ozone and asthma ED visits
As in our prior results,27 in models without interactions, we observed significantly elevated excess risk of asthma ED visits associated with spatiotemporally resolved ozone on lag days 1–4, peaking at lag day 2, when a 10 ppb increase in ozone was associated with an excess risk of 9.4% (95% CI 6.3% to 12.7%) (results not shown).
Separate interaction models
Ozone effects by sepsocioeconomic deprivation
With modification by socioeconomic deprivation (figure 2 and online supplementary table 1), ozone conferred significant excess risk of asthma ED visits, in all deprivation groups, on lag days 1 through 3. On each day, we observed the lowest excess risk in those communities in the lowest-deprivation quartile, and generally increasing risks with increasing deprivation (eg, 21.0% excess risk in most-deprived vs least-deprived quartile, on lag day 2 (95% CI 10.5% to 32.5%)).
Supplemental material

Associations between day-specific and residence-specific ozone and risk of emergency department (ED) visit for asthma, by quartile of community socioeconomic deprivation, 2005–2011, in NYC. X-axis includes lag days 0–6. Y-axis is percentage of excess risk per 10 ppb increase in ozone exposure. Shapes represent quartiles of community socioeconomic deprivation.
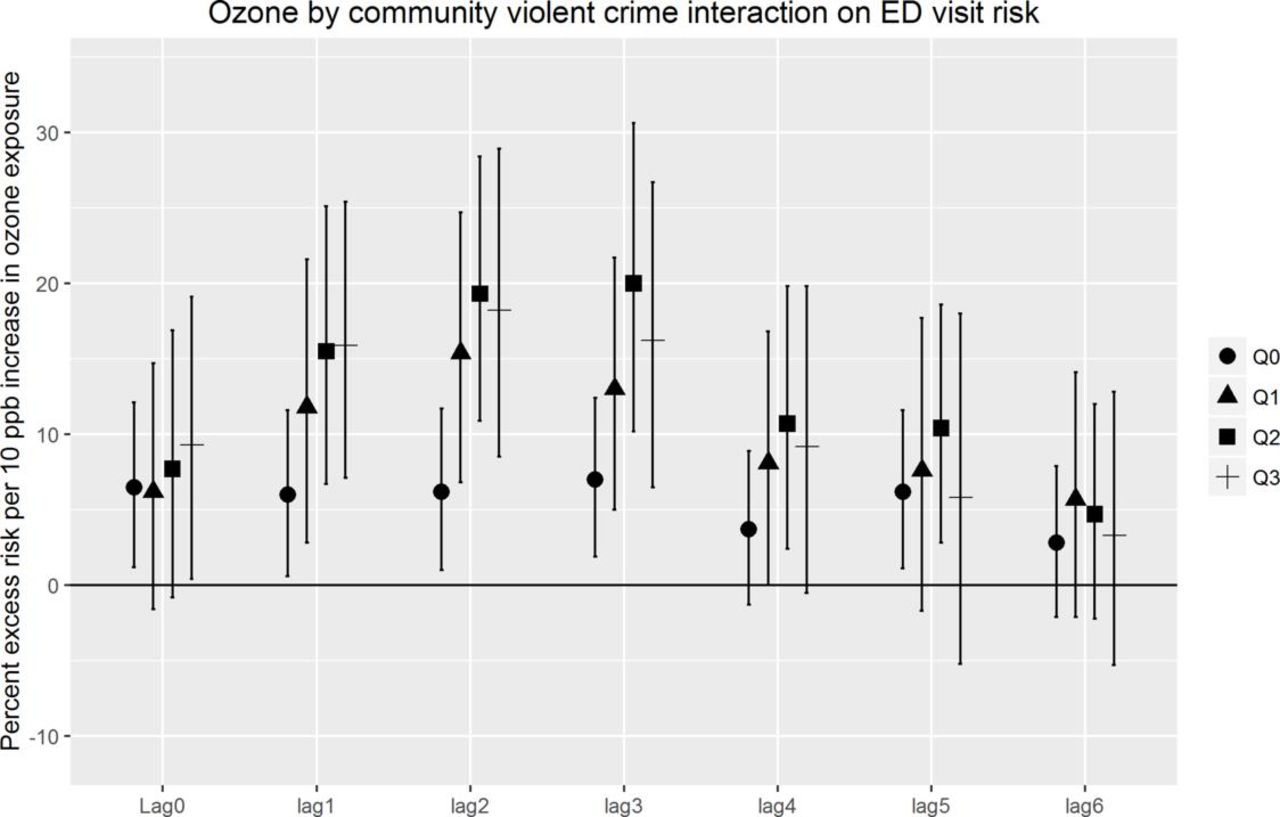
Ozone effects by violent crime
With modification by violent crime (figure 3 and online supplementary table 2), we again observed significant excess risks of asthma ED visits, in all crime quartiles, on lag days 1 through 3. The lowest excess risk appeared in those communities in the lowest-crime quartile (eg, 6.0% excess risk on lag day 1 (95% CI 0.6% to 11.6%)) and showed increasing risks with increasing crime (eg, 18.2% excess risk in highest-crime quartile on lag day 2 (95% CI 8.5% to 28.9%)).

Associations between day-specific and residence-specific ozone and risk of emergency department (ED) visit for asthma, by quartile of community violent crime, 2005–2011, in NYC. X-axis includes lag days 0–6. Y-axis is percentage of excess risk per 10 ppb increase in ozone. Shapes represent quartiles of violent crime.
Joint interaction models
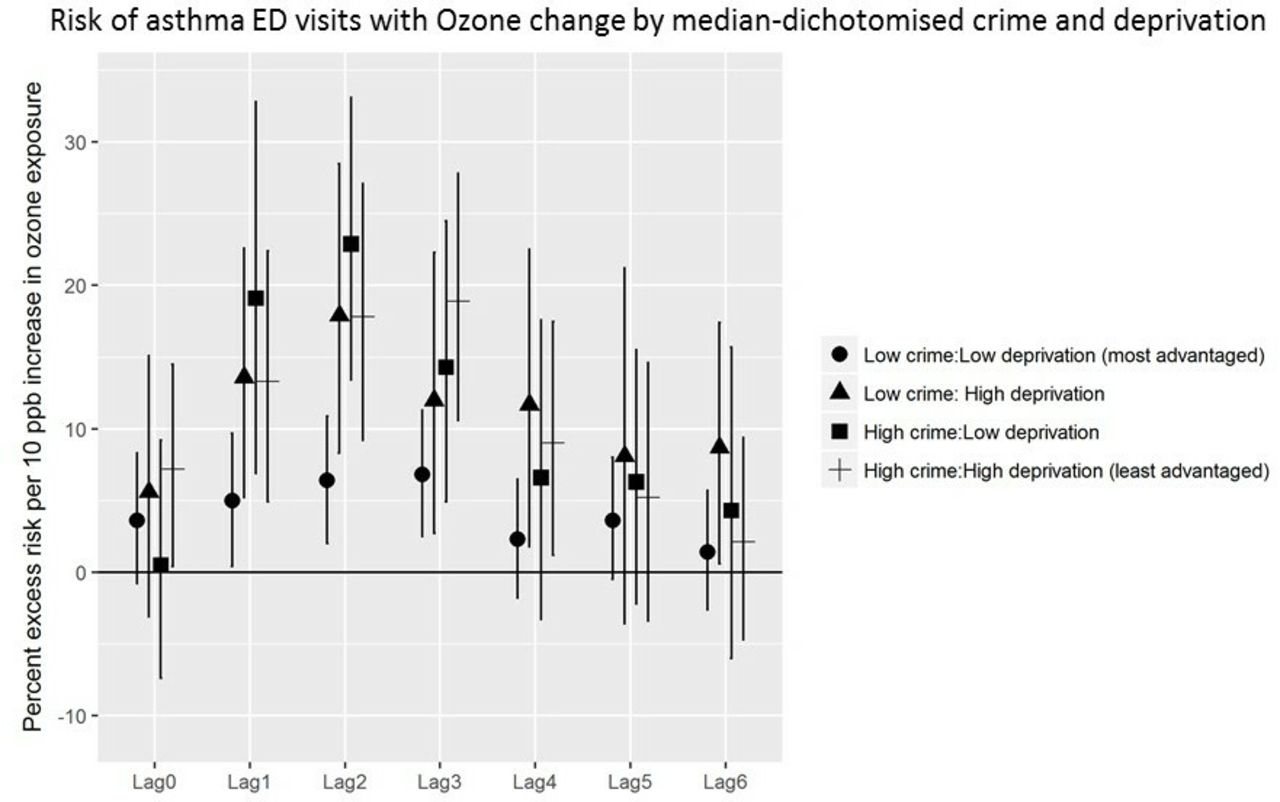
Cross-stratified model
With cross-stratified crime and deprivation categories, we found the highest ozone-attributable risks in the high-crime/low-deprivation quartile, on lag day 2, with an excess risk of 22.9% (13.4% to 33.1%) which is significantly greater than the low/low (reference) category on the same lag day (figure 4 and online supplementary table 3). In contrast, the greatest excess risk for the low crime/high deprivation quartile was 17.9% (8.3% to 28.5%), also on lag day 2. The confidence limits for each of these effect estimates were wide and overlapping.
Ozone by median-dichotomised violent crime and socioeconomic deprivation interaction on childhood asthma emergency department (ED) visit risk, 2005–2011, in NYC. X-axis includes lag days 0–6. Y-axis is percentage of excess risk per 10 ppb increase in ozone exposure. Shapes represent four categories cross-stratified by median-dichotomised violent crime and socioeconomic deprivation (low crime/low deprivation; low/high; high/low; high/high).
Multiple categorical modifiers
We used separate interaction effects between ozone and violent crime, and between ozone and deprivation, in the same model (ie, mutually adjusted interactions). We observed stronger associations between ozone and asthma across increasing quartiles of community violence; associations in all violence quartiles were significantly greater than in the reference (lowest crime) quartile. Modification by deprivation did not retain significance (results not shown).
Multiple continuous modifiers
Similarly, with multiple interaction terms using continuous versions of the two modifiers, modification by violent crime retained significance (p<0.0001), while deprivation did not (p=0.66).
Sensitivity analyses
We examined interaction models using deprivation at CT, rather than police precinct, and observed associations with similar magnitude, lag structure, and CIs as observed in our primary results at PP level (results available online supplementary figure 1).
Supplemental material
Discussion
We observed greater risks of asthma ED visits with elevated ozone exposures among children living in communities with more violent crime or socioeconomic deprivation. Comparing modification by these two factors, violent crime was the stronger, more consistent modifier, across multiple separate models. Risk of an asthma ED visit increased across quartiles of deprivation or crime in a roughly dose-response manner. The highest quartile for crime, however, while always higher risk than the lowest-crime group, did not consistently confer the greatest risk, possibly suggesting a threshold or saturation effect in crime-related susceptibility.
Our findings raise the question of why violent crime, a psychosocial stressor, may play a stronger role than other aspects of deprivation in shaping susceptibility. High-crime/low-deprivation areas, which displayed the highest risks across cross-stratified quartiles, were not simply borders between communities dissimilar in SEP, but many were independent clusters. Possible associated factors that may play contributory roles are income inequality or rapid socioeconomic or social change (eg, gentrification), as our crime and deprivation indicators varied in both space and time.
Study strengths and limitations
The ED data include limited individual information (eg, economic variables), preventing examination of modification by individual-level stressors and examination of repeated events by subject. However, in this large ED dataset, the number of repeat addresses comprised too small a portion of the dataset (approximately 5%) to hinder the interpretability of results. Individual race/ethnicity and neighbourhood composition (a non–time-varying factor between case and control periods) are both inherently adjusted for in case-crossover model. However, this approach does not provide insight into the influence race/ethnicity may play on the association. Racial/ethnic composition can encompass aspects of racial discrimination, residential segregation, gentrification and/or be indicative of protective ‘enclaves’.31
This is the first study, to our knowledge, to attempt to disentangle effects of violence from other aspects of deprivation (including material deprivation) in shaping pollution susceptibility. Our analysis leveraged several substantial strengths, including a large sample size and full NYC ED coverage. Additionally, we had fine-scale spatiotemporal estimates for ozone and key confounders (ie, co-exposures and temperature) derived from NYCCAS and EPA regulatory data—enabling creation of residence-specific and day-specific exposure estimates across multiple lag days. Also, the study benefited from variation in both psychosocial and material aspects of community SEP. Specifically, NYC offers substantial variation in the ‘combination’ of deprivation and crime (ie, high-crime/low-deprivation communities and vice versa)—offering those critical ‘off-diagonal’ communities needed to disentangle these aspects of SEP-related risk.
Examination of spatiotemporal air pollution exposure estimates, and modification by spatial variables (herein namely the social stressors), are under-used advantages of the case-crossover design through this approach’s enabling of the application of highly spatially resolved exposure variables.21 Likewise, the ability to test interactions by spatial or area-level stressor exposures, with inherent adjustment for non–time-varying confounders, enables hypothesis testing related to time-varying contextual risk factors (eg, violent events, policy changes) independent of individual covariates.
Despite our findings of the greater influence of violence on susceptibility to ozone-associated asthma ED visits, we acknowledge the underlying ecological association examined here and that generalisability may be limited as this study occurred in a single urban setting. We emphasise that further work is needed to disentangle the relative contributions of multiple psychosocial stressors, towards a better understanding of population disparities in health and effective interventions.
What is already known on this subject
There is a growing recognition that social and physical environmental exposures jointly impact chronic disease risk and also clear evidence that socioeconomic position impacts both disease risk and pollution susceptibility. Evidence suggests that psychosocial stressors (eg, violence) may play an important role, though few studies have attempted to disentangle psychosocial from other aspects of deprivation in shaping susceptibility to pollution.
What this study adds
We demonstrate the role of community-level psychosocial stressors in modifying children’s susceptibility to asthma emergency visits associated with ozone exposure and begin to disentangle the components of psychosocial stress, showing for the first time that community violence may modify susceptibility to air pollution more than socioeconomic deprivation for childhood asthma. Our analysis demonstrates a 20.0% (95% CI 10.2% to 30.6%) and 21.0% (10.5 to 32.5%) increased risk per 10 ppb ozone of emergency visit for asthma among children, for communities in the highest versus lowest quartiles of violent crime and deprivation, respectively.
Acknowledgments
The authors are grateful to Zev Ross (Zev Ross Spatial Analysis) for valuable consultations, assistance with the co-pollutant data acquisition and processing, and methods consultation, and to Dr Jiang Zhou for work on early statistical models.
References
Footnotes
Contributors PES, JLCS and JEC conceptualised the study. All authors contributed to the conduct and reporting of the work. All authors commented on drafts and read and approved the final manuscript. The corresponding author attests that all listed authors meet authorship criteria and that no others meeting the criteria have been omitted. PES is the guarantor.
Funding National Institute of Environmental Health Sciences (R21ES021429; K23ES024127 (PES)); U.S. Environmental Protection Agency (EPA) (RD-83457601 (JEC, JLCS)); NHLBI (4R01HL114536 (JEC, EJK)).
Competing interests None declared.
Patient consent for publication Not required.
Ethics approval Program for Protection of Human Subjects at Icahn School of Medicine at Mount Sinai (HS no. 12-00322) and University of Pittsburgh.
Provenance and peer review Not commissioned; externally peer reviewed.
Data availability statement Data may be obtained from a third party and are not publicly available.