Article Text

Abstract
Background Effective interventions are available to reduce cardiovascular risk. Recently, health check programmes have been implemented to target those at high risk of cardiovascular disease (CVD), but there is much debate whether these are likely to be effective at population level. This paper evaluates the impact of wave 1 of Keep Well, a Scottish health check programme, on cardiovascular outcomes.
Methods Interrupted time series analyses were employed, comparing trends in outcomes in participating and non-participating practices before and after the introduction of health checks. Health outcomes are defined as CVD mortality, incident hospitalisations and prescribing of cardiovascular drugs.
Results After accounting for secular trends and seasonal variation, coronary heart disease mortality and hospitalisations changed by 0.4% (95% CI −5.2% to 6.3%) and −1.1% (−3.4% to 1.3%) in Keep Well practices and by −0.3% (−2.7% to 2.2%) and −0.1% (−1.8% to 1.7%) in non-Keep Well practices, respectively, following the intervention. Adjusted changes in prescribing in Keep Well and non-Keep Well practices were 0.4% (−10.4% to 12.5%) and −1.5% (−9.4% to 7.2%) for statins; −2.5% (−12.3% to 8.4%) and −1.6% (−7.1% to 4.3%) for antihypertensive drugs; and −0.9% (−6.5% to 5.0%) and −2.4% (−10.1% to 6.0%) for antiplatelet drugs.
Conclusions Any impact of the Keep Well health check intervention on CVD outcomes and prescribing in Scotland was very small. Findings do not support the use of the screening approach used by current health check programmes to address CVD. We used an interrupted time series method, but evaluation methods based on randomisation are feasible and preferable and would have allowed more reliable conclusions. These should be considered more often by policymakers at an early stage in programme design when there is uncertainty regarding programme effectiveness.
- Cardiovascular disease
- PRIMARY CARE
- SCREENING
This is an Open Access article distributed in accordance with the Creative Commons Attribution Non Commercial (CC BY-NC 4.0) license, which permits others to distribute, remix, adapt, build upon this work non-commercially, and license their derivative works on different terms, provided the original work is properly cited and the use is non-commercial. See: http://creativecommons.org/licenses/by-nc/4.0/
Statistics from Altmetric.com
Introduction
Cardiovascular disease (CVD) is a major cause of death and an important contributor to the wide and growing inequalities in mortality in high-income countries.1 As a result, the reduction of CVD has long been an objective of health policy in the UK and elsewhere, with a series of initiatives introduced with this as either a primary or secondary focus.2
Recently, there has been interest in the potential of ‘health checks’ (a non-programmatic form of screening for CVD risk factors) to contribute to reductions in overall CVD mortality and inequalities.3 ,4 The core theory for this approach is that it is possible to influence several of the factors (such as smoking, high blood pressure and obesity) that increase the risk of CVD, using primary prevention therapies such as statin and antihypertensive drugs and behavioural interventions to reduce CVD risk for those without CVD but currently at high risk. By systematically identifying and offering treatment to those at high risk, it is proposed that population health improvement (and reductions in health inequality) can be expected.3 However, there is controversy about whether health check programmes are effective in reducing the CVD risk of populations5 ,6 and whether an approach based on identifying individuals at high risk is appropriate.7–9
Keep Well (KW) was originally funded by the Scottish Government as a CVD prevention programme based on health checks in primary care.10 It was primarily designed to reduce CVD incidence and to narrow socioeconomic inequalities in CVD.11 Previous evaluation work focused on implementation and reach of the programme, but questions surrounding the impact on health impacts could not be addressed.12 We aimed to assess whether trends in CVD-related mortality, hospitalisations and prescribing in those general practices involved in wave 1 of the KW programme changed after the implementation of the programme and whether they differed from the trends in non-KW practices. We used an interrupted time series design as the best available means of assessing its impact. The programme's prespecified theory of change indicated that, if successful, there would be increased prescribing of preventive therapies for CVD risk factors in the short-to-medium term, and greater reductions in CVD hospitalisations and mortality in the medium-to-long term in the KW intervention practices compared with non-KW practices.11
Methods
The KW programme
The ‘wave 1’ KW model was introduced in 2006 using heath checks delivered in primary care for adults aged 40–64 years living in areas of the greatest material deprivation.11 Those eligible were offered a CVD-focused health check to identify modifiable risk factors (using the ASSIGN score13). Those identified as having high CVD risk were offered a combination of advice, medical therapy and signposting or referral to other sources of support, including smoking cessation and weight loss programmes according to their identified risk factors.11
In wave 1 of KW, implementation occurred in the five Community Health Partnerships (CHPs) with the highest proportion of their population living in the most deprived areas; defined using the Scottish Index of Multiple Deprivation (SIMD), which identifies small area concentrations of multiple deprivation across Scotland.14 The five pilot sites were within four National Health Service (NHS) Health Boards (NHS Greater Glasgow and Clyde (NHSGGC), NHS Lanarkshire, NHS Lothian and NHS Tayside). By 2013/2014, NHS Boards reported that a total of 251 734 health checks had been carried out, of which 85.5% were delivered to individuals residing in the two most deprived SIMD quintiles (SIMD 1=70.8%, SIMD 2=14.7%).11
Data sources and variables
For the period January 1999 to August 2013, we obtained monthly counts of deaths and incident hospitalisations for stroke and coronary heart disease (CHD) among those aged 40–65 years from the Information Services Division (ISD) of NHS National Services Scotland for two groups of general practices: (1) those taking part in wave 1 of KW and (2) all other Scottish practices. Incident cases were defined as admissions or deaths where there was no record of a hospitalisation for the same diagnosis in the 10 years prior to the index event. For each month, we obtained separate counts for KW wave 1 general practices and for all other Scottish practices. We used corresponding population denominators for the KW and non-KW populations to calculate mortality and hospitalisation rates. CHD was defined using International Classification of Diseases (ICD)9 codes 410-14 and ICD10 codes I20-25. Stroke (broadly defined as cerebrovascular disease) was defined using ICD9 codes 430-38 and ICD10 codes I60-69 and G45.
Prescribing data were obtained from ISD for the period January 2002 to June 2011 for all general practices in Scotland. We included prescriptions used in the primary prevention of CVD, categorised into statins, antihypertensives and antiplatelet drugs using classifications from the British National Formulary. The data for each drug were provided as defined daily doses (DDDs) by general practice and month of prescription. Total general practice populations for each practice and each year were also provided by ISD from the Community Health Index (CHI) database to serve as denominators. ISD were provided with the date on which general practices started implementation of KW checks to allow coding of the prescriptions data as preimplementation or postimplementation without disclosure of the identity of individual practices. All data were provided at an aggregate level and the analytical approach described below reflects these data structure.
Analytical approach
Mortality and hospitalisations
We calculated monthly incidence rates for each health outcome for the KW and non-KW practice groups. We modelled the KW intervention effect using a covariate (St) coded as 0 at all time points before the intervention had started (prior to October 2006) and coded as 1 at all time points after KW implementation (after August 2010). For time points between these dates, the covariate took a value between 0 and 1, defined as the sum of the population size of practices that had started KW implementation at the given time point divided by the total population size of all KW practices by August 2010. The intervention covariate (St) was therefore the proportion of the population size covered by KW at any given point in time as a fraction of the final KW population size. The interpretation of the exponential of the coefficient associated with St is a percentage change in the level of outcome after KW was implemented in all participating practices (from September 2010) compared with before KW was implemented in any practice (prior to October 2006).
Mortality and hospitalisation rates were modelled using time series regression with autoregressive integrated moving average (ARIMA) errors4 (additional information in the online supplementary material S1). Our analytical strategy consisted of initially modelling the respective series without the intervention to obtain an adequate preliminary model that passed all diagnostic tests and then modelling and testing the effect of the intervention.15 The most appropriate and parsimonious model was selected using the Akaike Information Criterion (AIC).16 Web-table 1 provides further specifications of these models.
Supplemental material
To enable comparison with a control group, we employed the same analytical approach using data for non-KW practices. In addition, simultaneous time series of corresponding mortality and hospitalisation rates in non-KW practices were entered as a covariate in the ARIMA error models for KW practices. This allowed us to control for factors external to the intervention which might affect mortality and hospitalisation rates, providing a ‘net effect’ of the intervention.17
Prescribing
Regression models were used to assess changes in prescribing after the introduction of KW for practices implementing wave 1 of the programme and for non-KW practices. ARIMA error models were created for each drug category to account for autocorrelation and seasonality in the data.18 In further analyses, we examined the possibility of a variation of the intervention effect between different health boards by including interaction terms. Data from 66 wave 1 KW practices were included for the additional analyses (data from practices in NHS Tayside did not include practice codes and could not be matched by ISD to the practice-level data on prescription rates and so were excluded). Generalised estimating equations (GEEs) were used to analyse prescribing data over time for practices in the remaining three health board areas. The quasi-likelihood under the independence model criterion (QIC) statistic informed model selection.19 All analyses were undertaken using Stata V.12.1 software (Stata Corp, College Station, Texas, USA; http://www.stata.com). Ethical approval was not sought since the study used aggregated data.
Results
Mortality and hospitalisations
Modelling results are presented in table 1. These show changes relative to the preintervention period for KW and non-KW practices. Rates of incident hospitalisation and mortality for CHD and stroke in KW and non-KW practices are shown in figure 1A–D. CHD mortality declined over time in KW and non-KW practices, with KW practices having consistently higher rates than non-KW practices (figure 1A). All results refer to changes after adjusting for seasonal variation and the underlying temporal trends. Following the introduction of KW health checks (vertical line), a small increase of 0.4% in the CHD mortality rate in the KW population was observed (95% CI −5.2% to 6.3%; table 1). In non-KW practices, CHD mortality rates decreased by 0.3% (95% CI −2.7% to 2.2%) over the same period.
Modelled changes in mortality, hospitalisation and prescriptions in KW and non-KW practices comparing preintervention and postintervention periods
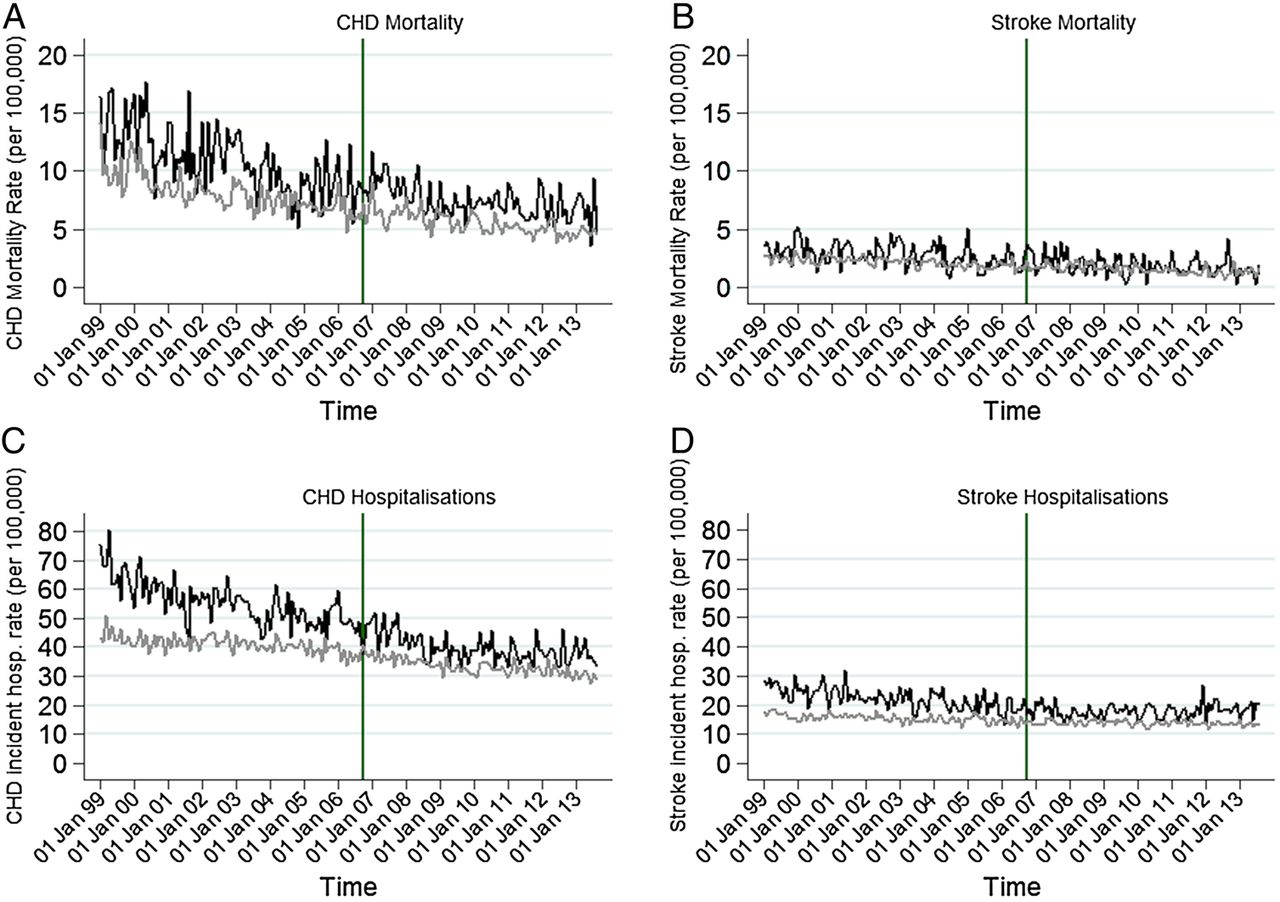
(A–D) Mortality and incident hospitalisation rates (coronary heart disease (CHD) and stroke) in Keep Well (black line) and non-Keep Well (grey line) practices (vertical line indicates introduction of Keep Well intervention).
For stroke mortality, a high degree of month-to-month variability was observed, with an overall downward trend for both groups, with higher rates in KW wave 1 practices (figure 1B). Comparing periods before and after the introduction of KW checks, stroke mortality increased by 6.7% (95% CI −2.6% to 16.9%) in KW practices. The adjusted mortality rate in non-KW practices showed no appreciable change (0.2%; 95% CI −6.7% to 6.7%) during the same period.
CHD incident hospitalisation rates decreased by 1.1% (95% CI −3.4% to 1.3%) in KW practices, comparing the periods before and after the introduction of health checks (figure 1C). In non-KW practices, no appreciable change in CHD incident hospitalisation rates was found (−0.1%; 95% CI −1.8% to 1.7%) comparing the same two periods (table 1). Stroke incident hospitalisations showed a decrease of 1.5% (95% CI −4.4% to 1.6%) in KW practices and no appreciable change (−0.1%; 95% CI −1.5% to 1.3%) in non-KW practices (table 1). The inclusion of the data series of non-KW practices did not alter results for KW practices appreciably (table 1).
Prescribing
In KW and non-KW practices, prescription rates (expressed as DDDs per 100 patients) for all drug classes increased over time, although rates for antiplatelets showed only a small increase. Prescription rates for statins were consistently higher in KW than in non-KW practices (figure 2A), while rates for antihypertensive drugs were similar (figure 2B). For antiplatelet prescriptions, rates started to decline from 2009 onwards (figure 2C). There was some degree of seasonality in rates, in particular for statins and antihypertensive drugs.

(A–C) Mean rates of defined daily doses (DDDs) prescribed by drug class in Keep Well (black line) and non-Keep Well (grey line) practices (vertical line indicates introduction of Keep Well intervention).
Statin prescription rates showed a small increase of 0.4% (95% CI −10.4% to 12.5%) in KW practices following the introduction of health checks (table 1). In non-KW practices, comparison of the corresponding periods showed a decrease in the statin prescription rate of 1.5% (95% CI −9.4% to 7.2%) relative to the underlying trend. In KW practices, the antihypertensive prescription rate decreased by 2.5% (95% CI −12.3% to 8.4%) following the introduction of the KW intervention, whereas in non-KW practices, a decrease of 1.6% (95% CI −7.1% to 4.3%) was observed. The prescription rate for antiplatelets decreased by 0.9% (95% CI −6.5% to 5.0%) in KW practices and by 2.4% in non-KW practices (95% CI −10.1% to 6.0%).
Prescribing at practice level
We considered the possibility that the KW intervention might be more effective in some NHS Boards than others, due to board-level variations in the degree of engagement with the programme by including interaction terms between health board and the intervention (table 1). For statins, a negative association was found between the intervention and prescription rates, suggesting a decrease in prescription rates after the introduction of KW. This decrease was modified by health board area, with NHSGGC showing a larger decrease than the other two health boards (−3.9% (95% CI −7.6% to −0.1%)). Prescription rates for antihypertensive drugs declined at a higher rate in Lothian than in the remaining two health board areas (−5.7%; 95% CI −11.2% to 0.04%). Trends in antiplatelet prescription rates were not altered by the introduction of the KW intervention (figure 2C and table 1). In NHSGGC and Lothian, the intervention was associated with an increase in rates of DDDs, whereas in Lanarkshire, a relative decrease was observed. The GEE models without the interaction terms had a smaller QIC value than those with interactions, partly supporting our conclusions that changes in prescription rates were not markedly modified by health board location.
Online supplementary figure S3A–C shows results displayed as forest plots.
Supplemental material
Discussion
Six years after the introduction of health checks in KW wave 1 practices, any effect of the intervention on trends in CHD and stroke mortality, incident hospitalisations and prescription rates was likely to be very small. Once the seasonal pattern and strong downward temporal trend are taken into account, our results are consistent with both increases and decreases in mortality and hospitalisation following the intervention, but based on the CIs, we can fairly reliably exclude reductions of more than 1–2% in hospitalisations and of more than 3–6% in mortality (because of the greater uncertainty due to the smaller number of deaths).
Comparing the periods before and after the start of KW health checks, we found small relative declines in prescribing of statins, antihypertensive and antiplatelet drugs. These declines were observed in KW and non-KW practices.
Strengths and limitations
The data have complete national coverage and are likely to accurately estimate the incidence of CVD and CVD-related prescribing in Scotland with a low likelihood of missing cases or misclassification. The ARIMA models were supported by relatively long time series available both before and after the intervention and accounted for random variation, temporal trends and seasonality. The health outcomes were clearly linked to the original defined purpose of ‘wave 1’ of KW and allowed the theory to be evaluated at different points after implementation.
We limited the analysis to ‘wave 1’ because subsequent waves had a less consistent focus on CVD, operated in more diverse settings where consistent monitoring data were not always available, and had a shorter duration of follow-up.
We were not able to access individual-level data nationally because information sharing was not agreed with general practitioners (GPs). This meant that we had to define the eligible population at practice level (for prescriptions) or for specific age groups within practices (for hospitalisations and mortality) and no adjustments for patient characteristics was possible. However, any changes in practice configuration (age structure, sex and deprivation) would be similar in KW and in non-KW practices. Since the analyses compare changes within KW practices and changes within non-KW practices, it is unlikely that aggregation would affect results. Furthermore, aggregation meant a reduction in the power of the study to detect any impact of the intervention by misclassifying some untreated individuals as treated. Similarly, it is likely that the comparison group (the rest of the Scottish population) included some people who received a health check as part of subsequent waves of KW. The effect of both of these factors would be to dilute the measured impact of KW, creating a bias towards a null result. However, KW recipients other than wave 1 formed a very small proportion of the overall Scottish population, so the impact of this bias is likely to be small. It is also important to recognise that analyses at individual level (as performed in some local studies) provide information only on efficacy (ie, potential benefits for those who actually received checks) rather than on real-life population impact. Although aggregate mortality and hospitalisation data were used in our analyses, this approach is likely to give a more realistic estimate of the ‘real-life’ effectiveness of the programme.
Information was available on the approximate dates on which each general practice started health checks as part of KW wave 1 but not on the speed or intensity with which the intervention was implemented. If some practices implemented the programme in a less vigorous way, this may have diluted the impact of KW. Our analyses of prescription rates including interaction terms between health board and the intervention variable attempted to account for overall variations between practices in different health boards.
Clinical guidelines first published in 2007 recommended that CVD risk should be assessed in all individuals aged 40 years and above at least every 5 years, although this was based on low-quality evidence.20 Guidelines also recommend (for those at high risk) prescription of antiplatelet therapy and statins, and antihypertensive therapy for those with hypertension.21–23 However, the effectiveness of CVD screening programmes has been disputed for some time,24 ,25 with the latest Cochrane reviews concluding that there is evidence for a reduction in risk factors but not mortality or morbidity and that universal health checks should therefore be abandoned.26 ,27
Evaluation of health checks in England have found that, on average, there is no evidence of an increased identification of undiagnosed disease28 but some evidence of decreased CVD risk.29 ,30 A recent study reported an increased detection of hypercholesterolaemia but no increase in detection of obesity, smoking and hypertension.31 However, these studies do not account for secular trends (eg, declining smoking rates) and one is subject to a number of important biases including regression to the mean and selection bias.32
Although these results are somewhat imprecise, they make it very unlikely that the implementation of the first wave of KW health checks in Scotland was associated with substantial or important changes in CVD outcomes or prescribing. It is possible though that the overall level of health check coverage was not sufficient to produce a measurable effect or that participants did not receive all the interventions that were originally planned. This, however, reflects the nature of an effectiveness study (rather than efficacy) and is perhaps a more realistic assessment of the real-world impact. It is possible that while the individual components of the KW check (drug therapy, lifestyle advice, etc) are effective in trial situations, other factors including the challenges of programme delivery and the individual situations of people in deprived circumstances mean that their real-life effectiveness is much less. This may also include variations in care delivered by different healthcare professionals; that is, nurses, GPs and other staff.
Our analyses include a 6 years follow-up, but it is possible that clear benefits might only emerge later because of the length of time required for primary prevention to reduce risk factors and decrease morbidity and mortality at population level. Given the change in prescription rates was found to be small, it seems unlikely that mortality and hospitalisation rates would change.
Conclusions
Effective interventions are available for primary CVD prevention. However, our findings are consistent with systematic reviews suggesting that delivering these interventions in a systematic population wide way may not be effective. The KW approach (like the English Health Check programme) is essentially a screening programme, and more rigorous evidence of effectiveness is required before it is adopted. Our interrupted time series approach could be criticised as a weaker design than cluster randomisation or stepped wedge approaches. We suggest that for large-scale population interventions, randomised approaches are more feasible than currently assumed by policymakers, and we think they should be more widely used.
What is already known on this subject
Effective interventions are available to reduce cardiovascular risk. In theory, these could prevent cardiovascular disease (CVD) in asymptomatic individuals and narrow existing socioeconomic inequalities in health.
Health check programmes have been implemented to specifically target those at high risk of CVD, but there is controversy about whether these are likely to be effective at the population level and about whether a screening approach is justified.
A key early aim of the Scottish Keep Well programme was to narrow socioeconomic inequalities in CVD by targeting individuals living in deprived areas, screening for CVD risk factors and then providing drug therapies (eg, statins and antihypertensives) and lifestyle advice for those at high risk.
What this study adds
Our study suggests that, after accounting for seasonal and secular trends, the effect of the Keep Well intervention on CVD mortality and incident hospitalisation was unlikely to be substantial.
Acknowledgments
The authors thank Diane Stockton and Bill Boyd for help with data extraction and Heather Jarvie, Shona Hyman, Philip Conaglen and the NHS Lanarkshire Keep Well team for help in identifying participating practices, and Theresa King for programme information and gathering archive data.
References
Footnotes
Contributors All authors conceived the article. CG, JDL and DFM carried out the statistical analysis and prepared the first draft of the manuscript. All authors contributed to editing the manuscript and approved the final version submitted for publication. CMF, GM and JM provided critical and policy input and revised the manuscript.
Funding NHS Health Scotland led the national evaluation of Keep Well and this analysis was commissioned from the University of Glasgow as part of that evaluation, with funding from the Scottish Government.
Competing interests None declared.
Provenance and peer review Not commissioned; externally peer reviewed.
Data sharing statement Data are available on request from the corresponding author.