Article Text

Abstract
Background Research comparing mortality by socioeconomic status has found that inequalities are not the smallest in the Nordic countries. This is in contrast to expectations given these countries’ policy focus on equity. An alternative way of studying inequality has been little used to compare inequalities across welfare states and may yield a different conclusion.
Methods We used average life expectancy lost per death as a measure of total inequality in mortality derived from death rates from the Human Mortality Database for 37 countries in 2006 that we grouped by welfare state type. We constructed a theoretical ‘lowest mortality comparator country’ to study, by age, why countries were not achieving the smallest inequality and the highest life expectancy. We also studied life expectancy as there is an important correlation between it and inequality.
Results On average, Nordic countries had the highest life expectancy and smallest inequalities for men but not women. For both men and women, Nordic countries had particularly low younger age mortality contributing to smaller inequality and higher life expectancy. Although older age mortality in the Nordic countries is not the smallest. There was variation within Nordic countries with Sweden, Iceland and Norway having higher life expectancy and smaller inequalities than Denmark and Finland (for men).
Conclusions Our analysis suggests that the Nordic countries do have the smallest inequalities in mortality for men and for younger age groups. However, this is not the case for women. Reducing premature mortality among older age groups would increase life expectancy and reduce inequality further in Nordic countries.
- Inequalities
- Mortality
- Demography
This is an open-access article distributed under the terms of the Creative Commons Attribution Non-commercial License, which permits use, distribution, and reproduction in any medium, provided the original work is properly cited, the use is non commercial and is otherwise in compliance with the license. See: http://creativecommons.org/licenses/by-nc/3.0/ and http://creativecommons.org/licenses/by-nc/3.0/legalcode
Statistics from Altmetric.com
Introduction
Improving average population health and reducing inequalities are key aims for governments, with a prominent argument being that the root cause of variation in average health and the level of inequality is socially determined.1 So comparing countries is a fundamental way of identifying how population health can be improved, and health inequalities reduced, through understanding how different policies and policy regimes impact on the social determinants of health.1 ,2 Rose provided theoretical and empirical evidence that changes in a country's policy context could improve both population health and limit the extent of poor health as the whole population distribution would tend to shift for the better.3 There has been extensive debate since on whether improving population health could also reduce inequalities with the suggestion that structural socioeconomic change may achieve both.4 ,5 Yet while studies of population level health have almost invariably concluded that it is enhanced by the relatively generous welfare provision of the Social Democratic Nordic countries, especially when contrasted to the Anglo-Saxon countries6–9 results from most—but not all—of the recent comparative studies of health inequalities suggest that the Nordic states do not have the smallest inequalities.10–13 This is a public health ‘puzzle’ as it is contrary to both empirical and theoretical expectations given (1) the high performance of Nordic countries in terms of overall health; (2) their policy focus on equity via a strong and redistributive social democratic welfare state and (3) the social determinants of health literature.1 ,14 ,15 Various reasons have been posited to explain this ‘paradox’ including artefact (that there are problems with the ‘relative’ measures used to assess health inequalities), health behaviours (that inequalities in smoking and obesity are greater in the Nordic countries), materialist (eg, the role of inequalities in access to health services in the Nordic states), psychosocial (such as the issue of ‘relative deprivation’ in the Nordic countries); life course (that different causal mechanisms and processes may lie behind the social gradient in the Nordic countries than in other countries)15 or that the size of Nordic health inequalities points to a failure of their welfare states to be radically redistributive.16 In this paper we build on the artefact explanation by examining the ways in which inequalities are measured in comparative social epidemiology.
There are two main ways of studying inequality, one compares average levels of health between socioeconomic groups and the other compares the overall distribution of health in society.17 The first approach dominates the literature according to a recent systematic review on inequality and welfare states.18 The second approach (which is dominant in the study of the distribution of income) while having the disadvantaged of not explicitly including socioeconomic groups will capture all inequality in a society. This may be important to do from a social determinants perspective which emphasises the multifaceted causes of inequality.1 In this paper we add to the literature by exploring the level of total inequality (defined as all the variance in the health outcome incorporating both between-group and within-group variation17) by welfare state (and for each country) to compare different welfare state regimes and to assess whether Nordic states have the smallest inequalities using this method.
Method
From life tables we used single year of age (ages 0–110+) death rates for 2006 (chosen as the latest year that had the most countries available for analysis at the time of analysis), compiled and calculated by the Human Mortality Database for all countries available in that year.19 We chose to limit the analysis to countries in the Human Mortality Database because of the high quality of the information. As death rates were available for England and Wales, Scotland and Northern Ireland we included these separately rather than the UK as a whole. Life tables were constructed using standard methods (taking ‘ax’ formula from a published spreadsheet because we needed to recreate life tables numerous times).20 There were two stages to the analysis: first we measured mortality inequality using average lost life expectancy per death as our measure.21 This was calculated as follows: first we calculated the average life expectancy a person would lose by dying at their age by taking the average of life expectancy at the start of their year of age and life expectancy at the start of the next year of age (for the oldest age group of 110 plus we simply used life expectancy at the start of the period). Second we weighted this average by the proportion of life table deaths occurring in the age period and third we summed these weighted values across all ages to derive the total lost life expectancy across all age groups. For example, say 1% of people died aged 50, and life expectancy at 50 was 30 years and at 51 was 28 years, lost life expectancy for deaths in the 50th year would be 0.01×(30+28)/2=0.29 years. Repeating the calculation for each age and summing across ages gives you the total lost life expectancy for that year. This measure correlates strongly with other distributional measures of mortality inequality, for example, the Gini coefficient but has the advantage that it is measured in years and is intuitive to understand.21 In sensitivity analysis we also calculated the Gini coefficient and the standard deviation (SD) for the age of death using published formula to compare to the results using lost life expectancy.22 We also studied life expectancy because research has shown that there is a strong correlation between life expectancy and mortality inequality in high life expectancy countries so that higher life expectancy is associated with low inequality.23 Thus it has been shown that the best-performing countries in life expectancy over the last century or so have also been among the most equal.23 This correlation arises because gains in life expectancy have occurred from two processes. The first is mortality compression which is the reduction of premature mortality. The second is mortality expansion that is the reduction of later life, non-premature, mortality. However, only saving premature deaths reduces inequality because the distribution of the age of death is compressed as a result. Saving later life deaths increases inequality as it expands the distribution of the age of death.23 Which age separates premature mortality from non-premature mortality is a property of the data and the inequality measures themselves (it is not defined by us) and it varies between countries and will tend to rise as life expectancy rises.24 As different inequalities measures will lead to slightly different threshold ages it is important to test the impact of this on results25 and we do this in our sensitivity analysis already outlined.
In the second stage of analysis, we explored the impact of age-specific death rates on inequality and life expectancy differences. For a comparator we created a theoretical country based on the lowest death rates in 2006. To do this, for each age we found the lowest death rate among the 37 countries in 2006 and then combined these death rates to create a life table and derive life expectancy and lost life expectancy for this theoretical country. To derive the specific influence of differences in age-specific death rates between each country in turn and our theoretical country on their respective difference in life expectancy and level of inequality we used the stepwise replacement method.26 This involves substituting in order (from age 0 onwards) each age-specific death rate from the life table of the country being compared with the theoretical country's life table and vice versa. With each substitution the life table, life expectancy and lost life expectancy are recalculated for the country being compared and for the theoretical country. The difference between the value of life expectancy and lost life expectancy before the death rate substitution and the current value after substitution is the age-specific contribution to the difference in life expectancy and lost life expectancy. As two age-specific contributions are derived (from the country being compared to theoretical country and the theoretical country to the country being compared) the average at each age is taken. We used Stata for all analysis.
As a method for providing a descriptive overview of countries with similar political economies we chose to group countries using the welfare state typology of Ferrera adapted by us to incorporate the additional countries (see online supplementary box 1 ).27
Results
Men
Table 1 shows mean life expectancy and inequality by welfare state type in order of highest and smallest, respectively. Men in Nordic countries on average have the highest life expectancy and the smallest inequality. In sensitivity analysis, on average Nordic countries also ranked first when inequality was measured using the Gini coefficient and the SD (see online supplementary tables S1 and S3). However, there is a considerable variation within welfare state type so that there is overlap in the ranges between all welfare state types apart from Eastern European (life expectancy) and Ex-Soviet countries (both life expectancy and inequality).
Average life expectancy and inequality by welfare state type
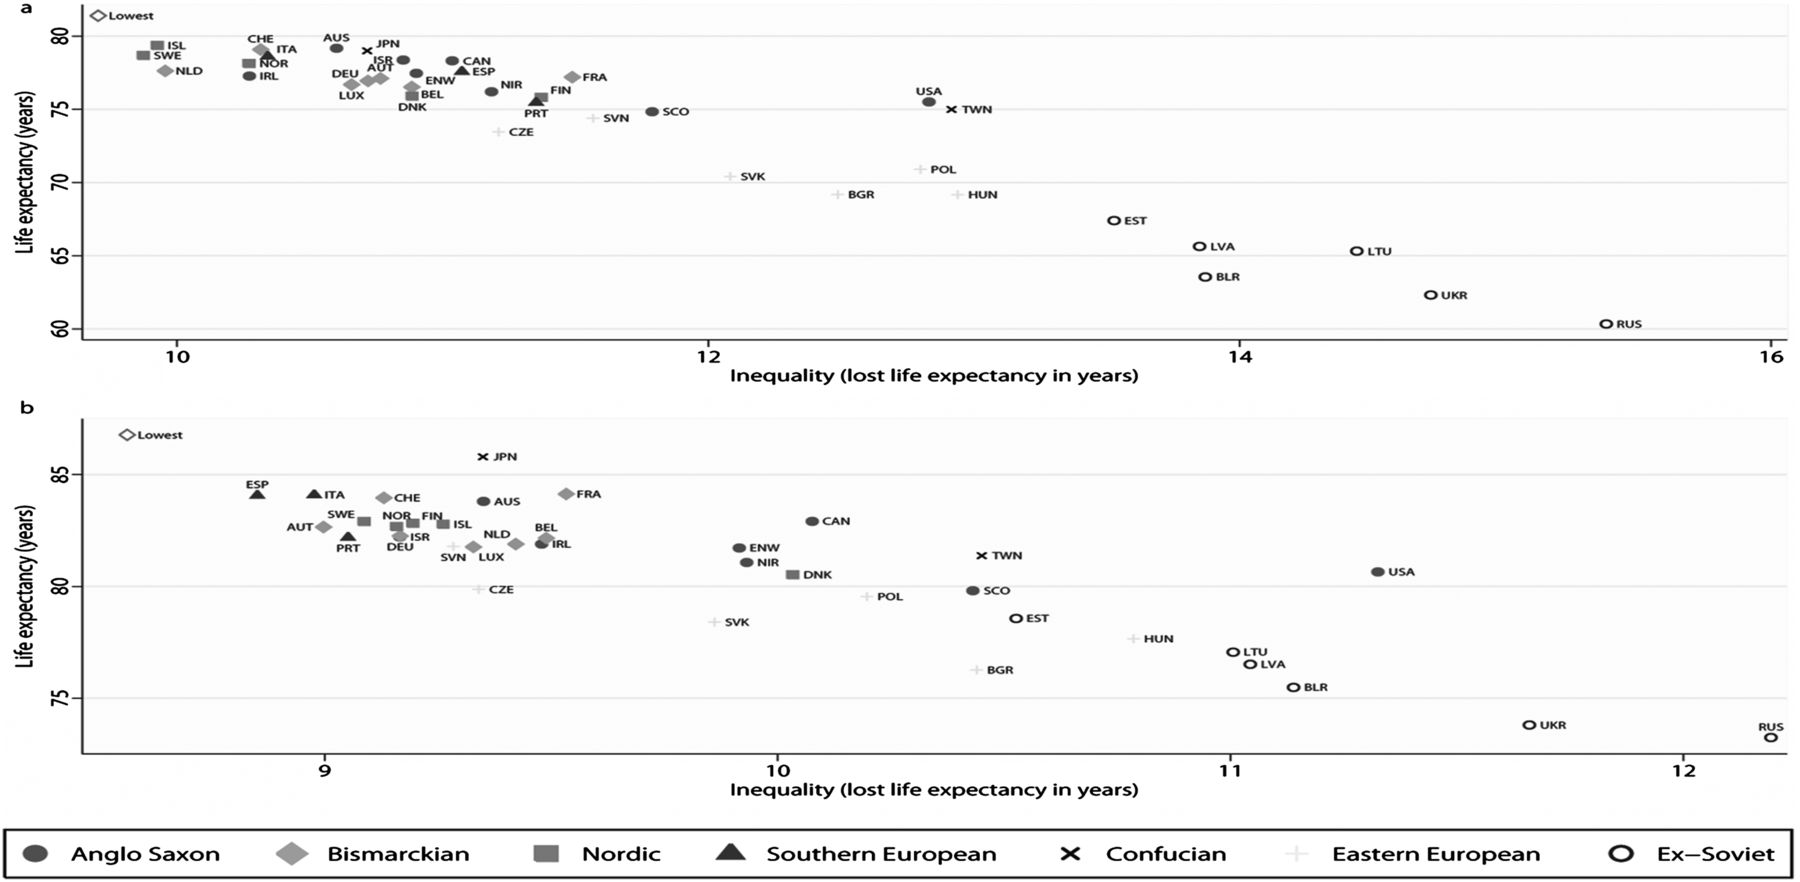
Relative to the theoretical lowest mortality country (table 2), Nordic countries on average lost least life expectancy and gained most equality due to having low premature mortality (compression). However, they were not the best performing for non-premature mortality (expansion) and so this lost them life expectancy. Yet, these higher older age death rates (from around 80 plus) meant that inequality was lowered in comparison. Table 2 also shows that higher death rates for premature death (compression) are quantitatively more important to differences in life expectancy and inequality than later life deaths. Figure 1 plots the individual countries by life expectancy and inequality. It illustrates the strong negative correlation (−0.94) between life expectancy and inequality: countries with less inequality also had higher life expectancy. It also shows that the performance of Nordic countries was split slightly between the highest performing countries of Sweden, Iceland and Norway versus Finland and Denmark who performed slightly less well. Figure 2 shows the contribution of each age to the difference in life expectancy and inequality compared to the theoretical lowest mortality country for each Nordic country. Here we see that for the better-performing Nordic countries, shown on the top row, ages up to around 70 were generally near the zero line indicating that they were near to being the best-performing country for these ages. After this we see a shift away from the zero line, indicating higher death rates than in the best-performing country, leading to lower life expectancy but because we enter mortality expansion at these ages they led to reduced inequality. Finland and Denmark differ as at younger ages (particularly later working ages—around 40 plus) death rates were higher meaning increased inequality and reduced life expectancy.
Contribution of mortality compression and expansion to differences to the theoretical lowest mortality country

Life expectancy and inequality (lost life expectancy) in years in 2006 for men (A) and women (B) (AUS, Australia; AUT, Austria; BEL, Belgium; BGR, Bulgaria; BLR, Belarus; CAN, Canada; CHE, Switzerland; CZE, Czech Republic; DEU, Germany; DNK, Denmark; ENW, England and Wales; ESP, Spain; EST, Estonia; FIN, Finland; FRA, France; HUN, Hungary; IRL, Ireland; ISL, Iceland; ISR, Israel; ITA, Italy; JPN, Japan; LTU, Lithuania; LUX, Luxembourg; LVA, Latvia; NIR, Northern Ireland; NOR, Norway; POL, Poland; PRT, Portugal; RUS, Russia; SCO, Scotland; SVK, Slovakia; SVN, Slovenia; SWE, Sweden; TWN, Taiwan; UKR, Ukraine; USA, USA; Lowest, theoretical lowest mortality country).
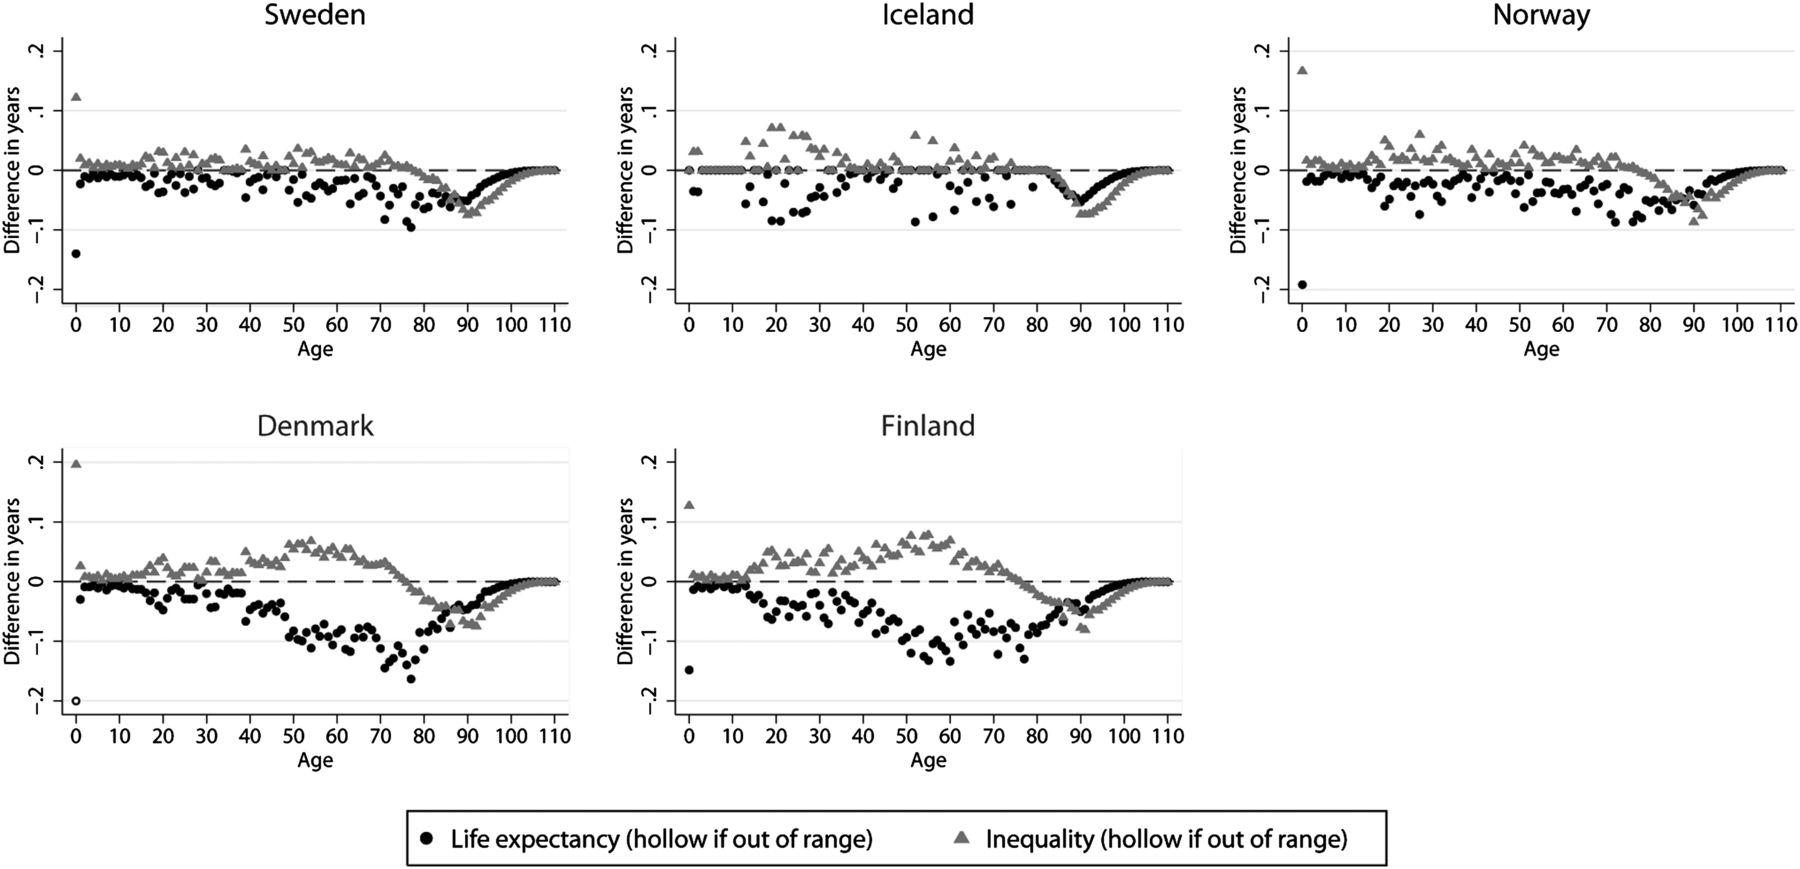
Nordic countries and age-specific differences to the theoretical lowest mortality country for men.
Women
For women, Nordic countries were not the most equal on average nor did they have the highest life expectancy (table 1). Average life expectancy was highest in the Confucian countries (mainly due to the very high life expectancy of Japanese women—see figure 1) and inequality smallest in Southern European countries. Generally, the range of inequality and life expectancy was less than for men although the Ex-Soviet countries were again notable for their poor performance. In the sensitivity analysis (see online supplementary tables S2 and S4) the rank of Nordic countries improved to second—from third—when judged by the SD as this measure tends to have a lower threshold age24 and thus is influenced more by death rates in younger ages.
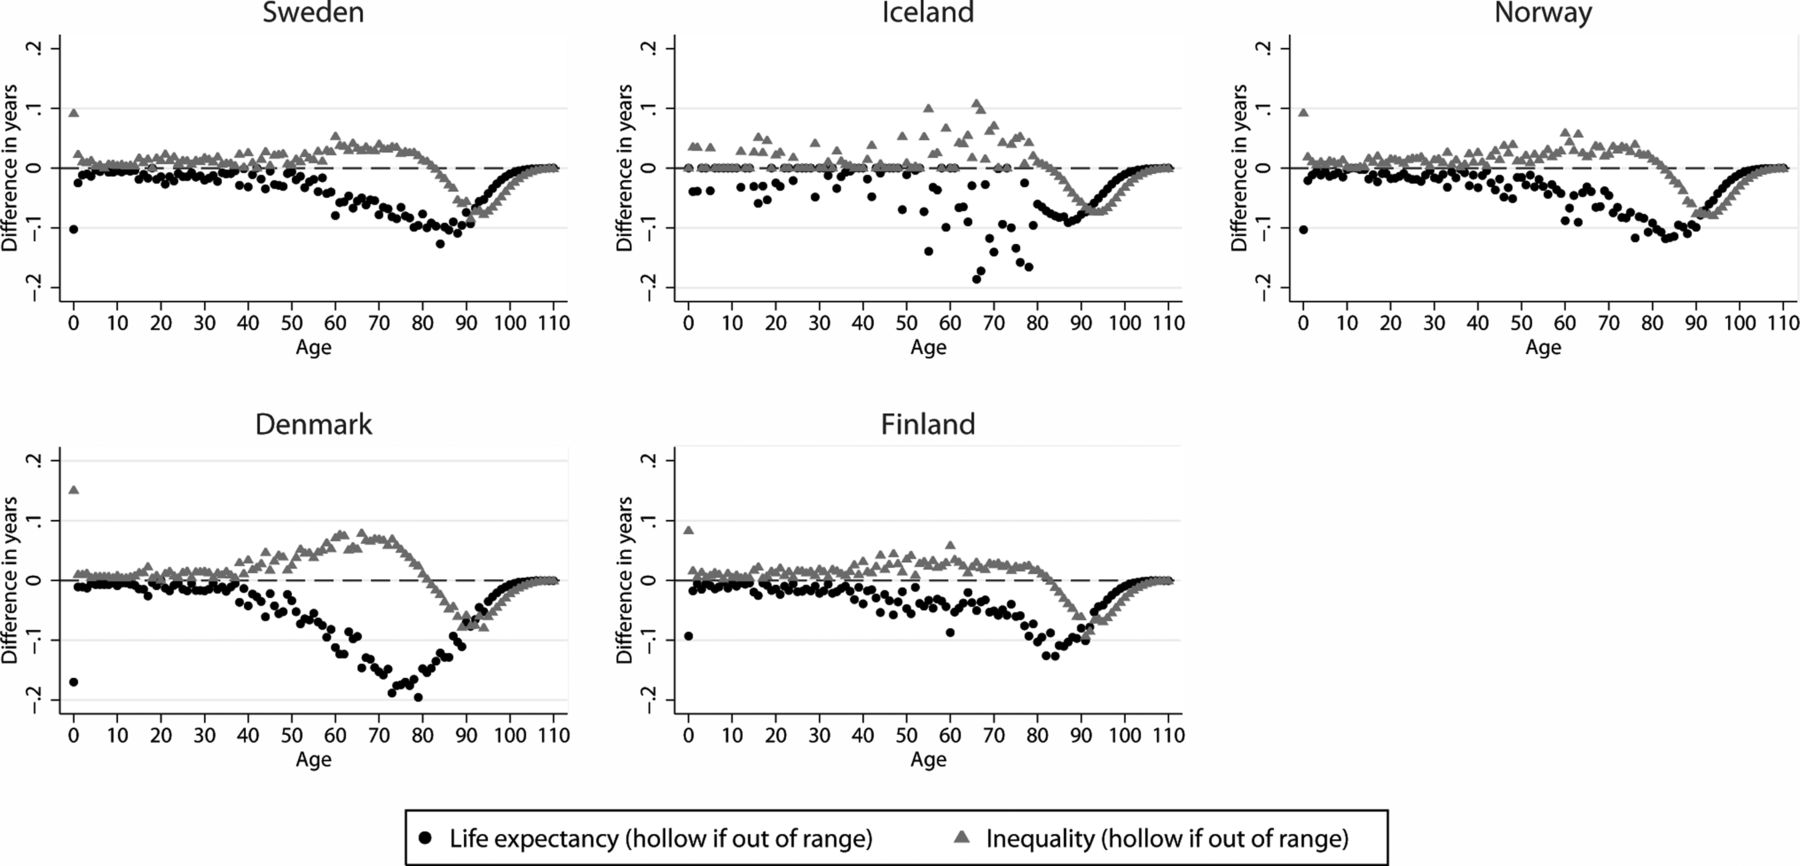
Southern European countries performed best in terms of premature mortality as they had the least difference from the theoretical lowest mortality country for mortality compression (table 2). Confucian countries had lower later life mortality as reflected in their very small amount of difference due to mortality expansion. Figure 3 shows the difference to the theoretical lowest mortality country by single years of age for the Nordic countries. Generally, the pattern was for them to perform well in early and working ages losing little life expectancy and gaining little inequality compared to the theoretical lowest mortality country. Life expectancy and equality was lost in post-retirement ages onwards although some equality was gained in the oldest ages because this leads to less mortality expansion. Denmark stands out as having higher mortality earlier (from around ages 40 onwards) contributing to its lower life expectancy and higher inequality as illustrated in figure 1.

Nordic countries and age-specific differences to the theoretical lowest mortality country for women.
Discussion
Our total inequality method-derived results suggest that the Nordic welfare state countries tended to achieve both the highest life expectancy and the smallest inequality for men but not women. For men and women Nordic countries generally had low infant and working age mortality. In general, though older age mortality in Nordic countries is not the lowest and so reducing this (particularly for women) would increase life expectancy, and for ‘younger’ older age deaths, reduce inequality. In contrast, the most prominent comparative work using the socioeconomic group difference approach (using education as the main measure of socioeconomic status) to mortality by Mackenbach et al10 “found no evidence for systematically smaller inequalities in health in countries in northern Europe.” In that study, it was the Southern European countries that were found to have the smallest overall inequalities in mortality for men and women. We found the same result for women but not men. There are a number of differences between that study and ours including the age range (we covered the whole age range) and the time period (2006 compared to 1990s mortality). Most obviously we used a measure of mortality inequality, total inequality, that was not based on socioeconomic group comparisons.
Our research also found clear variation among the Nordic welfare state regime countries with Sweden, Iceland and Norway having higher life expectancy and smaller inequality than Denmark and Finland (men only). A recent study that explored both overall and within group variation in the age of death (ages 35 and above) also found that the Nordic countries for men (Sweden, Norway) and women (Sweden, Norway and Finland) had small overall variance in the age of death although it included fewer countries (10) and no Southern European countries.28 Another recent study using total inequality (but with a slightly restricted age distribution that excluded under 10 mortality, fewer countries and no gender split) also found that on average inequalities were smallest in the Nordic welfare state regime but with significant within welfare state variation.29
This highlights another crucial methodological problem in comparative epidemiological research—the use of ‘welfare state regimes’, a concept which assumes a homogenous approach to welfare provision within and between the countries of any particular regime type. Kasza has asserted that instead of an internal policy homogeneity or cohesion, welfare states and welfare regimes exhibit significant variation across different areas of social provision.30 Further, welfare state provision has changed over time (with decreasing decommodification especially in countries such as Sweden and Finland since the recession of the early 1990s) yet there is a lag between our typology (with its roots in the 1990s) and our mortality data (2006). For example, there is evidence from recent comparative analysis of a degree of convergence between Nordic countries and some other western European countries due to Nordic states becoming more like other European countries (slightly less equity focused as a result of welfare state retrenchment and marketisation since the 1990s).31 This has led to the development of other ways of analysing cross-national differences in social policy, most notably the ‘varieties of capitalism’ approach which acknowledges the commonality in economic organisation between the Nordic countries and the Bismarckian countries.32 Future comparative research into health inequalities would benefit from examining this approach.32 In this paper we used the regimes approach as we are building on existing work but we have also presented individual country results so that the limitations of the welfare regimes typology do not restrict our analyses. Others have advocated for the analysis of specific social policies as an alternative way of conducting comparative research on inequalities and the social determinants of health.33
The main criticism of our approach is that it is does not include a measure of socioeconomic inequality34 with a long running debate about whether the total inequality or between group approach is most appropriate measure of inequality. We, and others17 ,35 see these as complementary rather than rival methodological approaches with both being important to understanding and tackling inequality. In cross-country comparative work there are concerns about how comparable similarly classified socioeconomic groups actually are in different countries.36 There are also concerns that using different socioeconomic classifications gives differing results (eg, income-based studies of morbidity by welfare state have produced different country configurations than education based ones11 ,13). There is also the issue that categorisation into relatively large socioeconomic groups may well obscure health differences between people similarly grouped as the concept of the social gradient in health indicates an often continuous relationship between socioeconomic position and health.1 Relatedly life course research indicates that socioeconomic position across the life course may have an incremental impact on health that may not be fully captured by contemporaneous or single measures of stratification.2 Using a total inequality measure overcomes these difficulties and captures inequality related to all forms of socially determined stratification.36 A potential drawback is that it may capture non-socially determined inequality with recent estimates suggesting that between socioeconomic group differences capture only a minority of the overall total inequality.35 While it is likely that there is a large amount of essentially random variation in the age of death within populations, due to chance and individual genetic susceptibility, it has been argued that when comparing groups (in our case countries) this random variation may well be averaged out meaning that differences in the level of inequality between groups are likely driven by causal factors.37 What is a key but still open question is explaining why total inequality is different between countries (and for specific age groups) and how much of this difference is socially determined. It is prominently argued that differences in (premature) mortality between countries are mostly socially determined with those lower down the social scale within the country most vulnerable.1 For example, recent work found that within education group variance in the age of death was greatest for those in the lowest groups in all countries and that countries with the lowest level of overall variation in the age of death achieved this by having the least variation among those lowest educated.28
It has been argued that equity focused social policy alone may not be enough if other important policies for good health are not in place.10 This is evident in how our research highlights that Denmark had higher death rates and inequalities than we might expect and this is probably linked to high levels of smoking.38 National tobacco control policy in the mid-2000s was noticeably weaker in Denmark compared to other Nordic countries and this may have had a negative impact on the quit rates of smokers from across the social spectrum.39 National tobacco control policy is a political issue and so should be regarded as an important part of a social determinant-based public health policy.1 In line with Karim et al40 then, we would argue that future research on welfare state regimes and population health needs to incorporate wider public health indicators, not just social policy ones, resulting in a ‘public health regime’ approach that examines the legislative, social, political and economic structures that have an impact on both public health and public health interventions.
Of course simply describing these differences is not sufficient and further work is needed to fully understand the reasons for differences in inequality between countries. Health inequalities exist in all countries but they may do so for different reasons. For example, Southern European countries are at an earlier stage of the smoking epidemic than Northern European countries. So comparing Southern and Northern European countries without accounting for this difference is not unproblematic. As others have argued future research should explore in more detail the temporality of policy effects as there may well be significant delays in effects on mortality.2 Moreover, and including this study, most comparative research on mortality inequalities has been descriptive and observational and there is a need for more quasi experimental work to properly assess the impact of different policies independent of possible confounders. Another limitation is that we used 1 year's worth of data—2006. We chose to use the most up-to-date figures (based on the most recent year covering the most countries for which data was available at the start of our study) and future studies should explore longitudinal changes in inequality broken down by age and cause of death to gain a fuller understanding of how welfare state and other aspects of the public health regime of countries influence death rates. A final limitation is that we created a theoretical lowest mortality country in order to conduct the age decomposition. This may be an artificial comparison as such a combination of death rates is not observed in a single country but it does have the advantage of not being a comparison to an arbitrarily chosen comparator country.
What is already known on this subject
-
Studies comparing the level of health across socioeconomic groups have found that inequalities are not smallest in equity-focused Nordic countries.
What this study adds
-
This study uses an alternative method of studying inequality and finds evidence of smaller inequalities in Nordic countries for men but not women. How we assess inequality in a broad social determinants framework requires debate.
References
Supplementary materials
Supplementary Data
This web only file has been produced by the BMJ Publishing Group from an electronic file supplied by the author(s) and has not been edited for content.
Files in this Data Supplement:
- Data supplement 1 - Online supplement
Footnotes
Contributors FP had the original idea that was developed with CD and CB. FP conducted the analysis. FP wrote the first draft and all authors contributed to subsequent redrafts.
Competing interests None.
Funding No funding bodies played any role in the design, writing or decision to publish this manuscript. FP is funded by the MRC (MC_US_A540_5TK10).
Provenance and peer review Not commissioned; externally peer reviewed.
-
Open Access This is an Open Access article distributed in accordance with the Creative Commons Attribution Non Commercial (CC BY-NC 3.0) license, which permits others to distribute, remix, adapt, build upon this work non-commercially, and license their derivative works on different terms, provided the original work is properly cited and the use is non-commercial. See: http://creativecommons.org/licenses/by-nc/3.0/