Article Text

Abstract
Background In the Netherlands in 2020, COVID-19 deaths were more concentrated among individuals with a lower income. At the same time, COVID-19 was a new cause that also displaced some deaths from other causes, potentially reducing income-related inequality in non-COVID deaths. Our aim is to estimate the impact of the COVID-19 pandemic on the income-related inequality in total mortality and decompose this into the inequality in COVID-attributed deaths and changes in the inequality in non-COVID causes.
Methods We estimate excess deaths (observed minus trend-predicted deaths) by sex, age and income group for the Netherlands in 2020. Using a measure of income-related inequality (the concentration index), we decompose the inequality in total excess mortality into COVID-19 versus non-COVID causes.
Results Cause-attributed COVID-19 mortality exceeded total excess mortality by 12% for the 65–79 age group and by about 35% for 80+ in the Netherlands in 2020, implying a decrease in the number of non-COVID deaths compared with what was predicted. The income-related inequality in all-cause mortality was higher than predicted. This increase in inequality resulted from the combination of COVID-19 mortality, which was more unequally distributed than predicted total mortality, and the inequality in non-COVID causes, which was less unequal than predicted.
Conclusion The COVID-19 pandemic has led to an increase in income-related inequality in all-cause mortality. Non-COVID mortality was less unequally distributed than expected due to displacement of other causes by COVID-19 and the potentially unequal broader societal impact of the pandemic.
- MORTALITY
- COVID-19
- Health inequalities
- PUBLIC HEALTH
Data availability statement
Data may be obtained from a third party and are not publicly available. The results presented in this article are based on calculations by the authors using non-public microdata from Statistics Netherlands (CBS). Under certain conditions and a confidentiality agreement, these microdata are accessible for statistical and scientific research. For further information: microdata@cbs.nl.
This is an open access article distributed in accordance with the Creative Commons Attribution Non Commercial (CC BY-NC 4.0) license, which permits others to distribute, remix, adapt, build upon this work non-commercially, and license their derivative works on different terms, provided the original work is properly cited, appropriate credit is given, any changes made indicated, and the use is non-commercial. See: http://creativecommons.org/licenses/by-nc/4.0/.
Statistics from Altmetric.com
WHAT IS ALREADY KNOWN ON THIS TOPIC
While excess mortality and cause-attributed COVID-19 mortality during the pandemic have been found to be higher among lower socioeconomic groups, diverging effects on the socioeconomic gradients have been found for other causes.
Many existing studies relied on geographical units to measure socioeconomic status.
WHAT THIS STUDY ADDS
We investigate the inequality in cause-specific mortality during the COVID-19 pandemic using individual data for the entire population on cause of death and household income.
COVID-19 increased the income-related inequality in total mortality in 2020 in the Netherlands compared with trend-predicted mortality.
The deaths from other causes, in particular respiratory and mental causes, were lower than predicted and also less unequally distributed by income.
Our findings mark the importance of taking socioeconomic differences in prior health into account in assessing and managing the socioeconomic impact of future pandemics.
HOW THIS STUDY MIGHT AFFECT RESEARCH, PRACTICE OR POLICY
Our findings highlight the importance of equity concerns for next pandemics.
If future pandemic response policies are to avoid a rise in inequality, greater investments in the pro-poor targeting of testing, vaccination and other interventions may be required.
Introduction
Reports from across the world suggest that existing inequalities in mortality1 between socioeconomic groups have been exacerbated by the COVID-19 pandemic.2–6 Also in the Netherlands in the first 4 months of the pandemic, the risk of dying from COVID-19 in 2020 for people over 70 was twice the risk for the lowest income quintile compared with the highest income quintile.7
The way in which pre-existing socioeconomic inequalities in health have shaped inequalities in total mortality during the COVID-19 pandemic is still unclear. On the one hand, the poorer mean health of individuals in lower socioeconomic groups may make them more susceptible to adverse health outcomes, deriving from the incidence of COVID-19 itself and resulting from the societal response to the virus such as delays in care provision.8 On the other hand, the concentration of prior health conditions related to COVID-19 mortality, such as overweight, diabetes, chronic obstructive pulmonary disease (COPD) and heart disease,9 among groups with a lower socioeconomic status6 10 may have reduced the inequality in deaths by other causes: a relatively large share of individuals with a low socioeconomic status who died from COVID-19 would otherwise have died in the same period from another cause.
The aim of our study is to estimate the impact of the COVID-19 pandemic on the income-related inequality in total mortality and decompose this impact into the inequality in COVID-attributed deaths and changes in the inequality in non-COVID causes. We do this for the Netherlands in 2020 using individual linked microdata for the entire population, measuring income-related inequality using a concentration index.
Data and methods
Data sources and sample
We aggregate data on deaths and population counts per age, sex and income group for the years 2015 up to 2020 based on individual-level data for the entire population made available by Statistics Netherlands. Our data come from three administrative sources that can be linked through the (anonymised) citizen service number (BSN): (1) sex and date of birth and death of individuals from municipal registries; (2) cause of death (COD) from death registries; and (3) household income data from tax registries. We restricted our attention to four age-sex groups (men and women at ages 65–79 and 80+) that together account for the large majority (94%) of COVID-19-related deaths in the Netherlands. Although the relative inequality in COVID-19 mortality below the age of 65 might be substantial, the absolute number of COVID-19 deaths in that age group is too low (1054 in total) to expect any meaningful effects on the inequality in total mortality.
Deaths by cause
Data on causes of death were derived from the death certificates. The causes of death reported on the certificates are converted into International Classification of Diseases 10th Revision (ICD-10) codes by Statistics Netherlands, based on WHO guidelines.11 The underlying cause may be difficult to identify for patients with a COVID-19 infection and comorbidities like COPD. However, by performing body autopsies, Elezkurtaj et al 12 found that the majority of such patients indeed died from lung damage caused by COVID-19 rather than by other comorbidities. Our data only contain the underlying cause and not the other causes from which the underlying cause was inferred.
We classify deaths as resulting from COVID-19 using ICD-10 codes U07.1 (virus identified) and U07.2 (virus not identified, but probable or suspected) based on primary COD data. About 13% of classified COVID-19 deaths are based on the latter code.
The non-COVID-19 causes of death are divided into circulatory, respiratory, cancer, mental and other causes. We chose these four plus ‘other’ because they have been identified as being affected by the pandemic.8 13
Income groups
We use disposable annual household income (total household income net of taxes and income transfers, adjusted for household size) for 2019 to determine income groups. Those living in the Netherlands in 2020 and without an observation of full-year income in 2019 are excluded. For every age-sex group and year, we rank all individuals by their household income and divide them into 20 groups—or ventiles—of equal size. To control for potential (within age-sex group) differences in the age composition across income groups and over time, we use population weights based on 1 year age groups on 1 January 2020 within each age-sex group when calculating mortality.
Measurement of mortality
To determine what the mortality in 2020 would have been in the absence of COVID-19, we compute trend-predicted mortality probabilities ( ) in 2020 by estimating linear trends for each age, sex and income group for the years 2015–2019, and then predict the mortality probabilities in 2020. By subtracting trend-predicted from observed total mortality, we obtain an estimate of total excess mortality for each age (a), sex (s) and income (i) group:
  . Total excess mortality is the sum of COVID-19 mortality (
 ) and excess mortality in all J other causes (
 ).
).
This gives the decomposition that we will use throughout the paper (also see figure A1 in online supplemental appendix A):
Supplemental material
 (1)
(1)
Excess mortality in other causes can be either negative or positive. If total non-COVID excess mortality is negative, this suggests that COVID-19 has partly displaced other causes: individuals who died from COVID-19 would otherwise have died from another cause in 2020. However, the pandemic, and the containment policies following it, may also have influenced other cause mortality indirectly through other channels, like delayed non-COVID care in hospitals.14
Measurement of income-related inequality in mortality
To measure the degree of relative inequality15 in mortality by income, we use the concentration index which is based on the association between mortality and income rank.16 This measure is proportional to the relative index of inequality.16 The concentration index is defined as (twice) the area between the concentration curve, which depicts the cumulative distribution of deaths as a function of the cumulative proportion of the population ranked by income, and the line of perfect equality. The concentration index C lies between −1 and 1 and is negative when mortality is more concentrated among the lower income groups and positive in the opposite situation. The concentration indices are computed using the CONINDEX command in STATA.17
To quantify how relative inequality has changed during the first year of the COVID-19 pandemic we compare the concentration index of observed total mortality to that of predicted mortality. We also compare the inequality in predicted mortality to the inequality in COVID-19 mortality to assess whether COVID mortality is more, or less, unequally distributed than total mortality in prepandemic times.
Decomposition of inequality by COD
Using equation 1, we can decompose the concentration index for observed mortality into a weighted sum of its underlying components:
 (2)
(2)
with  and the weights w for each component being the shares of deaths relative to the total number of observed deaths.
The left-hand side term measures the inequality in excess mortality in 2020, or, in other words, how much more unequal mortality has become compared with what was expected based on the trend. The right-hand side shows the contributions to inequality in excess mortality as the weighted sum of inequality in COVID-19 mortality and the inequality contributions of each of the J causes of death. The last term is sum of the ‘inequality contributions’ of each COD. The decomposition allows us to quantify the impact of COVID-19 on the inequality in total mortality and the extent to which other causes have lowered or raised it. The derivation of equation 2 is found in online supplemental appendix A.
Results
Mortality trends
Figure 1 shows the observed total mortality probabilities (per 1000) for 2020 by age group (65–79; 80+) and sex, and compares these to 2020 trend predictions based on observed mortality in 2015–2019. For all groups, observed total mortality in 2020 is above the trend-predicted levels and outside of the 95%confidence interval of the prediction. The absolute difference between observed and predicted mortality—the excess mortality probability—is larger for older age groups.

Mortality trends before and during 2020, women and men. The y-axis represents mortality probabilities in terms of deaths per 1000: the number of individuals who died during the year as a share of the individuals at the start of the year. The x-axis is the years, and the solid line is the estimated trend based on the observed mortality probabilities between 2015 and 2019 (including 95% confidence intervals), the squares are observed total mortality probabilities in 2015–2020, the circle is trend-predicted mortality and the triangle is non-COVID mortality in 2020. If observed total mortality (square) in 2020 exceeds trend-predicted (triangle) mortality, we conclude that there is excess mortality. If at the same time non-COVID mortality (triangle) is lower than trend-predicted (circle) mortality, this signals substitution.
Figure 1 also shows non-COVID-19 mortality in 2020. Mortality from other causes always lies below the predicted mortality probability, especially in the older age group.
Figure B1 in online supplemental appendix B shows the observed, trend-predicted and non-COVID mortality probabilities in 2020 for each age-sex group and income ventile. Tables B1–B4 in online supplemental appendix B report the underlying observed and predicted mortality probabilities. For all groups, the observed mortality exceeds predicted mortality, indicating that all groups suffered from increased mortality due to the pandemic. Moreover, mortality from non-COVID causes generally lies below trend-predicted mortality.
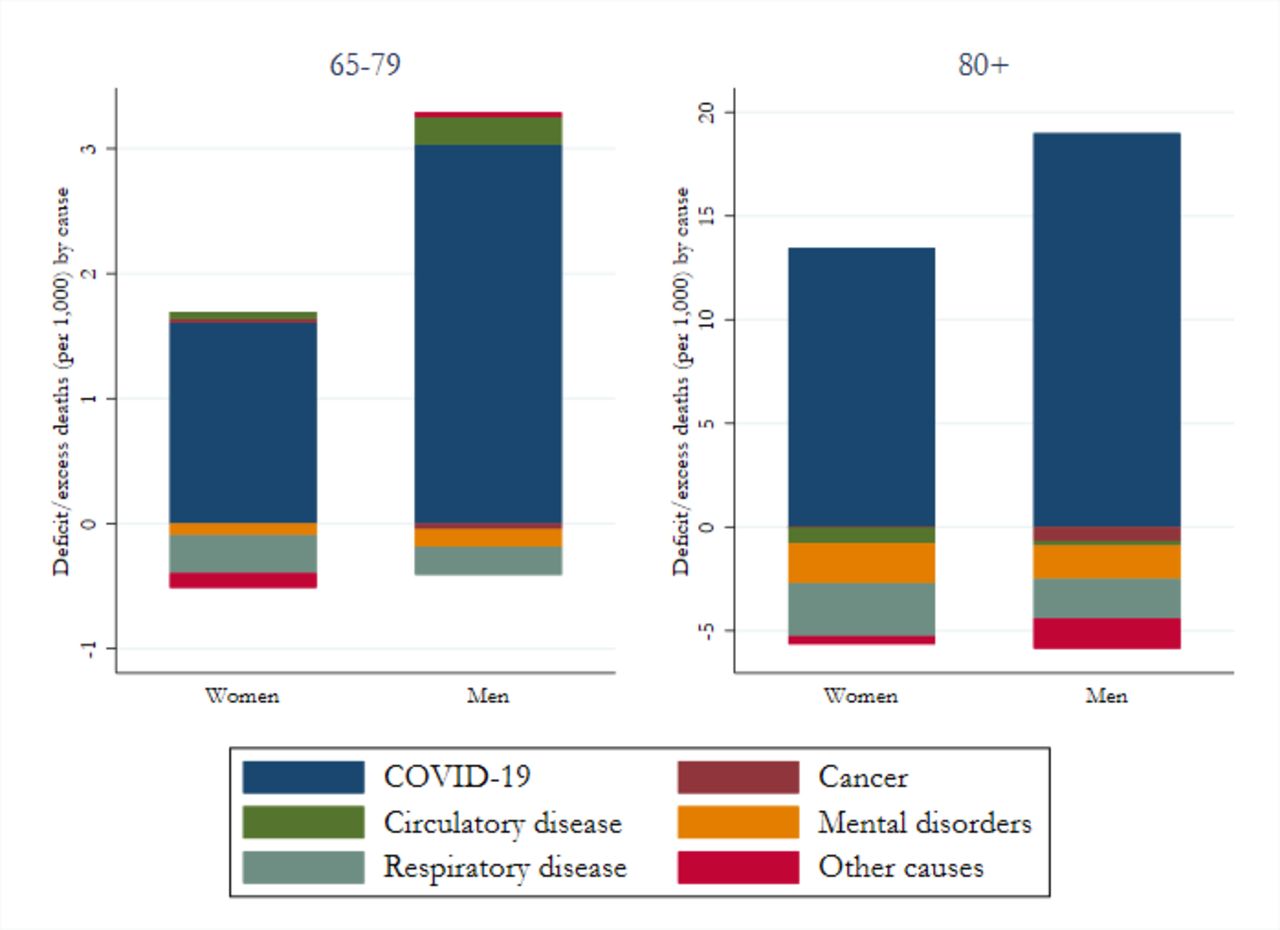
Excess mortality by COD
Figure 2 shows how observed mortality in 2020 for each cause differs from the trend-based prediction, by age group and sex. For men and women aged 65–79, excess deaths consist mostly of COVID-19 deaths and—to a lesser extent—of circulatory disease causes, while we observe negative excess deaths from respiratory and mental causes. For those over 80, observed deaths for all non-COVID-19 causes are below the predicted levels.

Excess mortality decomposition by causes of death, by four age-sex groups. This figure illustrates the deficit/excess in deaths by causes in 2020 in the Netherlands. For circulatory disease, respiratory disease, cancer, mental disorders and remaining causes, the deficit/excess in mortality is calculated as the difference between predicted and observed values. Since predicted mortality for COVID-19 is zero, all COVID-19 deaths are excess.
COVID-19 and income-related inequality in mortality
Figure 3 shows the concentration curves for predicted all-cause mortality and for COVID-19 mortality in 2020, again by age-sex group. All curves lie above the diagonal (ie, mortality is more concentrated among the poor). However, COVID-19 mortality probabilities deviate further from the 45-degree line than predicted mortality probabilities. This indicates that COVID-19-attributed deaths are more concentrated among the lower income groups than predicted all-cause deaths. Second, relative inequality in both predicted and COVID-19 mortality is higher for the younger (under 80) than for the older (over 80) age groups.

Concentration curves of predicted and COVID-19 mortality. The concentration curves underlie the concentration indices (twice the area under the concentration curve), which are used to measure income-related inequalities for each of the age-sex groups. The x-axes represent the cumulative percentage of the population (ranked by income ventile). The y-axis represents the cumulative percentage of either predicted mortality (blue line) or COVID-19 mortality (red line). A concentration curve above the 45-degree line (green)—or line of equality—implies that mortality is more concentrated among the lower income ventiles, and a curve further away from the 45-degree line implies a higher degree of inequality.
Decomposing the inequality consequences of the emergence of COVID-19 mortality
The CIs reported in the top row of table 1 confirm that the pandemic has contributed to an increase in mortality inequality: the observed all-cause mortality is more unequally distributed than the predicted all-cause mortality. This implies that excess mortality in 2020 resulted in a more unequal distribution of deaths than predicted (see the CI of excess mortality in table 1, which is more negative than the CI of predicted all-cause mortality).
Decomposition of excess mortality by cause of death
In table 1, total inequality in excess mortality is decomposed into the inequality contribution of the new cause (COVID-19) and the inequality contribution of excess mortality for non-COVID causes. Online supplemental appendix C provides more detailed results. Four observations can be made. First, in all demographic groups, COVID-19 mortality is more concentrated among lower income groups (concentration indices more negative) than predicted all-cause mortality.
Second, while an important COD for all demographic groups, COVID-19 deaths represent only a minor share of all deaths (between 9.5% and 16%), which implies that the impact of inequality in COVID-19 mortality on inequality in all-cause mortality is limited.
Third, inequality in observed mortality from specific non-COVID causes is often smaller than predicted (the CI is less negative). For the causes for which observed deaths are lower than predicted (eg, respiratory diseases and mental disorders, see figure 2), this implies that the lower income groups experienced a larger reduction in deaths from these causes (compared with predicted) than the higher income groups. For example, the CI for predicted deaths from respiratory diseases for men in the over 80 group is −0.154, while the CI for observed deaths is −0.128 indicating a less unequal distribution stemming from the fact that a relatively large number of deaths from respiratory diseases were displaced among the lower income groups.
Fourth, inequality in total (all-cause) excess mortality is a weighted combination of the inequality in the new cause COVID-19 and the inequality in (negative) excess mortality in non-COVID causes. Figure 4 shows the inequality contribution (CIC) of each cause as a percentage of the inequality in total excess mortality. The contribution of COVID-19 to the CI in excess mortality is generally larger than 100%, indicating a pro-poor distribution of (negative) excess mortality in other causes. Respiratory diseases and mental disorders (and cancer for the under 80 group) have the largest negative weights, indicating that the reductions in the inequality in these causes have the largest moderating impact on the inequality in total excess mortality.

Cause of death contributions to inequality in excess mortality. This figure shows the weighted percentage contributions of six causes of death to the inequality in excess mortality. Inequality is measured using a concentration index of mortality by income and each contribution is the product of the weight (shares) and the concentration for mortality of each cause of death. The percentage is calculated by taking the ratio between the contribution of each cause and excess mortality.
For three of the demographic groups, the results are very similar: all other causes than COVID-19 show a positive inequality contribution to excess mortality, meaning that the inequality in deaths from these causes is lower (ie, a less negative concentration index) than predicted. There are only two instances where other causes have added to the inequality-increasing effect of COVID-19: cancer deaths for men in both age groups and other causes for men aged 65–79. Finally, only for men aged 65–79, the largest inequality-enhancing cause (after COVID-19) is circulatory diseases.
Discussion
In the Netherlands, COVID-19 mortality exceeds excess mortality in 2020 for all sex, age and income groups. Depending on the age group, the number of excess deaths is between 5% and 42% lower than the number of COVID-19 deaths, which implies an equally large decrease in deaths from non-COVID causes such as respiratory diseases and mental disorders. COVID-19 deaths are strongly concentrated among the low-income groups. At the same time, deaths from non-COVID causes are often less unequal than predicted.
The difference between excess and cause-attributed COVID-19 mortality
First, our results suggest that the net effect of the COVID-19 pandemic on mortality was smaller than the number of people registered as dying from COVID-19. This finding is in line with the numbers reported by Statistics Netherlands for the entire population: in 2020, over 20 000 COVID-19 deaths were registered in the death certificates while the number of excess deaths was estimated at 15 000.18
However, findings for other countries concerning the difference between excess mortality and cause-attributed COVID-19 mortality are mixed.19–22 These differences could in part reflect real differences in prior health of the population and in the societal responses to the pandemic. A direct comparison is difficult, however, because of differences in the time periods and the definition of COVID-19 mortality used in these studies.
The pandemic’s impact on mortality inequality
Second, the relative inequality in COVID-19 mortality favouring the rich is considerably larger than inequality in total mortality in non-pandemic years. Bearing in mind the methodological challenges of cross-study comparisons, similar socioeconomic gradients in COVID-19 mortality were reported by some, studying either inequality in COVID-19 deaths or in excess mortality,23–26 although others have found the COVID-19 gradients to be broadly similar to all-cause gradients.27
Using the concentration index enables us to quantify these differences in relative inequality: the negative values of the concentration index for COVID-19 are between 30% and 80% larger (ie, more negative) than those for predicted total mortality.
Third, the inequality in deaths from non-COVID causes is often lower than predicted. The most likely explanation is that displacement of other causes by COVID-19 occurred more often among the lower income groups. However, other (indirect) effects of the pandemic (eg, delayed treatments, lockdowns) might also have had an impact. The reduction in inequality in non-COVID causes varies by sex and age: for all groups, except men between ages 65 and 79, the largest decrease in inequality (in terms of the contribution to inequality in all-cause excess mortality) is for respiratory diseases and mental disorders. For men aged 65–79, the largest decrease in inequality is observed for circulatory diseases. For men in both age groups, an increase in inequality is observed for cancer deaths. The differences in the impact of changes in non-COVID mortality on inequality across demographic groups may arise for several reasons that we cannot explore: differences in underlying conditions, in the ability and efforts to protect oneself from COVID-19 or in the effects of the societal response to the pandemic.
Studies for other countries have found diverging socioeconomic gradients for deaths from non-COVID causes during the pandemic.21 22 24 28 There is limited comparability to these other studies due to the methodological issues in terms of observation period, identification of COVID-19 deaths and differences across countries in the mortality trends prior to 2020. A relatively similar study by Kontopantelis and colleagues1–4 has estimated excess deaths due to COVID-19 and other causes in England and Wales by sex and geographical region during the COVID-19 pandemic in 2020. Like us, they find negative excess deaths in the 65+ age group for other respiratory causes and (for most groups) for cancer. Unlike us, they find positive excess mortality for cardiovascular disease and other causes. They also find, like our results, that more deprived quintiles report higher rates of excess deaths.
Limitations
The distinction between cause-attributed COVID-19 mortality and excess mortality that we use throughout the paper relies on the quality of the COD coding. While there have been serious efforts to internationally harmonise the COD registrations, it is not impossible that in practice some differences across countries remain. We followed the European Centre for Disease Prevention and Control recommendation by including both test-confirmed and suspected cases of COVID-19 in mortality statistics. The registration of COVID-19 deaths throughout the year may have depended on the testing policy: while severe/hospitalised cases and individuals in certain professions were tested from the start of the pandemic, testing only became available for the full population after 1 June.29 30 Similarly, estimates of excess mortality depend crucially on the predictions based on historic trends in deaths. Methodological differences in estimating these trends have been shown to impact the estimates of excess mortality during the COVID-19 pandemic.27 Although our approach could also be applied to other countries, differences in the reporting and coding of causes of deaths will complicate comparisons.
Moreover, we only observe the main COD and not the other contributory causes. In (part of) the cases where COVID-19 resulted in the sequence leading to death, the contributory causes could well be the ones we find to be displaced by COVID-19 in our analysis.
Our analysis is limited to the first year (2020) of the pandemic, as at the time of the research data for 2021 were not yet available. It is quite likely that the effects on inequality may have been different in the second year of the pandemic, when the roll-out and uptake of both tests and vaccines, and the predominance of different variants of COVID-19 may have had a different impact on mortality inequality.
Finally, we have not considered other short-term or long-term effects of a COVID-19 infection on health beyond mortality. More specifically, we have used annual mortality in 2020 as our main outcome, which ignores any long-term effects on mortality. Alternatively, one could estimate the years of life lost due to COVID-19 across income groups taking the prior health status of those who died of COVID-19 into account.
Conclusion
We find that the COVID-19 pandemic was not the ‘Great Unequalizer’,31 but it did further increase the already long-existing inequalities in mortality by income in the Netherlands. To some extent, COVID-19 deaths have displaced deaths from other causes that were expected to be distributed unequally, but the displacement was not enough to leave the total socioeconomic inequality unaltered: total mortality inequality (encompassing all causes including COVID-19) was still larger than expected based on historic trends. This finding highlights the importance of equity concerns for next pandemics. If future pandemic response policies are to avoid such a rise in inequality, greater investments in the pro-poor targeting of testing, vaccination and other interventions may be required.
Data availability statement
Data may be obtained from a third party and are not publicly available. The results presented in this article are based on calculations by the authors using non-public microdata from Statistics Netherlands (CBS). Under certain conditions and a confidentiality agreement, these microdata are accessible for statistical and scientific research. For further information: microdata@cbs.nl.
Ethics statements
Patient consent for publication
Acknowledgments
We thank Tim Doran and three anonymous reviewers for their valuable comments on an earlier draft of this paper.
References
Supplementary materials
Supplementary Data
This web only file has been produced by the BMJ Publishing Group from an electronic file supplied by the author(s) and has not been edited for content.
Footnotes
Contributors JG: data collection, data analysis, data interpretation, visualisation, writing. BW: guarantor, study design, data interpretation, writing, funding acquisition. MB: data collection, data analysis, data interpretation, writing. EvD: study design, data interpretation, writing, supervision.
Funding We are grateful to the Institute for Public Health (RIVM) and the Smarter Choices for Better Health (SCBH) Initiative of Erasmus University Rotterdam (EUR) for financial support.
Disclaimer Both funding sources had no role in the writing of the manuscript or the decision to submit it for publication.
Competing interests None declared.
Provenance and peer review Not commissioned; externally peer reviewed.
Supplemental material This content has been supplied by the author(s). It has not been vetted by BMJ Publishing Group Limited (BMJ) and may not have been peer-reviewed. Any opinions or recommendations discussed are solely those of the author(s) and are not endorsed by BMJ. BMJ disclaims all liability and responsibility arising from any reliance placed on the content. Where the content includes any translated material, BMJ does not warrant the accuracy and reliability of the translations (including but not limited to local regulations, clinical guidelines, terminology, drug names and drug dosages), and is not responsible for any error and/or omissions arising from translation and adaptation or otherwise.