Article Text

Abstract
Background Worrying changes in life expectancy trends have been observed recently in the UK, largely attributed to austerity policies introduced over the last decade. To incorporate changes to quality, rather than just length of, life, our aim was to describe trends in healthy life expectancy (HLE) for the relevant period.
Methods In the absence of available long-term trends, we calculated new estimates of HLE for Scotland for the period 1995–2019, using standard HLE methodologies based on mortality and national survey data, and stratified by sex and socioeconomic deprivation.
Results Overall, male and female HLE increased markedly between 1995 and 2009, but then decreased by approximately 2 years between 2011 and 2019. A decline was observed for the most and least deprived groups, but this was larger for those living in the 20% most deprived areas, where the decrease was 3.5 years.
Conclusions Our findings are further evidence of changing levels of pre-pandemic population health in the UK. An increasing body of UK and international evidence have attributed these changes to UK Government austerity policies. There is an urgent need, therefore, to reverse cuts to social security and protect the income and health of the poorest across all of the UK.
- HEALTH EXPECTANCY
- Health inequalities
- POLICY
- AGING
This is an open access article distributed in accordance with the Creative Commons Attribution Non Commercial (CC BY-NC 4.0) license, which permits others to distribute, remix, adapt, build upon this work non-commercially, and license their derivative works on different terms, provided the original work is properly cited, appropriate credit is given, any changes made indicated, and the use is non-commercial. See: http://creativecommons.org/licenses/by-nc/4.0/.
Statistics from Altmetric.com
WHAT IS ALREADY KNOWN ON THIS TOPIC
Unprecedented changes in life expectancy trends (stalling of improvement overall; and declining levels among more deprived populations) have been observed across the UK since the early 2010s, largely attributed to UK Government ‘austerity’ policies.
Life expectancy measures purely length, rather than quality, of life; healthy life expectancy (HLE) instead captures length of time lived in good health and is arguably a more comprehensive measure of overall population health. However, it is unclear if similar changes to HLE have been observed in recent years .
WHAT THIS STUDY ADDS
We calculate new estimates of HLE for Scotland covering the period 1995–2019, stratified by sex and socioeconomic deprivation.
Overall HLE increased markedly between 1995 and early 2010s, but then declined by approximately 2 years between 2011 and 2019.
A greater decline (of around 3.5 years) was observed among the 20% most deprived population.
Introduction
Concerning changes in mortality and life expectancy trends have been observed across the UK since the early 2010: a ‘stalling’ of previous improvements alongside worsening trends among more deprived populations. Although the causes are still debated in some quarters, a considerable amount of evidence suggests that UK Government ‘austerity’ measures—cuts to public spending, including an unprecedented reduction in social security payments which have had a disproportionate effect on the poorest and most vulnerable—are most likely the key driver.1–7
Although life expectancy is an extremely useful measure of overall population health, it focuses purely on length—rather than quality—of life. It, therefore, fails to capture potentially important changes in morbidity and general health status. Healthy life expectancy (HLE) seeks to address such limitations by combining mortality data with survey-based measures of self-assessed health (SAH). It is of interest, therefore, to know whether similar changes as those seen for life expectancy have also been observed for HLE in the past decade—especially in comparison to trends prior to the implementation of austerity policies in 2010. Unfortunately, however, because of changes to data sets, survey questions and methodologies, recent published estimates for HLE in the UK which are comparable over time are only available back to 2009. However, in Scotland, the focus for this study, the Scottish Health Survey (SHeS)8—a nationally representative survey of the health of the population—has collected information on SAH in a consistent fashion since 1995. The aim of this project, therefore, was to use SHeS data to calculate new, longer (pre-austerity and post-austerity implementation), trends in HLE for Scotland, including stratification by sex and socioeconomic deprivation.
Methods
HLE was calculated using a modified version of the Office for National Statistics (ONS) HLE calculation spreadsheet.9 Calculations were based on the Sullivan method, as outlined by Jagger et al,10 but modified slightly by ONS.11 Mortality and population data by year, age (<1 year, 1–4 years, 5–9 years … 90+ years), sex and Scottish Index of Multiple Deprivation (SIMD) quintile were obtained from the National Records of Scotland (NRS). SAH data from SHeS, stratified by the same variables, were obtained from the UK Data Service.12 Similar data from the 2011 census—used in adjusting SAH survey estimates—were provided by NRS. In both cases (SHeS and Census), SAH was measured using the question: ‘How is your health in general?’, with possible answers being ‘very good’, ‘good’, ‘fair’, ‘bad’ and ‘very bad’. The numbers and proportions in ‘very good’ or ‘good’ health were used in the calculations. Mean total sample size over the period was c.8000, ranging from c.5300 (2017) to c.13 000 (1998): details of all sample sizes are included in online supplemental table 1. Survey design effect weights (to account for changes to survey non-response rates) were obtained from ScotCen Social Research (who administer SHeS on behalf of the Scottish Government).13 Estimates were calculated for each survey year: 1995, 1998, 2003 and 2008–2019, with stratification by deprivation quintile possible for 2003 (using the 2004 SIMD) and 2008–2019 (using the 2009, 2012, 2016 and 2020 SIMDs). SAH estimates were imputed (using ONS methodology) for age groups not sampled in 1995 (<16 years and 65+ years) and 1998 (<2 years and 75+ years). Sensitivity analyses of the effects of imputing age groups with small sample sizes (80–84 years, 85–89 years and 90+ years) were also undertaken (see online supplemental file).
Supplemental material
Results
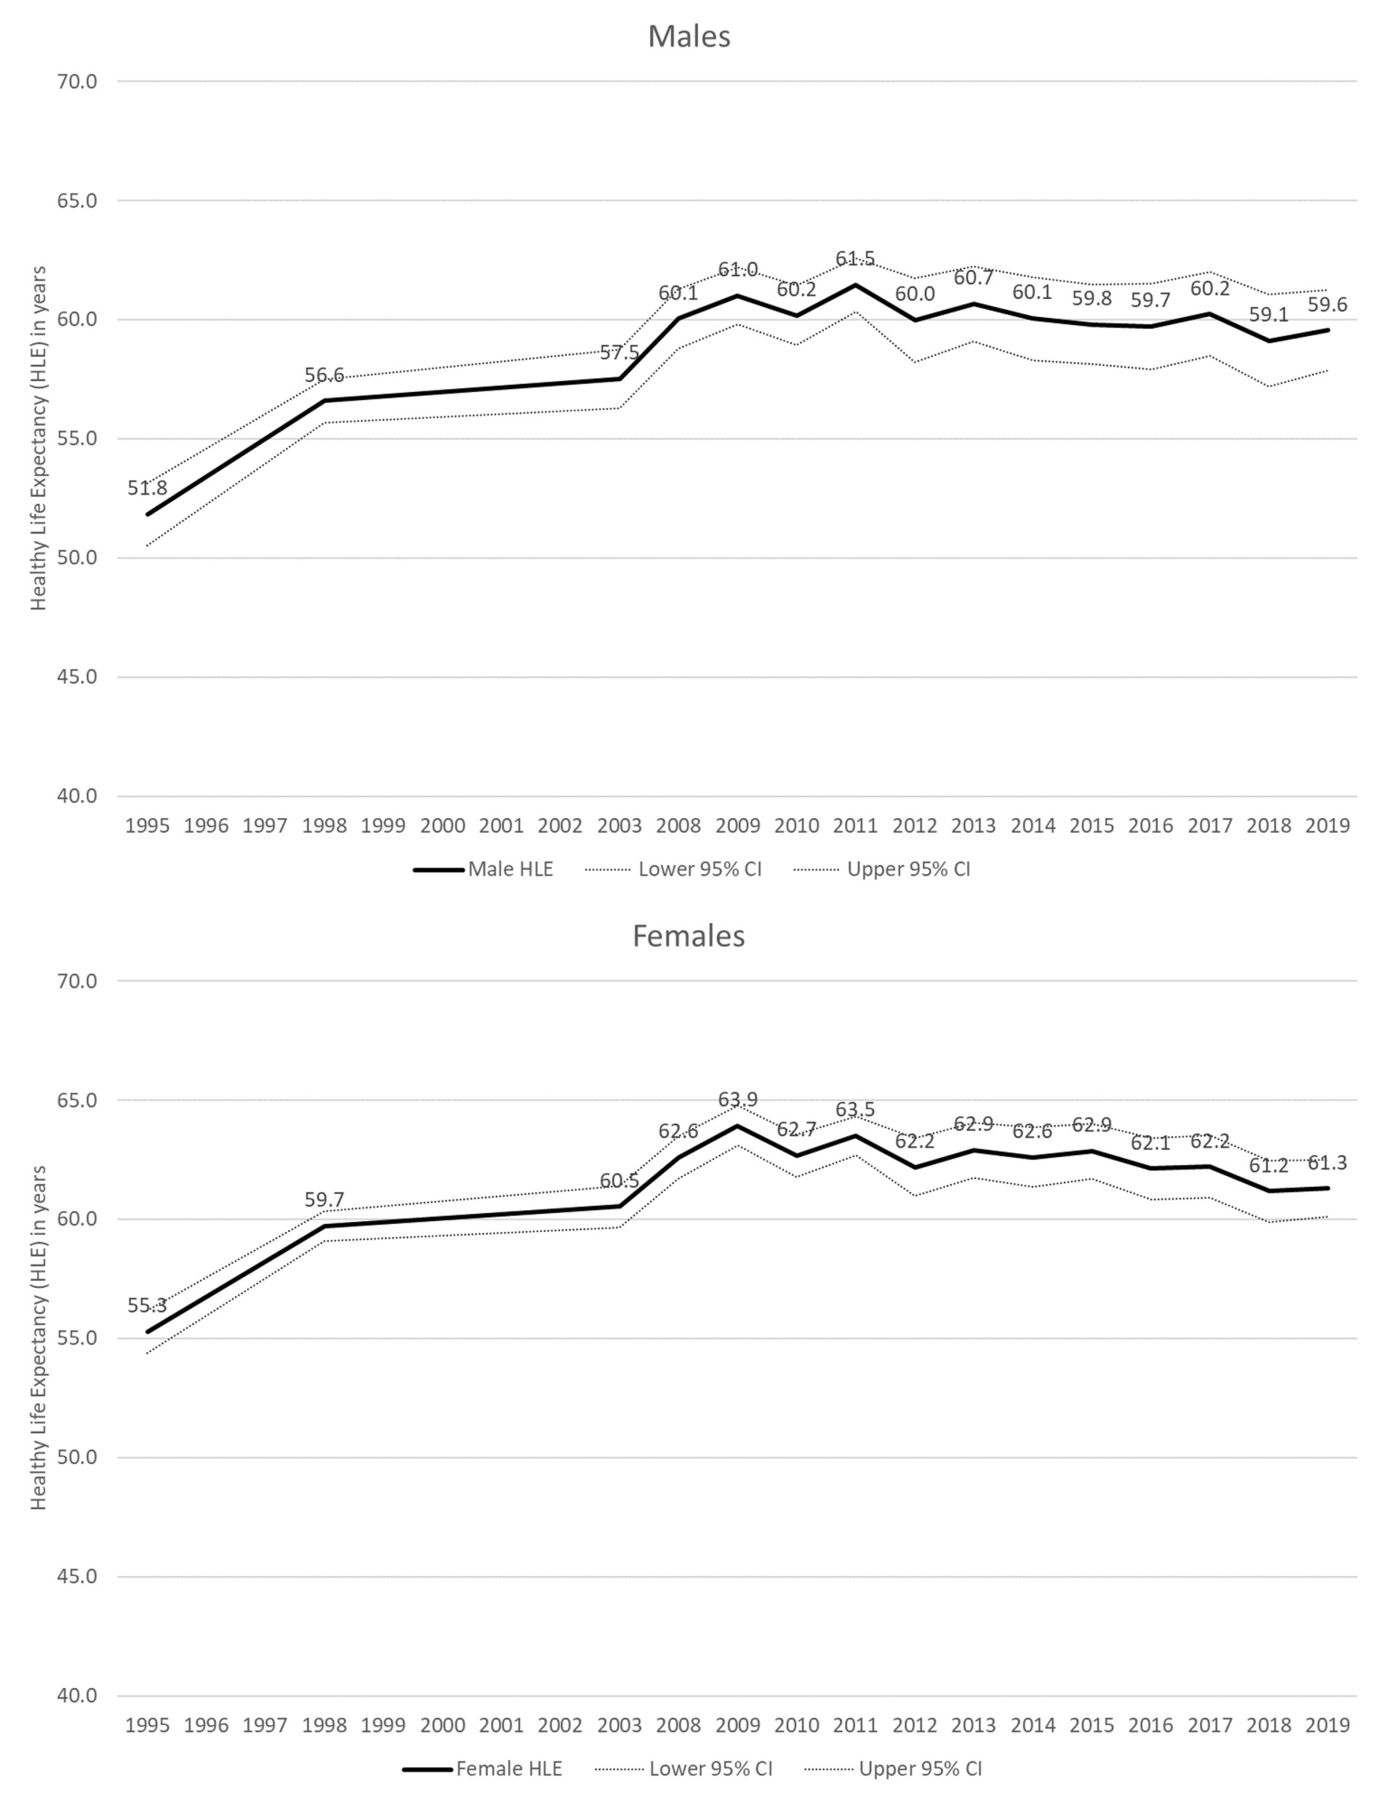
For both males and females, HLE increased markedly, by approximately 9 years, between 1995 and 2009 (figure 1). However, in both cases, HLE decreased by approximately 2 years between 2011 and 2019 (although for males, there is some overlap of 95% CIs).

Healthy life expectancy, Scotland 1995–2019, males (top) and females (bottom).
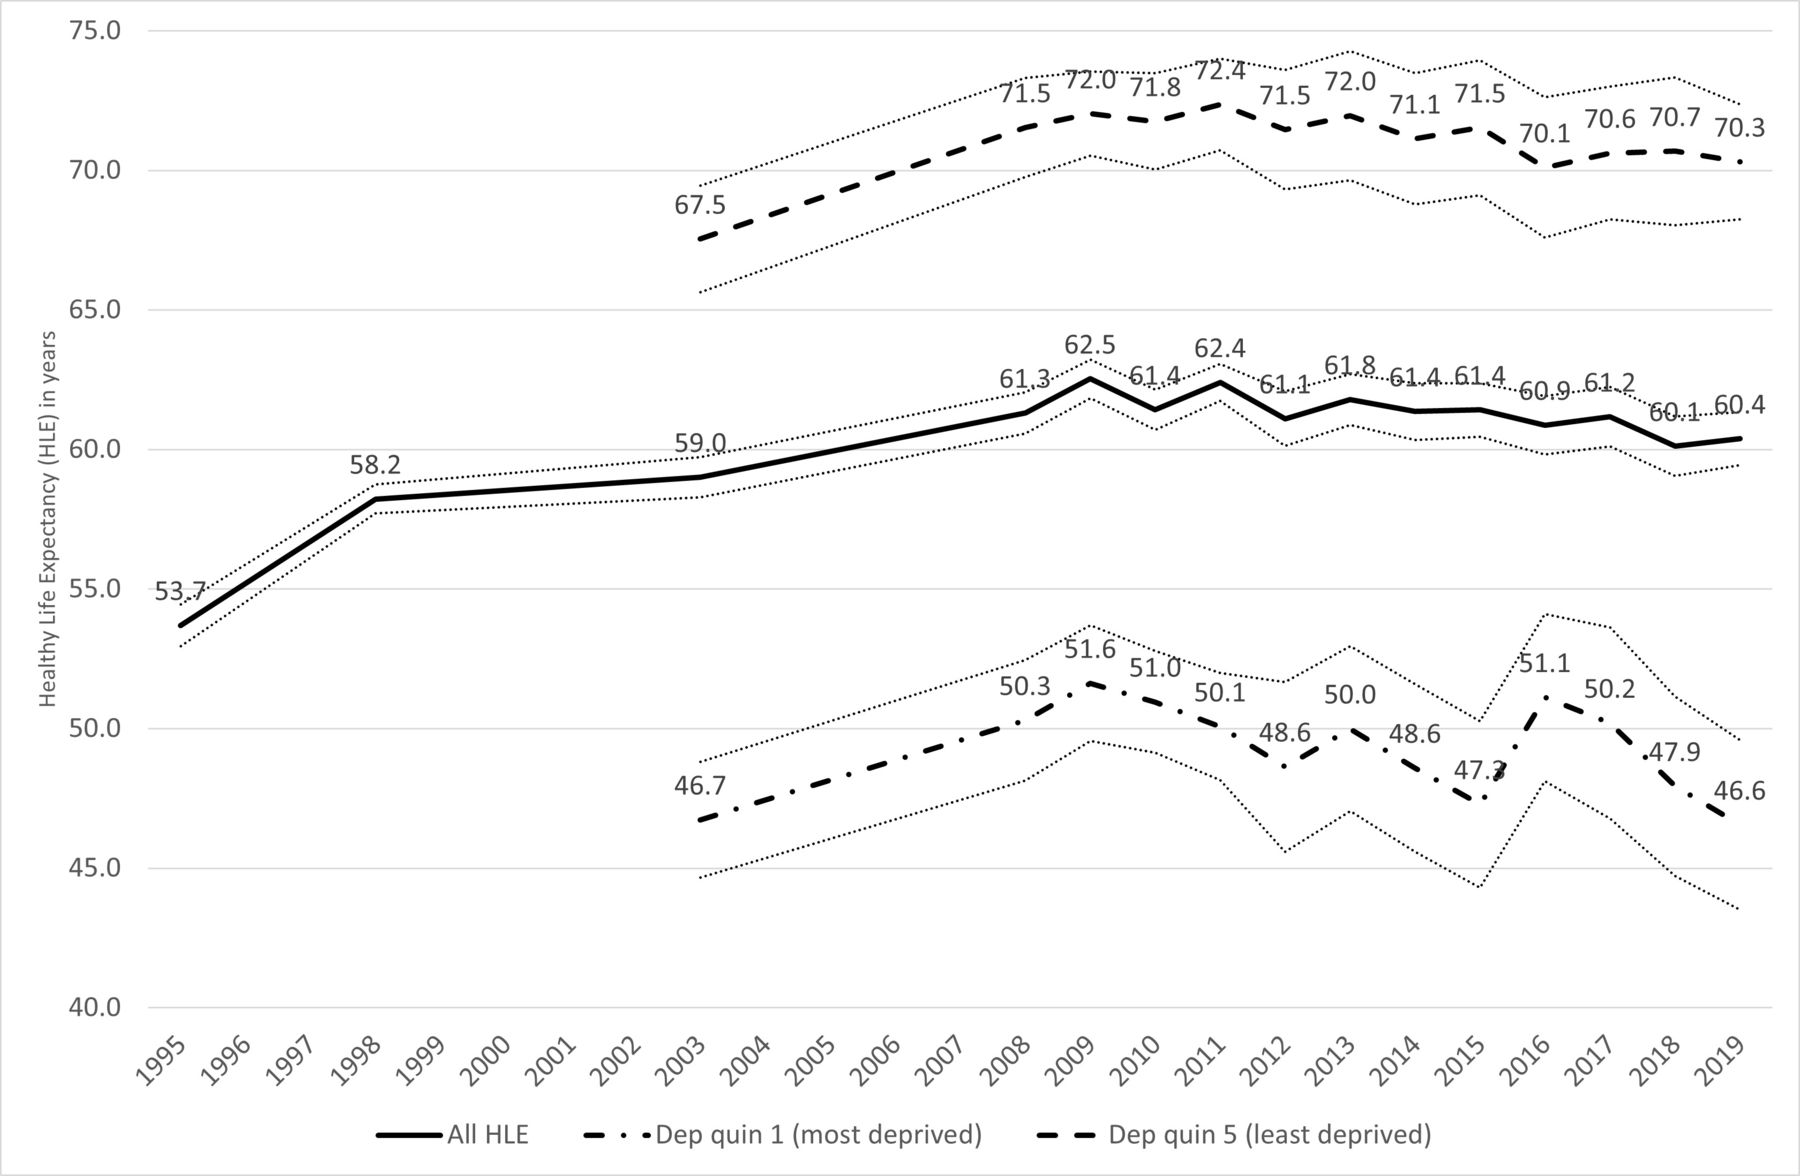
In our restricted time series analyses, a similar (increasing then declining) trend in HLE can be seen for the least deprived 20% of the Scottish population (figure 2). There is notably more fluctuation in the trend for the most deprived quintile; however, the decline between 2011 and 2019 is much greater (3.5 years) than the fall observed for the least deprived population (2.1 years). However, given the smaller sample sizes, there is overlap of 95% CIs over the period; thus, we must be cautious in our interpretation of the trends.

Healthy life expectancy, Scotland, and 20% most and least deprived populations 1995–2019.
The effect of imputing SAH estimates for older age groups with smaller sample sizes was, broadly, to lower the level of HLE in particular years; however, it did not alter the overall trends reported here (online supplemental figures A,B).
Discussion
Given the use of survey data and the associated uncertainty around the exact values of estimates, we must be cautious in our interpretation of the analyses shown here. Nonetheless, these newly calculated estimates for Scotland suggest that levels of HLE fell by approximately 2 years between 2011 and 2019, with a greater decline among the 20% most deprived population. This contrasts markedly with previously increasing trends. Previous research has shown a slowdown in improvement in life expectancy over the same period. These findings emphasise the importance of monitoring HLE, in highlighting that in terms of this marker of population health, the rate of improvement has not only slowed but is actually in decline.
Limitations of this work include the fact that SAH estimates had to be imputed for younger and older age groups in the earliest two survey years (1995 and 1998), and that 2001 census data could not be used to adjust estimates in the earlier time period because a different SAH question was used in that census. Sample sizes in some age groups—especially when stratified by deprivation quintile—were small; however, sensitivity analyses suggest that imputation does not affect the overall trends shown here. National survey response rates (including those of SHeS) have declined in recent years: although additional weighting seeks to account for that, the data are likely to be skewed by a ‘healthy respondent’ bias,14 which would overestimate HLE in the population. This bias would particularly overestimate HLE among those living in the most deprived areas, and in the later time periods, meaning that our interpretation of inequality in HLE trends, and the scale of the decline, are both likely to be understated. Despite these limitations, the study helps to fill a gap in terms of recent trends in HLE in Scotland before and after the implementation of austerity policies, and is based on a robust methodology used in UK national statistical publications.
The trends shown here are similar to those produced by the Scottish Public Health Observatory for males and females for the years 2009–2016, based on different national survey data (Scottish Household Survey).15 The female trends also correspond with trends published by NRS, based on Annual Population Survey data; however, while those NRS figures also show a decline in male HLE from 2015/2017, they also show an increase between 2009/2011 and 2015/2017, which differs from the trend shown here, and requires further investigation.16 However, our results also correspond with analyses undertaken for the whole of the UK by Welsh et al: using different survey data, this showed a decline in HLE of almost 2 years (males) and more than 3 years (females) between 2008 and 2016.17 ONS have also recently highlighted decreases in male and female HLE in recent years (2014/2016 to 2017/2019) across all parts of the UK, with the decreases for females in Scotland and the UK as a whole particularly notable.18 These decreases are in sharp contrast to previously increasing trends in HLE shown by ONS (although using different methodologies and survey data).19 Our analyses, therefore, add to increasing evidence of a marked change to trends in HLE in the UK in recent years, similar to those shown in various analyses of mortality and life expectancy data.1–7
In conclusion, this study provides further evidence of the lack of progress, and potential worsening, in levels of population health in parts of the UK. A wealth of studies, both international and from within the UK, have highlighted the likely role of UK Government austerity policies in these changing trends.1–7 20 This includes evidence of increased levels of stress and poor mental health,21–23 which are likely to also impact on measures of general health used in the calculation of HLE. Given this evidence, there is an urgent need for the UK Government to reverse cuts to social security and instead protect the incomes, and thereby the health, of the poorest in society across all parts of the UK.
Ethics statements
Patient consent for publication
Ethics approval
Not applicable.
Acknowledgments
We are grateful to the National Records of Scotland (NRS) for the provision of mortality, population and census data. Sincere thanks to Daniel Burns and Andrew Guthrie of NRS, and also Merilynn Pratt and, in particular, Chris White at ONS for the provision of helpful data and advice. Grateful thanks are also due to Stephen Hinchcliffe at ScotCen for calculating the survey design weights.
References
Supplementary materials
Supplementary Data
This web only file has been produced by the BMJ Publishing Group from an electronic file supplied by the author(s) and has not been edited for content.
Supplementary Data
This web only file has been produced by the BMJ Publishing Group from an electronic file supplied by the author(s) and has not been edited for content.
Footnotes
Twitter @GMAWyper, @gerrymccartney1
Correction notice This article has been corrected since it first published. Two typographical errors have been corrected in the summary boxes.
Contributors DW originally conceived the study, undertook the analyses and drafted the manuscript. All authors provided substantial critical input to improve the manuscript, approved the final draft and agreed upon the research questions and analysis plan.
Funding The authors have not declared a specific grant for this research from any funding agency in the public, commercial or not-for-profit sectors.
Competing interests None declared.
Provenance and peer review Not commissioned; internally peer reviewed.
Supplemental material This content has been supplied by the author(s). It has not been vetted by BMJ Publishing Group Limited (BMJ) and may not have been peer-reviewed. Any opinions or recommendations discussed are solely those of the author(s) and are not endorsed by BMJ. BMJ disclaims all liability and responsibility arising from any reliance placed on the content. Where the content includes any translated material, BMJ does not warrant the accuracy and reliability of the translations (including but not limited to local regulations, clinical guidelines, terminology, drug names and drug dosages), and is not responsible for any error and/or omissions arising from translation and adaptation or otherwise.