Article Text

Abstract
Background Melbourne, Australia, successfully halted exponential transmission of COVID-19 via two strict lockdowns during 2020. The impact of such restrictions on healthcare-seeking behaviour is not comprehensively understood, but is of global importance. We explore the impact of the COVID-19 pandemic on acute, subacute and emergency department (ED) presentations/admissions within a tertiary, metropolitan health service in Melbourne, Australia, over two waves of community transmission (1 March to 20 September 2020).
Methods We used 4 years of historical data and novel forecasting methods to predict counterfactual hospital activity for 2020, assuming absence of COVID-19. Observed activity was compared with forecasts overall, by age, triage category and for myocardial infarction and stroke. Data were analysed for all patients residing in the health service catchment area presenting between 4 January 2016 and 20 September 2020.
Results ED presentations (n=401 805), acute admissions (n=371 723) and subacute admissions (n=15 676) were analysed. Substantial departures from forecasted presentation levels were observed during both waves in the ED and acute settings, and during the second wave in subacute. Reductions were most marked among those aged >80 and <18 years. Presentations persisted at expected levels for urgent conditions, and ED triage categories 1 and 5, with clear reductions in categories 2–4.
Conclusions Our analyses suggest citizens were willing and able to present with life-threatening conditions during Melbourne’s lockdowns, and that switching to telemedicine did not cause widespread spill-over from primary care into ED. During a pandemic, lockdowns may not inhibit appropriate hospital attendance where rates of infectious disease are low.
- COVID-19
- public health
- time-series
- healthcare disparities
Data availability statement
Data are available upon reasonable request. Time series data are available upon reasonable request.
This article is made freely available for personal use in accordance with BMJ’s website terms and conditions for the duration of the covid-19 pandemic or until otherwise determined by BMJ. You may use, download and print the article for any lawful, non-commercial purpose (including text and data mining) provided that all copyright notices and trade marks are retained.
https://bmj.com/coronavirus/usageStatistics from Altmetric.com
Introduction
Disentangling the direct and indirect impacts of the COVID-19 pandemic on population health and healthcare delivery is an important epidemiological challenge. Compared with other nations, COVID-19 outbreaks in Melbourne, Australia, have been mild, reaching a peak of 725 daily cases and 6768 active cases (among a population of ~5 million) in June 2020.1
Restrictions to movement, commerce and non-urgent healthcare, plus controls such as curfew and mandatory mask wearing were intermittently imposed and relaxed in Melbourne throughout 2020, providing an opportunity to study the impact of strict and prolonged lockdowns in the context of relatively low disease burden.
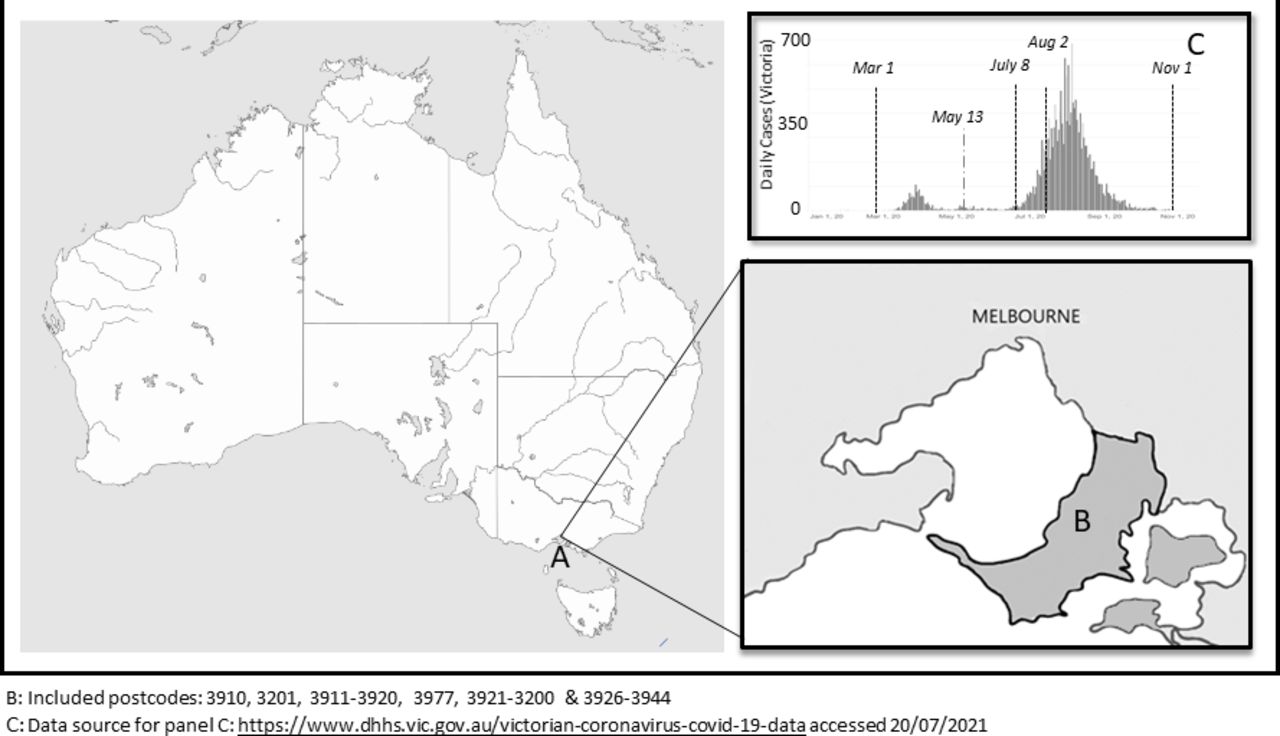
The first death from COVID-19 in Australia was reported on 1 March 2020. By 30 March, schools were closed in most states (including Victoria), non-urgent surgeries were delayed to reserve hospital capacity and substantial restrictions to movement and gathering imposed nationwide.2 In Melbourne, restrictions to surgery, school and movement began to ease on 13 May 2020, signalling the end of the ‘first wave’. Melbourne’s 7-day average COVID-19 case rate dropped below 5 in the first week of June (see figure 1C); however, this reprieve was short lived, a ‘second wave’ began in early July and lasted until November 2020. Climbing case numbers precipitated the introduction of ‘stage three’ restrictions in Melbourne from 8 July, which included stay-at-home orders and surgery cancellations. This was followed by stronger ‘stage 4’ restrictions beginning on 2 August, which included a night-time curfew and prevented Melburnians from leaving their homes except for essential purposes.

Location of Melbourne, Australia (A); Peninsula Health catchment area (B) and daily COVID-19 case counts for Victoria, January to September 2020 (C).
Internationally, studies of COVID-19 impact have focused on direct impacts within elements of hospital systems (eg, intensive care3 4 and emergency department (ED)5 6) or indirect impact on specific diseases, notably mental health7–9 and cancer mortality.10 Data from the USA and UK demonstrated significant reduction in hospitalisation for life-threatening conditions during 2020,11 12 suggesting individuals may have avoided treatment. However, these studies coincided with high rates of COVID-19, and so findings may not generalise to settings with smaller outbreaks. The specific ways in which lockdowns impact presentation to hospital in the context of low disease burden remain unclear. The direction of change cannot be assumed, as primary care delivery in Australia pivoted toward video and telephone consults (including e-prescription) throughout 2020, with potential ‘spillover’ into EDs. The impact of this system-wide switch to telehealth on hospital presentation has not yet been systematically investigated.
The detection of change in healthcare-seeking activity is complicated by strong seasonal variation and long-term increasing trends in hospital presentation.13 14 Simple comparison of activity levels at different time points (eg, March 2020 with March 2019) without accounting for seasonality and trend may yield misleading estimates. We use data from a well-defined geographic region of Melbourne to explore how presentation to hospital in 2020 diverged from activity predicted on the basis of historical patterns and trends. We aimed to compare activity in three sectors (ED, acute, subacute) to detailed forecasts for 2020, to estimate the impact of the pandemic from March to September overall, by age, triage category and for two acute time-critical medical conditions: myocardial infarction (MI) and stroke.
Methods
Setting
The Frankston and Mornington Peninsula region of Melbourne (population ~280 000,15 see figure 1B) provides an ideal environment for population-level analysis. Residents from diverse age groups, socioeconomic backgrounds and both metropolitan and regional areas15 access the majority of their hospital-based healthcare through a single service, Peninsula Health. Peninsula Health is the sole public hospital service in this water-bounded region, with >900 beds across two EDs, two acute care hospitals, two subacute hospitals and numerous community health services. We extracted data from the National Centre for Healthy Ageing research data platform, derived from Peninsula Health’s data warehouse.
Data source and preprocessing
The COVID-19 period was defined as commencing on the date of the first reported Australian death (1 March 2020) to most recent available data (20 September 2020). Data for all inpatient admission episodes (acute and subacute) and ED presentations to Peninsula Health from 4 January 2016 to 20 September 2020 were extracted and cleaned. As data are presented at episode level, individuals admitted to hospital via ED are present in both data sets, and individuals may appear multiple times within the series. To avoid spurious signals due to the absence of holiday makers, only episodes belonging to those with a residential address in the service area (figure 1B) were included. To prevent overestimation of activity due to multiple admissions or presentations recorded for a single episode (transfers within/between facilities/wards), episodes involving an admission on the same day as discharge were consolidated, and statistical admissions (episode-type changes) excluded. Sleep laboratory admissions and COVID-19 screening clinic activity were also excluded. Data cleaning is summarised in figure 2.
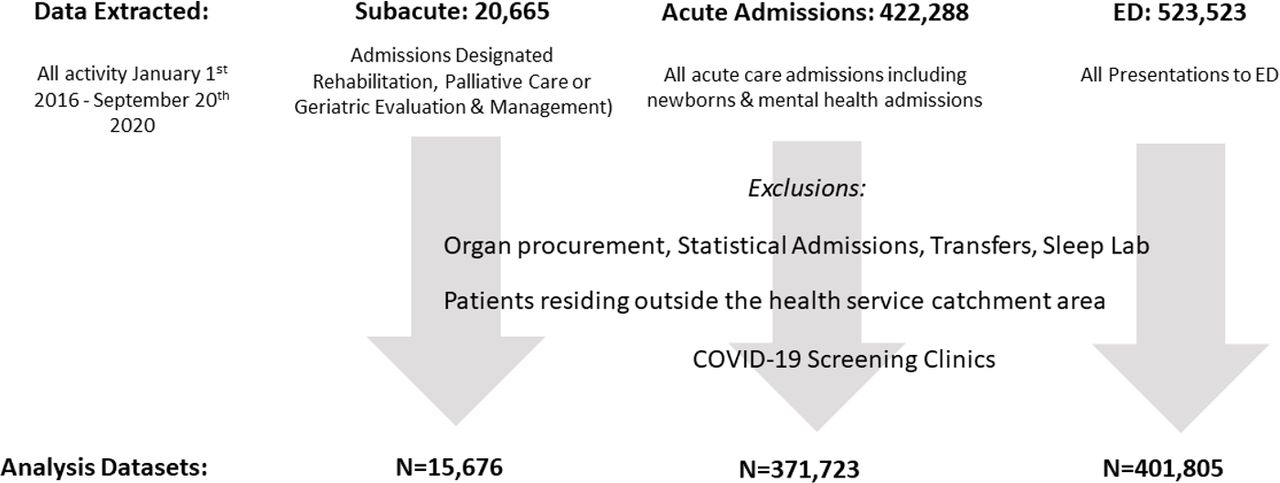
Data included for analysis, January 2016 to September 2020. ED, emergency department.
Clinical groupings were defined via diagnosis code sets using the International Classification of Diseases, 10th Revision, Australian Modification (ICD-10-AM) codes. Data were cleaned in Stata V.16 (StataCorp), and analysed in R (V.4.0.3) via fable16 and fabletools.17
Forecasting expected activity
We forecasted a counterfactual 2020 (ie, predicted activity for March to September, without COVID-19) using the Seasonal and Trend decomposition using Loess (STL) function method. Despite outperforming the widely used autoregressive integrated moving average (ARIMA) and exponential smoothing methods in forecasting hospital activity,18 STL has not yet been widely applied in healthcare research.
Weekly counts from January 2016 to February 2020 were used as training data, and STL was implemented to capture and extract the seasonal component of these time series. A non-seasonal Error-Trend-Seasonal exponential smoothing model was then selected by minimising the Akaike information criterion when fitted to deseasonalised data. Underlying trend was projected forward in time, and combined with the seasonal component using the naïve approach. See Hyndman and Athanasopoulos19 for further description of the methodology. Results were further validated against 2 years of patient lists supplied by clinicians in the cardiac and stroke units by inspecting event counts.
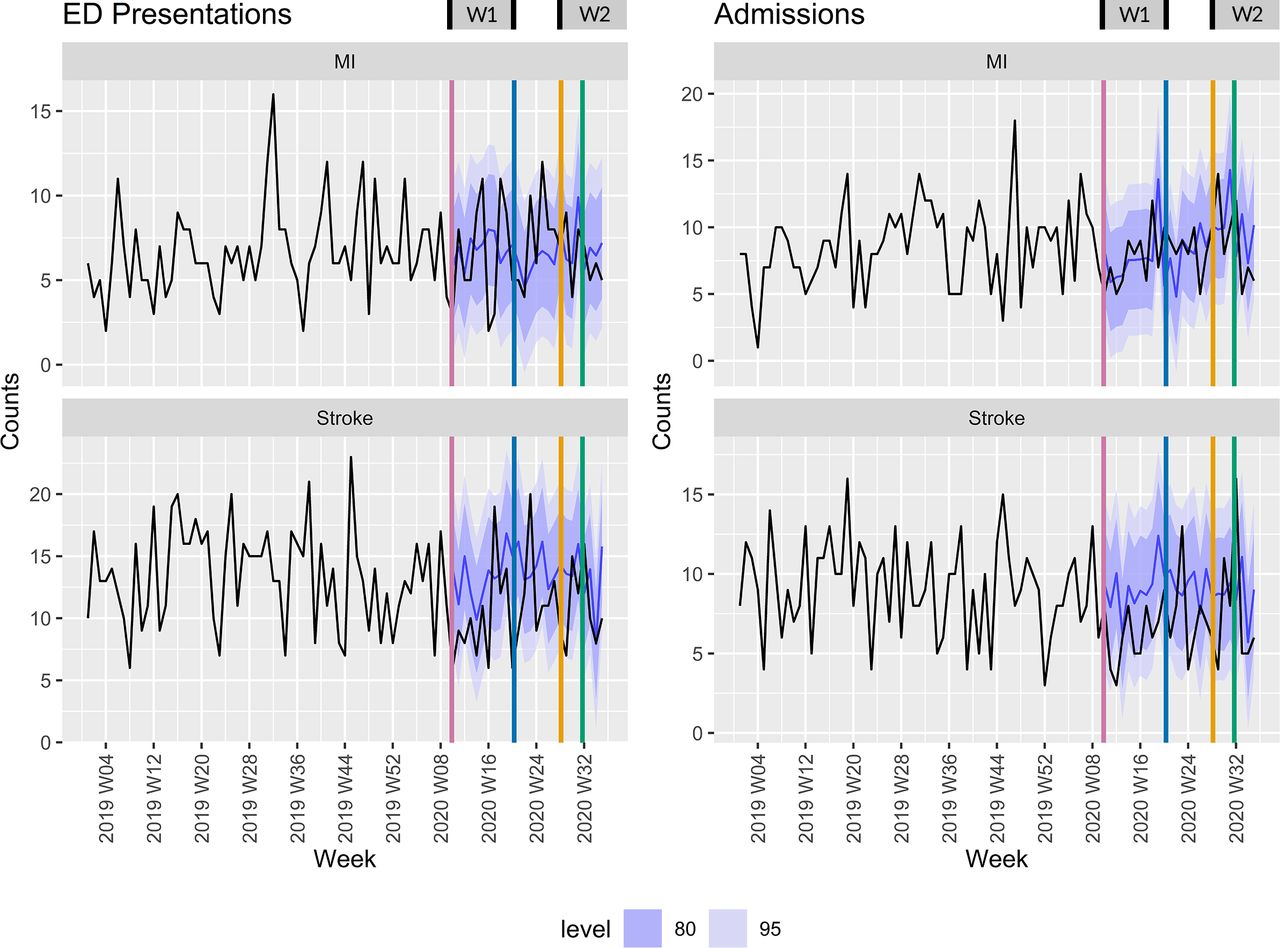
Figures include vertical lines highlighting the beginning and easing of lockdown conditions; from left to right, red designates 1 March 2020 (first death from COVID-19 in Australia), blue is 13 May 2020 (initial easing of restrictions), yellow is 7 July (imposition of stage 3 restrictions) and green is 1 August (imposition of stage 4 restrictions). Shaded areas represent 80% and 95% prediction intervals. Hence, 80% and 95% of observations are expected to lie within these intervals. Consistently observing values outside these bounds indicates statistically significant deviation from forecasted activity.
Person-level analyses
To explore the changes in who was presenting (rather than changes in episode counts), routinely collected patient characteristics were examined for two patient groups: those presenting in March to September 2020 and those presenting during the same period in 2019 (comparison period). Where a patient had multiple presentations/admissions in either period, the first was defined as the index event. To reflect complexity and comorbidity, Charlson Comorbidity Index20 and Hospital Frailty Risk Score21 were ascertained from primary and secondary ICD-10-AM codes from the preceding 5 years. Hospital admission and ED presentation history was calculated for the year prior to each period, excluding chemotherapy, radiotherapy and renal dialysis. Postcode-based Index of Relative Socioeconomic Advantage and Disadvantage was used as a measure of social disadvantage. As this analysis is exploratory, we refer to observed proportions and used χ2 tests to investigate whether the distribution of these patient features is independent of time period.
Results
In total, 401 805 ED presentations, 371 723 acute admissions and 15 676 subacute admissions were included for analysis (see figure 2). Of these, 363 131 ED presentations, 320 171 acute admissions and 13 862 subacute admissions (January 2016 to February 2020) were used to train forecasting models, comprising 216 weeks of training data. Online supplemental figure 1 includes the entire time series from January 2016 to September 2020, and presents model performance for four 26-week periods pre-COVID. Very rarely are actual observations outside prediction intervals, indicating good model performance. Figures 3–6 display variations in observed activity compared with forecasts, summarised numerically in table 1.
Supplemental material

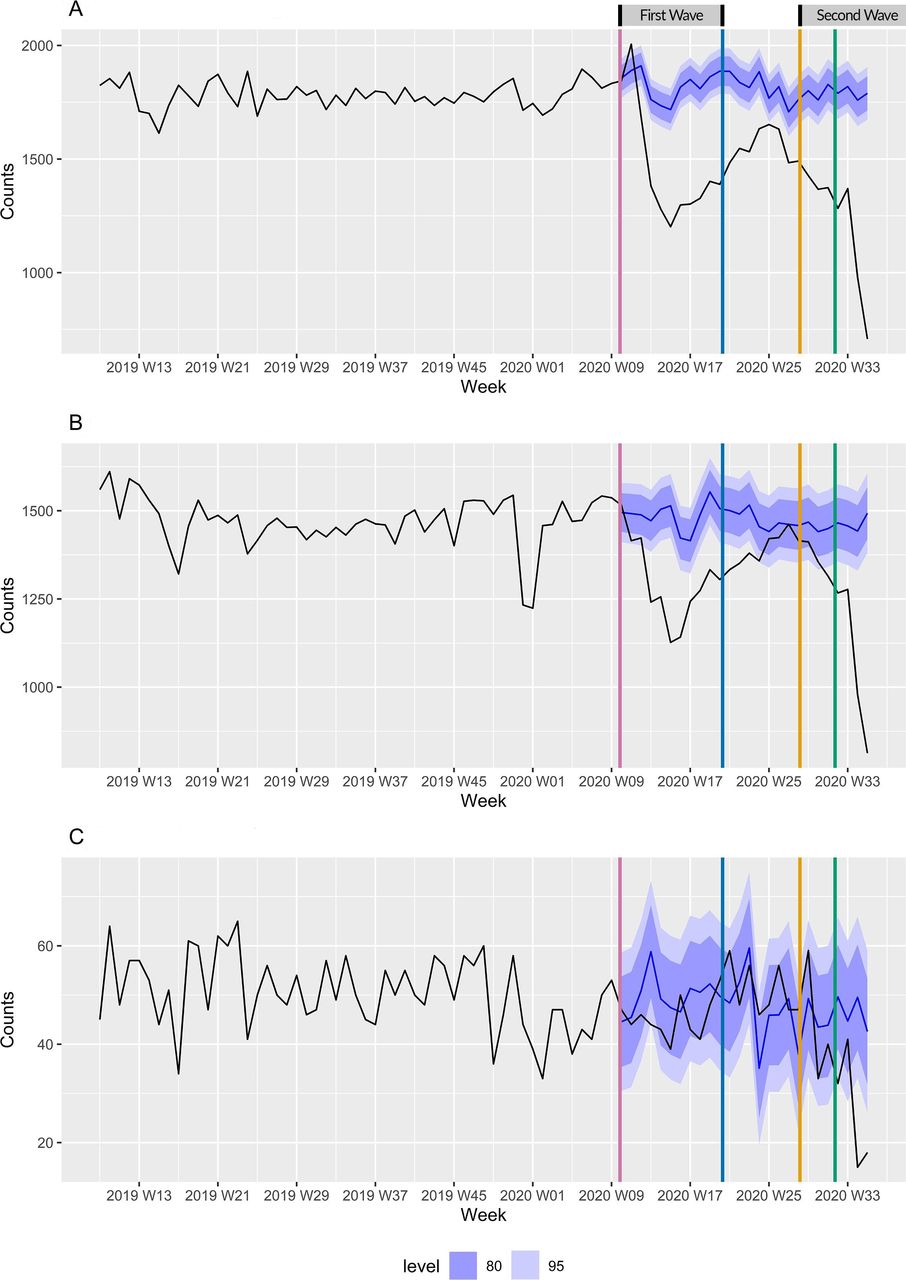
Change in (A) emergency department (ED) presentations, (B) acute admissions and (C) subacute admissions. Red line is 1 March 2020 (first reported death from COVID-19), blue line is 13 May 2020 (initial easing of restrictions), yellow line is 7 July (imposition of stage 3 restrictions), green line is 1 August (imposition of stage 4 restrictions).

Emergency department (ED) presentations and admissions (acute and subacute) by age.
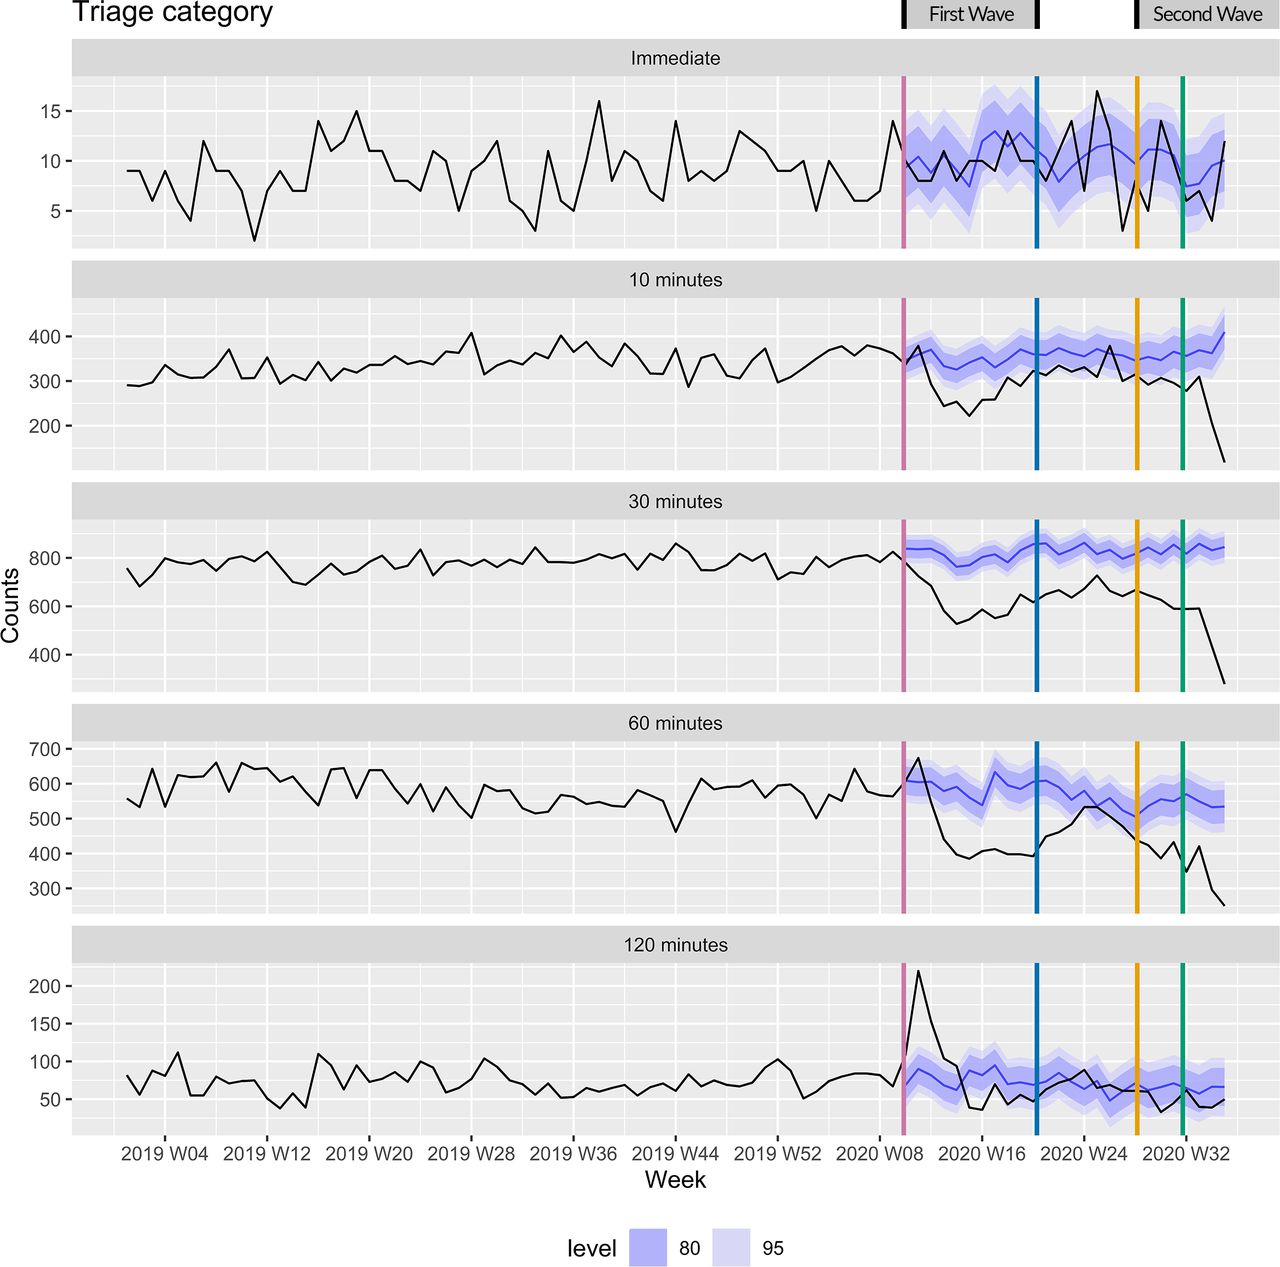
Emergency department (ED) presentations by triage category.

Myocardial infarction (MI) and stroke in emergency department (ED) and acute admissions.
Total observed activity versus forecasted activity (1 March to 20 September)
In figure 3, observed ED presentations (A), acute admissions (B) and subacute admissions (C) for 26 weeks relative to forecast following 1 March 2020 are presented. V-shaped deviations from forecasted activity levels were observed in the ED and acute settings during wave 1, with activity increasing after restrictions relaxed in May. Only during the most restrictive lockdown was a drop observed in the subacute setting. In ED, 26/26 weeks studied fell outside the 95% prediction interval (with 1/26 weeks above the interval and 25/26 below). For acute admissions, this was 22/26 weeks (see table 1).
Figure 4 presents the activity in each sector by age. Reductions in presentation to ED and acute admissions were most marked among those aged >80 and <18 years. For these age groups, almost all weeks following 1 March lie below the 95% prediction interval, in contrast to other groups for which the series returned to the forecast interval between waves. For all groupings, activity drops associated with wave 2 (the more restrictive lockdown) were larger than for wave 1.
Figure 5 depicts ED presentations by triage category. Category 1 (immediate, life-threatening) presentations remained largely inside the forecast interval throughout both waves (1/26 weeks above and 3/26 below the prediction interval). Triage category 2 (requiring treatment within 10 min) declined in the first wave, but recovered to the lower region of the prediction as restrictions eased, and during stage 3 restrictions. Triage categories 3 and 4 were completely outside the interval in both waves. Triage category 5 (non-urgent conditions) persisted at expected levels, following some volatility in March and April.
Figure 6 presents ED presentation and acute admissions for stroke and MI, showing little change relative to forecast intervals. This general stability was confirmed in the associated unit-level lists.
Person-level analyses (table 2) suggest some differences in characteristics of people arriving at hospital during the COVID-19 period, compared with March to September 2019. Some changes (eg, age groupings) are small in magnitude relative to the baseline proportion, and statistical significance is likely a consequence of our large sample. There was, however, a notably lower proportion of ‘frequent presenters’ (those with three or more ED presentations or hospital admissions in the previous 12 months) attending during the COVID-19 period, and a reduced proportion of patients with greater frailty and with greater comorbidity load. Online supplemental table 1 presents a breakdown of the demographic characteristics of the ‘frequent presenter’ group, further highlighting reductions in the proportion of people with greater comorbidity and frailty risk scores presenting to hospital during COVID-19 lockdowns.
Person-level analysis
Discussion
We employed novel forecasting techniques to provide a detailed picture of the COVID-19 pandemic’s indirect impact on presentation to a metropolitan health service serving a defined geographic region of Melbourne, Australia, over two waves of community transmission. This comprehensive study of healthcare-seeking behaviour in the context of (relatively) low disease burden is also the first study to present a holistic picture of hospital activity during multiple discrete outbreaks.
The COVID-19 pandemic caused a significant change to usual activity within the health service. Substantial departures from forecasted presentations were observed during both waves in ED and acute settings, and during the second wave in the subacute setting. In all analyses, decline in hospital presentation/admission was greatest in the second wave, mirroring the relative severity of Melbourne’s second outbreak (depicted in figure 1C), and the severity of restrictions imposed. Elective surgeries were restricted between July and October, and observational medicine capacity in ED reduced by 37% during the second wave, potentially accounting for some observed decline. In the subacute setting, activity declined significantly in the second wave only, corresponding with a substantial increase in direct COVID-19-related activity at Peninsula Health in late July and August 2020, resulting in some subacute bed closures.
Age groupings
Patients aged <18 presented at rates dramatically below historically informed projections in both waves. This finding aligns with specific study of paediatric ED utilisation in Melbourne during the first wave.6 Adolescents aged 14–18 most commonly present to ED due to injuries,22 and online supplemental figure 2 depicts a substantial reduction in injury presentation for those aged <18, and 18–40, during both waves. Observed reductions among young adults may reflect fewer road accidents and/or alcohol-related injuries (including violence and falls).23 Cheek et al6 reported an increase in neonatal ED presentations during March to April 2020 only. Specific analyses are needed to more clearly understand the impact of lockdowns on children and young people, who, in absolute terms, typically account for the highest number of ED presentations compared with other age groups.14
Victorians aged over 80 typically present to ED at rates higher than other age groups,13 but presentations and admissions among those aged 80+ declined substantially in the first wave, and did not recover to forecast levels as restrictions relaxed. We also record a substantial reduction among those with increased frailty and multiple comorbidities.
Social isolation among elderly people due to COVID-19 restrictions has been raised as a serious public health risk,24 and loss of supportive contact may in turn lead to increased hospitalisation among the elderly. However, our data suggest this did not occur. Older peoples’ threshold for presenting to hospital may have been elevated for fear of contracting COVID-19. General Practitioner (GP) consultations among those aged 80+ also declined between March and September 2020,2 though in proportion with other age groups. Reductions in presentation to hospital may represent widespread delay in treatment seeking among the elderly. It would be of interest to prospectively examine hospitalisation rates during 2021, to evaluate whether a spike in hospitalisation occurs once the threat of community transmission is past.
Triage categories
The stability of triage category 1 presentation in our data is encouraging, and cuts against US and UK data suggesting patients requiring immediate care may not have attended hospital during 2020.11 12
Presenting complaints of chest pain, transient neurological symptoms, abdominal pain and shortness of breath typically dominate category 2, and the reductions we report in this category are concerning, as these conditions require emergency medical care. The imposition of stage 4 restrictions corresponded with a large decline in category 2 ED presentations; however, our study cannot assist in determining whether observed decreases in category 2 reflect reduced event rates or delay in treatment seeking. Analysis of case volumes at a cardiac catheterisation laboratory in Melbourne (March to April 2020) detected no difference in activity levels but a fourfold increase in symptom-to-door time,25 suggesting delayed presentation for cardiac disease during wave 1. Any delay in presentation for precursors to potentially fatal events (eg, chest pain, transient ischaemic attack) reduces opportunity for secondary prevention of subsequent (often more severe) events. For this reason, there may be an expectation of increased numbers presenting late in the time series, with worse disease severity. However, our data suggest that presentation with MI and stroke during both waves was consistent with patterns from previous years, even during a brief ambulance bypass period in August due to a heightened number of COVID-19 cases at Frankston Hospital.
Detailed analysis of presenting complaints will be an important extension of this study; however, careful epidemiological surveillance of cardiac, cerebrovascular and other serious conditions during and after lockdowns appears warranted.
Triage categories 3 and 4 are ‘urgent’ and ‘semi-urgent’, respectively. Declines in these categories may reflect changes in event rates for injury and fracture,26 a change in ED referral patterns from primary care or a general reluctance to attend ED during an outbreak of infectious disease.
A large spike in triage category 5 presentations in the early weeks of the first wave appears to reflect a very large number of individuals entering the ED seeking COVID-related advice and testing. After a dedicated COVID-19 testing centre was established on-site, triage category 5 presentations declined throughout the first wave (relative to forecast), but were within the forecast interval during the second wave. Triage category 5 is not an emergency category; however, the presenting complaints of these patients are not necessarily appropriate for treatment in GP clinics. Chronic disease management activity declined in primary care during Melbourne’s first wave, and Victorian GP services operated primarily via telephone and telehealth during the second wave.2 This may have resulted in a surge of non-emergency presentations to ED; however, our data suggest this did not occur, supporting the ‘fear of hospitalisation’ hypothesis.
Healthcare-seeking behaviour
There was a marked reduction in the proportion of patients who (previously) required frequent hospitalisation, and similar reductions were observed in primary care presentations during wave 1.2 These individuals have higher frailty and comorbidity scores than those who had accessed care less regularly (see online supplemental table 1), and typically suffer from multiple, chronic health conditions such as chronic respiratory disease and congestive heart failure; high risk for COVID-19-related complications. These individuals may have attempted to self-manage during the pandemic for fear of contracting COVID-19. A higher proportion of frequent presenters admitted to the health service after 1 March 2020 were from high socioeconomic disadvantage postcodes (36% compared with 22% in 2019, χ2 9.86, p=0.002), suggesting that perhaps frequent presenters from wealthier areas were better able to self-manage. This may have reduced some unwarranted presentations; however, the long-term health impacts are yet to be observed. As this group are challenging to characterise using episode-level data, it will be important to specifically study how frequent presenters cope without hospital care during lockdowns.
Limitations
We report activity for a single health service only; however, our analysis provides an important snapshot of the way COVID-19 indirectly impacts healthcare during a prolonged lockdown but in the absence of high disease burden. As our results reflect population-level trends, the experiences and behaviour of specific subgroups may have varied from what we report.
Conclusion
Our analysis presents a comprehensive picture of changes in presentation to a single, integrated health service serving a geographically defined population during two waves of the COVID-19 pandemic. Encouragingly, the absence of a spike in category 5 ED presentations implies the absence of ‘spill-over’ from primary care associated with a population-wide shift to telehealth. Apparent stability in presentation for MI and stroke, coupled with stable category 1 presentations in ED, suggests a population willing and able to present to hospital when necessary. This finding diverges from studies in locations with higher rates of COVID-19, highlighting ways in which the direct and indirect impacts of pandemics are interconnected, and the ways policy impact can vary across contexts. Lockdowns may not inhibit appropriate hospital attendance where rates of infectious disease are low; however, the public health impact of observed reductions in triage categories 2–4, and presentations among children, young people, patients with complex comorbidity and the elderly in Melbourne are yet to be realised. The importance of timely medical care for urgent conditions might be more actively reinforced or emphasised via public health messaging in future crises, especially as outbreaks grow and restrictions escalate.
What is already known on this subject
The COVID-19 pandemic has caused major disruption to healthcare delivery worldwide; however, disentangling the direct and indirect impacts of the pandemic is an epidemiological challenge.
What this study adds
Melbourne’s extended lockdown during 2020 appears not to have resulted in population-level reductions in care-seeking for urgent medical conditions, including myocardial infarction and stroke. Data also suggest no ‘spill-over’ into emergency departments following the population-wide switch to telehealth for primary care.
Reductions in presentation volume were observed among children, young people and the elderly.
The 2020 patient mix included markedly fewer individuals who frequently present to hospital, and fewer patients with complex comorbidity.
During a pandemic, lockdowns may not inhibit appropriate hospital attendance where rates of infectious disease are low.
Data availability statement
Data are available upon reasonable request. Time series data are available upon reasonable request.
Ethics statements
Patient consent for publication
Ethics approval
Ethical approval was obtained from Peninsula Health Human Research Ethics Committee Executive Sponsor (project 64964).
References
Supplementary materials
Supplementary Data
This web only file has been produced by the BMJ Publishing Group from an electronic file supplied by the author(s) and has not been edited for content.
Footnotes
Twitter @TayaCollyer, @AndrewNadine
Contributors All authors contributed to the manuscript. TAC conceived the study, generated time series data sets, produced the initial draft and is responsible for the overall content as the guarantor. GA implemented the forecasting models. NEA conducted data cleaning and person-level analysis. CM performed data extractions and initial cleaning. RT, NM, SM, GB, JD, TAK, VKS and HC provided clinical and operational context for methods and results.
Funding The authors have not declared a specific grant for this research from any funding agency in the public, commercial or not-for-profit sectors.
Map disclaimer The depiction of boundaries on this map does not imply the expression of any opinion whatsoever on the part of BMJ (or any member of its group) concerning the legal status of any country, territory, jurisdiction or area or of its authorities. This map is provided without any warranty of any kind, either express or implied.
Competing interests None declared.
Provenance and peer review Not commissioned; externally peer reviewed.
Supplemental material This content has been supplied by the author(s). It has not been vetted by BMJ Publishing Group Limited (BMJ) and may not have been peer-reviewed. Any opinions or recommendations discussed are solely those of the author(s) and are not endorsed by BMJ. BMJ disclaims all liability and responsibility arising from any reliance placed on the content. Where the content includes any translated material, BMJ does not warrant the accuracy and reliability of the translations (including but not limited to local regulations, clinical guidelines, terminology, drug names and drug dosages), and is not responsible for any error and/or omissions arising from translation and adaptation or otherwise.