Article Text

Abstract
Background Childhood obesity is a major public health concern. This study evaluated the independent and joint associations of family-level income, neighbourhood-level income and neighbourhood deprivation, in relation to child obesity.
Methods A cross-sectional study was conducted in children ≤12 years of age from TARGet Kids! primary care network (Greater Toronto Area, 2013–2019). Parent-reported family income was compared with median neighbourhood income and neighbourhood deprivation measured using the Ontario Marginalization Index. Children’s height and weight were measured and body mass index (BMI) z-scores (zBMI) were calculated. ORs and 95% CIs were estimated for the three exposure variables separately using multilevel multinomial logistic regression models with zBMI categories as the outcome, adjusting in model 1 for age, sex, ethnicity and number of family members and in model 2 adding family income. A joint measure was derived combining income and deprivation measures.
Results A total of 5962 children were included. Low family income (Q1 vs Q5: OR=4.69, 95% CI 2.65 to 8.29), low neighbourhood income (Q1 vs Q5: OR=2.18, 95% CI 1.33 to 3.58) and high neighbourhood deprivation (Q1 vs Q5: OR=2.45, 95% CI 1.52 to 3.95) were each associated with increased OR of child obesity. However, after adjustment for family income, the association for both neighbourhood income (OR=1.39, 95% CI 0.82 to 2.34) and deprivation (OR=1.56, 95% CI 0.94 to 2.58) and obesity was attenuated. Children from low-income families living in low-income or high deprivation neighbourhoods had higher OR of obesity.
Conclusion Child obesity was independently associated with low family-level income and a joint measure suggests that neighbourhood also matters. Socioeconomic inequalities at both individual and neighbourhood levels should be addressed in childhood obesity interventions.
- obesity
- child health
- epidemiology
- poverty
- social epidemiology
Data availability statement
Data are available upon reasonable request. Data are available upon request by contacting www.targetkids.ca/contact-us/ . The full data are not freely available to respect the confidentiality of our participants, ensure data integrity, and avoid scientific overlap between projects. Once initial contact has been made, we request a short research proposal which will be subject to review by the TARGet Kids! Scientific Committee and approval by institutional research ethics boards.
This is an open access article distributed in accordance with the Creative Commons Attribution Non Commercial (CC BY-NC 4.0) license, which permits others to distribute, remix, adapt, build upon this work non-commercially, and license their derivative works on different terms, provided the original work is properly cited, appropriate credit is given, any changes made indicated, and the use is non-commercial. See: http://creativecommons.org/licenses/by-nc/4.0/.
Statistics from Altmetric.com
Background
Childhood obesity is a major public health concern and recent estimates from Canada and the USA suggest that 13% and 18.5% of children, respectively, have obesity.1 2 Obesity in childhood is a risk factor for obesity and other chronic diseases across the life course. Treatment of child obesity is challenging3 and a broad approach to understanding the wide range of socioecological risk factors is important to inform population health interventions and prevention.4 Lower socioeconomic position, broadly defined as low family income, parental education, occupation or living space, was associated with a significant increased OR of both overweight (OR=1.10, 95% CI 1.03 to 1.17) and obesity (OR=1.41, 95% CI 1.29 to 1.55) in a meta-analysis of 63 studies in children aged 0–15 years.5
Income is one of the many social determinants of health that strongly influences health and health-related behaviours across the life trajectory. Income can be measured at the family level (or individual level) and area level with each representing a distinct construct.6 7 For example, family-level income measures family finances, whereas area-level income represents neighbourhood resources and opportunities.8 Area-level measures of income, such as median neighbourhood income, are commonly used as a proxy when family-level income data are not available, such as when using administrative data.9 However, in North America, the agreement between family-level and area-income measures is generally poor with weighted kappa values between 0.11 and 0.22 and misclassification ranging from 20% to 80%.6 7 10 11 Neighbourhood income can also be an indicator of other neighbourhood characteristics that may affect child health, including neighbourhood social and physical infrastructure.12 13 To better understand these factors, more comprehensive measures of area-level material deprivation can also be used.14 Material deprivation is a score that uses neighborhood-level data and takes into consideration additional neighbourhood characteristics beyond income, such as area-level measures of housing, education and family structure.14
Previous US studies have found low agreement between individual-level and neighbourhood-level income measures, but both high individual and high neighbourhood income were associated with reduced OR of child overweight when evaluated separately.10 11 However, elsewhere a significant interaction between family-level and neighbourhood-level income has suggested that children with higher early childhood family income were at low risk of obesity in low deprivation but not high deprivation neighbourhoods.15 The independent and discordant associations between family-level income and neighborhood-level income and deprivation with child obesity among young children in Canada are unknown.
The primary objective of this study was to evaluate the independent and combined associations of family-level income, neighbourhood-level income and neighbourhood deprivation, with child obesity among children ≤12 years of age recruited from primary care practices in the Greater Toronto Area, Canada. A secondary objective was to report the agreement between family-level income, neighbourhood-level income and neighbourhood deprivation in our study population.
Methods
Study design and sample population
A cross-sectional study was conducted in children 0–≤12 years of age participating in The Applied Research Group for Kids (TARGet Kids!). TARGet Kids! is a community-based, primary care research network. Since 2008, children <6 years of age at time of enrolment were recruited by trained research assistants embedded in primary care paediatric and family medicine clinics and followed annually. The study protocol and population characteristics have been described previously.16 TARGet Kids! exclusion criteria at enrolment are: <32 weeks gestational age; diagnosed with conditions affecting growth; chronic conditions (except for asthma); severe developmental delay and parents not able to complete English questionnaires. Children >12 years of age were excluded since there were relatively few in our study population and adolescents may differ from children. For this study, children were included if they had a study visit between September 2013 and March 2019 with complete data on the exposure (family and neighbourhood income) and outcome variables (obesity) and if they were recruited from 1 of the 10 sites in the Greater Toronto Area, Canada.
Measures
Family income
Family-level income was self-reported by parents using a standardised questionnaire that asked, ‘What was your family income before taxes last year?’ (response options: 13 binned categories, ranging from ‘less than $10 000’ to ‘greater than $500 000’). For the purpose of this analysis, self-reported family-level income was transformed from a categorical variable into a continuous measure by running a ‘binsmooth’ procedure17 in R to estimate a cumulative distribution function that allows for the random imputation of continuous measures for a variable that is originally contained in binned categories.18
Neighbourhood income
Neighbourhood income was measured using the median before-tax family-level income that was collected by Statistics Canada for the 2016 Canadian Census. Median neighbourhood income was defined as the median income of the dissemination areas where the participant lived; dissemination areas are geographic areas with an average population of 400–700 people. The 2016 Canadian Census data were linked to TARGet Kids! data using the postal code conversion file and used to identify the median income of the neighbourhoods. The postal code conversion file provides correspondence between 6-digit postal codes and standard geographic areas for which census data are reported.19 Both family-level and neighbourhood-level incomes were categorised into quintiles defined within our study population with the lowest quintile being the lowest income category and the highest quintile as the highest income category.
Material deprivation
Material deprivation was measured using the Ontario Marginalization Index (ON-Marg), an area-based index that was developed to measure inequalities.20 Material deprivation, which is one of the four components of the validated ON-Marg Index, was included in this study as it is closely related to poverty and measures risk factors for inability to access and attain material needs. The material deprivation measure includes the following variables measures at the dissemination area from the 2016 Canadian census: high school graduation, lone parent families, government transfer payments, unemployment, low income and dwellings in need of major repairs.20 Material deprivation is reported in externally derived quintiles for Ontario; for the purpose of this analysis and for consistency with our income measures, the first quintile was coded as being the most deprived (ie, the lowest socioeconomic status (SES) category) and the fifth quintile as the least deprived. ON-Marg data were linked to TARGet Kids! data using the postal code conversion file which linked 6-digit postal codes from TARGet Kids! to dissemination areas.
Measurement of child body mass index (BMI)
Children’s height (or length for children less than 2 years of age) and weight were measured at each study visit by trained research staff using standardised procedures. BMI z-scores (zBMI) were calculated and defined using the WHO recommendations.21 The WHO SD score definitions for children >5 years were used to categorise weight status as follows: underweight: <−2; normal: −2–≤1; overweight >1–≤2 and obesity: >2. Children from age 0 to ≤12 years of age were included in our study and we applied the WHO z-score definitions for children >5 years of age to all children regardless of their age for consistency and zBMI were used for all ages.22 23
Potential confounders
All confounders were selected a priori based on previous literature. Selected confounders included child age, child sex, maternal ethnicity and number of family members. Maternal ethnicity was collected using 20 category response options and was collapsed into three for the purpose of the analysis (European, East/South/Southeast Asian and other), due to small cell sizes for many response options. Number of family members was defined as the total number of adults and children supported by the family income.
Statistical analysis
Descriptive statistics for exposure, outcome, confounding and other variables were calculated using mean and SD for continuous variables and frequency distributions for categorical variables. For the primary analysis, a multilevel multinomial logistic regression model was constructed using the generalised linear mixed models (GLIMMIX) procedure in SAS to evaluate the independent association of each of the three exposure variables (family-level income, neighbourhood-level income and neighbourhood deprivation) with the four zBMI categories, adjusting for the nested nature of self-reported family-level and neighbourhood-level income data. First, separate models were calculated for each of the three exposures adjusted only for child age, child sex, maternal ethnicity and number of family members and clustering by neighbourhood (model 1). Subsequently, models were calculated for each of the three exposures adjusted for the same variables as in model 1 plus the additional adjustment for both income variables (model 2). To evaluate the joint associations, two new variables were created using the following discordant and concordant combinations of low (Q1) and higher (Q2–Q5) categories: (1) family income and neighbourhood income with response options: low/low, low/higher, higher/low and higher/higher and (2) family income and neighbourhood deprivation with response options: low/low, low/higher, higher/low and higher/higher. We conducted sensitivity analysis evaluating alternate definitions of lower and higher categories, such as Q1 and Q2 versus Q3–Q5. The corresponding ORs and 95% CIs were estimated using multilevel multinomial logistic regression models adjusted for child age, child sex, maternal ethnicity and number of family members and clustering by neighbourhood (model 1). Because of known differences in child obesity by sex,24 all analyses conducted were also stratified by sex. Interactions with age and sex were considered for each exposure measure. For the secondary objective, the agreement between each measure of income and deprivation was evaluated using weighted kappa statistics. All analyses were conducted using SAS V.9.4 statistical software (SAS Institute).25
Quantitative bias analysis was conducted to evaluate the potential impact of selection bias on the observed associations. Quantitative bias analysis was conducted only for selection bias as it was thought to be the major source of bias in this study. It was hypothesised that families with low versus high income may differentially choose to participate based on whether their child had obesity and previous TARGet Kids! studies have shown that the mean income among study participants was relatively high compared with the city of Toronto. Simple bias analysis was conducted26 and parameters for the bias analysis were estimated using national data on older children from the Canadian Community Health Study. Lastly, the potential for unmeasured or uncontrolled confounding was evaluated using the E-value formula  .27
.27
Results
A total of 5962 children enrolled in the TARGet Kids! cohort were included. The mean age of children in this study was 41.4 months (approximately 3.5 years), 48% were female and 52% were male and 62% reported maternal ethnicity as European (table 1). Family and neighbourhood income quintiles and the corresponding cut-points are described in table 1. The spread between highest and lowest quintile was much greater for family income (>$221 438 vs <$70 244) compared with neighbourhood income (>$116 607 vs <$62 336). Using the ON-Marg defined quintiles for material deprivation, 14% of children were in the highest deprivation quintile, while 29% were in the lowest deprivation quintile. Approximately 4% of children were underweight, 12% were overweight and 4% had obesity. Overweight and obesity were slightly higher in boys compared with girls (12% vs 11%, and 4% vs 3%, respectively).
Baseline sociodemographic characteristics of TARGet Kids! Study participants for total study sample and by sex
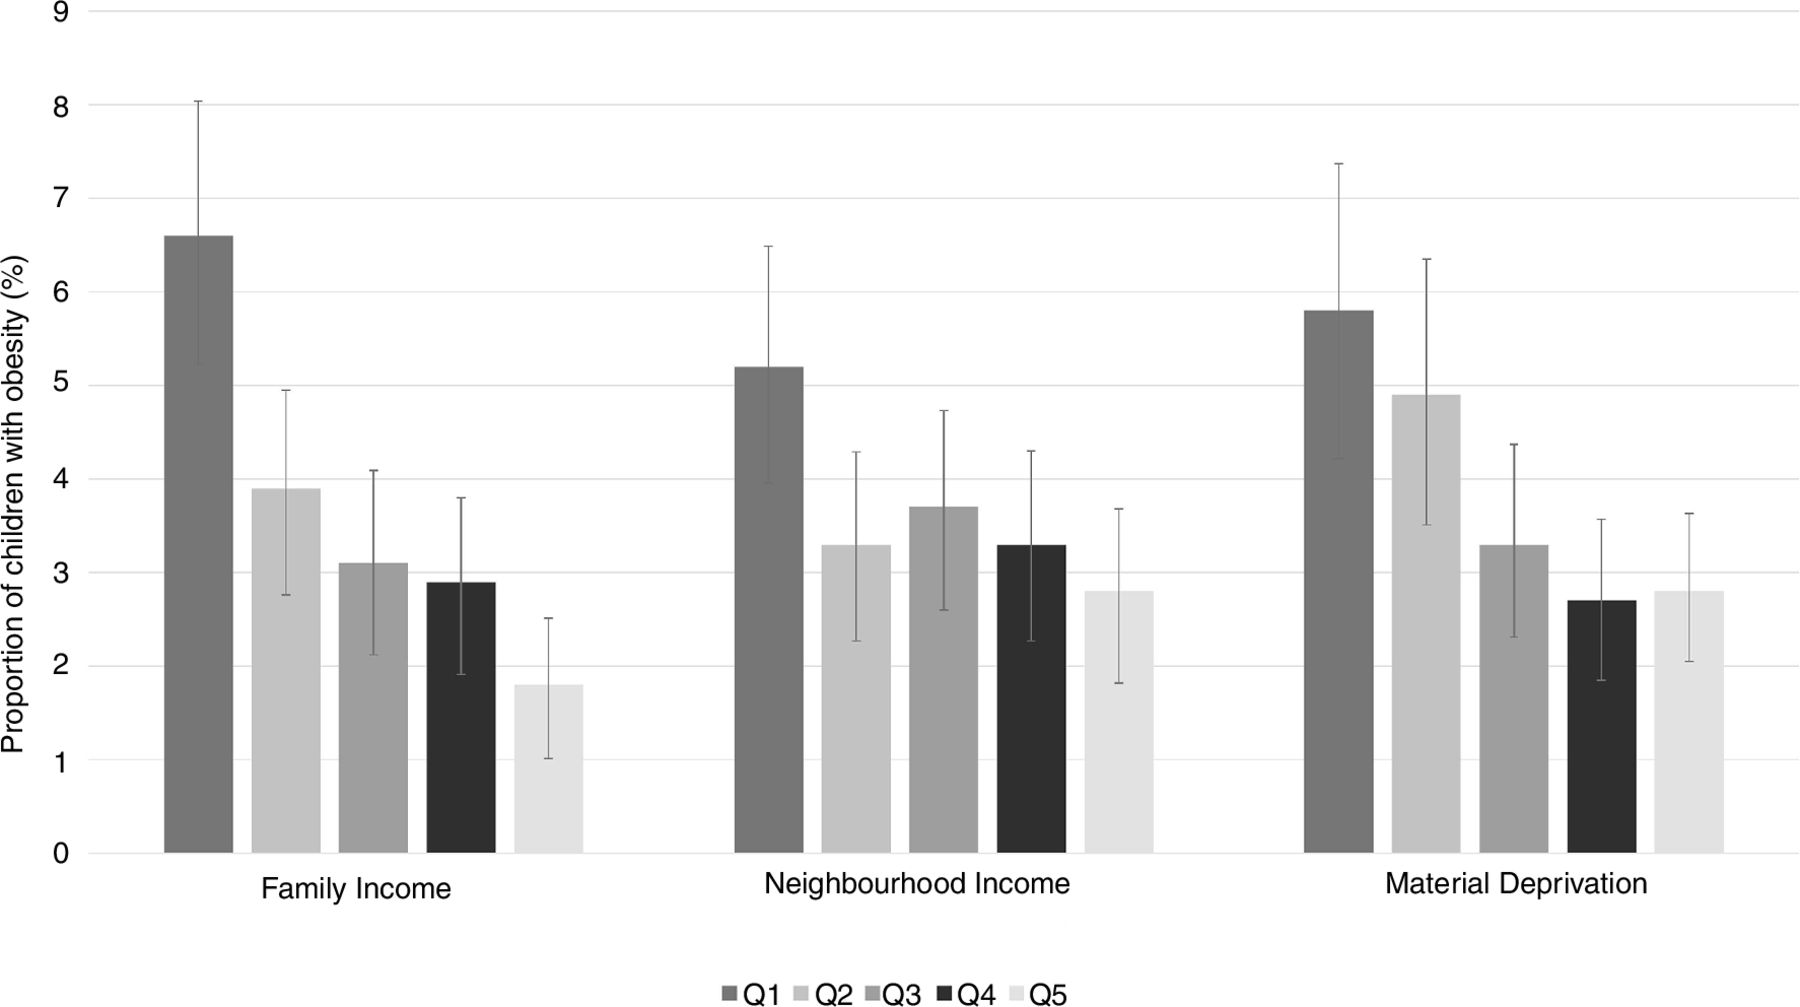
Figure 1 describes the proportion of children with obesity by family income, neighbourhood income and deprivation quintile and shows that the lowest quintile across all three exposure variables has the highest proportion of children with obesity. Table 2 summarises results from the multilevel multinomial logistic regression model separately for the associations between family income, neighbourhood income and neighbourhood deprivation (model 1) and for models adjusted for both family and neighbourhood measures (model 2). Family income (model 1: Q1 vs Q5, OR=4.69, 95% CI 2.65 to 8.29), neighbourhood income (model 1: Q1 vs Q5, OR=2.18, 95% CI 1.33 to 3.58) and neighbourhood deprivation (model 1: Q1 vs Q5, OR=2.45, 95% CI 1.52 to 3.95) were each strongly associated with child obesity compared with normal weight. The ORs showed a relatively consistent dose-response association across SES quintiles. After adjusting for neighbourhood income (table 3), the association between family income and obesity was attenuated but remained strong (model 2: Q1 vs Q5, OR=3.97, 95% CI 2.18 to 7.22). In comparison, after adjusting for family income, the OR for the association between neighbourhood income and obesity was attenuated and the 95% CI overlapped with 1.0 (model 2: Q1 vs Q5, OR=1.39, 95% CI 0.83 to 2.34). The association between material deprivation and child obesity was attenuated after adjustment for family income (model 2: Q1 vs Q5, OR=1.56, 95% CI 0.94 to 2.58). Online supplemental table 1 shows results from the model between deprivation and zBMI stratified by sex. Interactions with sex were not statistically significant at a 5% level of significance; the conclusions were similar in both boys and girls with the exception that low family income was significantly associated reduced risk of underweight among boys but not girls. Similarly, interactions between child age and family income (p=0.21), neighbourhood income (p=0.44) and neighbourhood deprivation (p=0.61) were also not statistically significant.
Supplemental material

The proportion of children with obesity and 95% CI by family income, neighbourhood income and neighbourhood deprivation quintile.
Multilevel multinomial logistic regression model for the association between family income, neighbourhood income and underweight, overweight and obesity categories compared with normal weight in children aged 0–12 years
Multilevel multinomial logistic regression model for the discordant and concordant categories of family income, neighbourhood income and deprivation in relation to underweight, overweight and obesity categories compared with normal weight in children aged 0–12 years
Table 3 presents the results for the combined variables looking at the discordant and concordant categories of low family income (defined as Q1) versus higher (Q2–Q5) categories of neighbourhood income and deprivation. Children with low family income and low neighbourhood income had a high OR of obesity (OR=3.28, 95% CI 2.08 to 5.18). The OR of obesity was also high for children with low family income and higher neighbourhood income (OR=2.05, 95% CI 1.32 to 3.19), but not for children with higher family income and low neighbourhood income (OR=1.37, 95% CI 0.84 to 2.24). Similar findings were observed for the combination of family income and neighbourhood deprivation (table 3). Results of sensitivity analysis evaluating low defined as Q1 and Q2 versus higher Q3–Q5 for the discordant analysis were similar, but the ORs were not as strong. For example, for children with low family income and low neighbourhood income, the OR was 2.45 (95% CI 1.61 to 3.71).
Quantitative bias analysis was conducted to evaluate the potential impact of selection bias on the observed associations. The selection proportions for the quantitative bias analysis for selection bias were estimated using data from the CCHS on income and BMI among older children. We estimated that the selection proportions for exposure (E) and outcome (O) cells E+O+, E+O−, E-O+ and E-O− were 0.37, 0.63, 0.83 and 0.88 yielding a selection bias OR of 0.62; this suggests that participants with low income and obesity were about half as likely to participate as participants with high income and without obesity. Therefore, for our observed ORs of 4.69, 2.18 and 2.45, for each exposure of interest, the corresponding selection bias-adjusted ORs would be 7.53, 3.51 and 3.93, respectively. These results suggest that even if there is strong selection bias (in the direction that children from low-income families who had obesity were less likely to participate than children from low-income families without obesity), our results are likely biased towards the null. This suggests our results might underestimate the true magnitude of the association between low income and obesity. Further, using the E-value formula to evaluate uncontrolled or unmeasured confounding, we find that for our observed OR of 4.69 (95% CI 2.65 to 8.29) for the association between family income and obesity, the E-value would be 8.9 with a lower limit of the 95% CI of 4.7. This suggests that a very strong unmeasured confounder would be needed to explain away the observed association, that is, the observed OR of 4.69 could be explained away by an unmeasured confounder that was associated with both the exposure and the outcome by an OR of 8.9.
The weighted kappa statistics suggest low agreement between family-level and neighbourhood-level income (0.25, 95% CI 0.24 to 0.27) and family-level income and material deprivation (0.28, 95% CI 0.26 to 0.30) (table 4). As anticipated, the agreement between neighbourhood-level income and neighbourhood deprivation was somewhat stronger since neighbourhood-level income is one component of the neighbourhood deprivation index (0.51, 95% CI 0.50 to 0.53).
Agreement between measures of family income, neighbourhood income and material deprivation
Discussion
The overall findings of our study suggest that among young children recruited from primary care in the Greater Toronto Area in Canada, low family-level income, low neighbourhood-level income and neighbourhood deprivation are strongly associated with child obesity with adjusted OR estimates suggesting a 2–5-fold increased risk. This is larger than many other known behavioural and nutritional risk factors for child obesity.28
Further, our results suggest that family-level income has the strongest association and remains an independent predictor after adjusting for neighbourhood income. In contrast, the associations between both neighborhood-level income and neighbourhood deprivation and child obesity were attenuated when adjusted for family-level income. We also report that the agreement between both family income and neighbourhood income and between family income and neighbourhood deprivation was quite low in our population, emphasising that family-level and neighbourhood-level SES measure different constructs and might not be proxies of each other.
Given the extensive use of income measures in health equity studies in children, the associations between individual-level or family-level income versus area-level income and child obesity need to be delineated. Studies from other countries that have simultaneously examined the association between both area-level and individual-level risk factors and child BMI in children and youth provide consistent support for independent effects of neighbourhood-level SES factors after adjusting for family-level SES factors.29–32 There are numerous possible mechanisms that may explain why children in low-income families are more likely to have obesity, including healthy food affordability and access (eg, inadequate grocery stores in low-income neighbourhoods), access to recreational programmes and/or the built environment of their neighbourhood is not conducive towards an active lifestyle (eg, no playgrounds, walkways, etc). Future studies of childhood obesity should consider investigating these potential risk factors directly instead of neighbourhood SES which is a proxy for many things. Further, results of past studies were not stratified by sex, which has become increasingly important with the knowledge that the aetiology and trajectory of obesity differs in girls and boys33 34; however, our results do not provide strong evidence of sex differences in the association between SES and child obesity and larger sample sizes may be needed. As there is also considerable evidence for the association between contextual neighbourhood factors and health, past literature has attempted to disentangle contextual factors from individual risk factors in an attempt to better inform population health interventions.35
The low agreement between family income and both neighbourhood-level income and neighbourhood deprivation is consistent with previous studies.6 7 10 11 Previous literature has primarily focused on determining the impact of area-level measures of SES on BMI, over and above family-level and individual measures, and does not provide adequate comparisons of the two different income measures. Two of the US studies also produced misclassification rates of 20% and 31%, whereas the sole Canadian study produced a misclassification rate of 80%, much higher than what was observed in the USA. This is not an unusual finding as neighbourhoods in Toronto are much more structurally heterogenous than their southern counterparts.36
Strengths of this study include the relatively large sample of young children and the physical measurement of height and weight by trained research assistants. Further, the availability of both family-level and neighbourhood-level measures is a strength. Stratification by sex is also a strength of this study and it is possible that sex differences do exist although we may not have had sufficient power to assess. Potential limitations of this study include the cross-sectional study design although reverse causation seems unlikely it is a possibility. Our study cohort is skewed towards a high-income and highly educated population, which may limit generalisability of these results and may underestimate the true association between income and obesity. However, of greater concern is the potential for selection bias; weight stigma and bias are serious concerns and limit participation in research and healthcare seeking. Since this population was recruited from primary care, it is possible that there may be strong differential selection bias in that children with obesity and from low-income families may be the least likely to participate. The potential impact of selection bias on our study was investigated through a simple quantitative bias analysis using national data among older children for comparison which suggests that children from low-income families with obesity may have been less likely to participate in our study compared with children with low-income families and no obesity. The quantitative bias analysis suggests that our results likely underestimate the true association (ie, our results may be biased towards the null). As with all observational studies, misclassification error and residual confounding may also be present, but we do not think these would be the major sources of bias. Both income and zBMI were categorised for this analysis which limits power and has inherent limitations but was done to maintain a definition of obesity consistent with public health and clinical practice and to show possible non-linear associations. When considering the external validity of this study, it is important to recognise that this was not a population-based sample and may not be representative of the source population. Further, the ‘low’ family income category was defined as less than the first quintile which was $70 244 and this is relatively high for our population. The low-income measure threshold for before-tax income for a family of four in Toronto was defined as $51 031 in 2015.37
Although the rates of child obesity have stabilised in recent years in North America, child obesity remains a significant public health concern. It is evident that the burden of obesity is increasing among children with lower SES and public health initiatives need to take special consideration of such population groups.38 A recent review found limited evidence that child obesity interventions may reduce socioeconomic inequalities at the individual level, but evidence for community-level or societal-level interventions was inconclusive.39 In public health research, particular emphasis should be placed on SES and child health outcomes because the gradient between SES and health is known to widen with age and early childhood is a critical period in development. The results demonstrated that individual-level income was most strongly and independently associated with child obesity, however, a joint measure suggests that neighbourhood-level SES also matters in our urban setting. Therefore, in addition to individual-level socioeconomic variables, obesity prevention strategies should also consider neighbourhood-level variables and neighbourhood interventions directed at low-income families may be a helpful tool for preventing disparities in child obesity.
What is already known on this subject
Socioeconomic factors are important determinants of childhood obesity. However, the independent and joint associations between family-level income neighbourhood-level income and neighbourhood deprivation, with child obesity among young children in Canada, are unknown.
What this study adds
As a result of this study we now know that in our relatively affluent urban population, family-level income was a strong independent risk factor for child obesity. Further, neighbourhood income and deprivation were also strong risk factors and children from lower-income families living in low-income neighbourhoods were at the greatest risk. Individual-level and neighbourhood-level measures of income are independent and should both be addressed in childhood obesity interventions.
Data availability statement
Data are available upon reasonable request. Data are available upon request by contacting www.targetkids.ca/contact-us/ . The full data are not freely available to respect the confidentiality of our participants, ensure data integrity, and avoid scientific overlap between projects. Once initial contact has been made, we request a short research proposal which will be subject to review by the TARGet Kids! Scientific Committee and approval by institutional research ethics boards.
Ethics statements
Patient consent for publication
Ethics approval
This study was approved by the Research Ethics Board at the Hospital for Sick Children (REB-1000012436) and St. Michael’s Hospital, Toronto, Canada, and written informed consent was obtained from parents of all participating children.
References
Supplementary materials
Supplementary Data
This web only file has been produced by the BMJ Publishing Group from an electronic file supplied by the author(s) and has not been edited for content.
Footnotes
Twitter @AndersonLauraN
Collaborators The TARGet Kids! Collaboration.
Contributors LNA, TF, BShah and CDGK-S contributed to the statistical analysis. AF, CMB, BSmith, LNA, JM and CB contributed to the design and interpretation of study results. All authors read and revised the manuscript.
Funding Funding for this study was obtained from the Canadian Institutes of Health Research.
Competing interests None declared.
Provenance and peer review Not commissioned; externally peer reviewed.
Supplemental material This content has been supplied by the author(s). It has not been vetted by BMJ Publishing Group Limited (BMJ) and may not have been peer-reviewed. Any opinions or recommendations discussed are solely those of the author(s) and are not endorsed by BMJ. BMJ disclaims all liability and responsibility arising from any reliance placed on the content. Where the content includes any translated material, BMJ does not warrant the accuracy and reliability of the translations (including but not limited to local regulations, clinical guidelines, terminology, drug names and drug dosages), and is not responsible for any error and/or omissions arising from translation and adaptation or otherwise.