Article Text

Abstract
Background There is growing research into the effects of psychological and social factors such as loneliness and isolation on cardiovascular disease (CVD). However, it is unclear whether individuals with particular clusters of CVD risk factors are more strongly affected by loneliness and isolation. This study aimed to identify latent clustering of modifiable risk factors among adults aged 50+ and explore the relationship between loneliness, social isolation and risk factor patterns.
Methods Data from 8218 adults of English Longitudinal Study of Ageing were used in latent class analyses to identify latent classes of cardiovascular risk factors and predictors of class membership.
Results There were four latent classes: low-risk (30.2%), high-risk (15.0%), clinical-risk (42.6%) and lifestyle-risk (12.2%) classes. Loneliness was associated with a greater risk of being in the high-risk class (relative risk ratio (RRR) 2.40, 95% CI 2.40 to 1.96) and lifestyle-risk class (RRR 1.36, 95% CI 1.10 to 1.67) and a lower risk of being in the clinical-risk class (RRR 0.84, 95% CI 0.72 to 0.98) relative to the low-risk class. Social disengagement, living alone and low social contact were also differentially associated with latent class memberships.
Conclusion These findings supplement our existing knowledge of modifiable risk factors for CVD by showing how risk factors cluster together and how the risk patterns are related to social factors, offering important implications for clinical practice and preventive interventions.
- ageing
- cardiovascular disease
- cohort studies
- health behaviour
- social factors in
Data availability statement
Data are available in a public, open access repository. Data from ELSA are available from the UK Data Service (https://ukdataservice.ac.uk/). The access to the linked data with Hospital Episode Statistics can be obtained from NatCen.
This is an open access article distributed in accordance with the Creative Commons Attribution 4.0 Unported (CC BY 4.0) license, which permits others to copy, redistribute, remix, transform and build upon this work for any purpose, provided the original work is properly cited, a link to the licence is given, and indication of whether changes were made. See: https://creativecommons.org/licenses/by/4.0/.
Statistics from Altmetric.com
Introduction
Cardiovascular diseases (CVD) is a major health problem globally and in the UK. According to the British Heart Foundation,1 there are around 7.4 million people living with CVD in the UK. CVD is the second leading cause of death in the UK which accounted for 27% of all death.2 CVD, in particular stroke, is also a major contributor of acquired adult disability. It is reported that between 55% and 77% of stroke survivors are severely disabled or require assistance with activities of daily living.3 CVD imposes a major financial burden, costing the UK 9 billion for healthcare and another 4 billion for non-health care.4 The National Health Service (NHS) long-term plan has set CVD as one of its clinical priorities, setting an ambition to prevent CVD cases over the next 10 years.5
Previous research has identified a broad range of risk factors for CVD which can be classified into two groups: non-modifiable and modifiable risk factors. The former includes demographic characteristics (e.g., age, gender, ethnicity) and family history.6 The latter can be sorted into three domains, including: (1) clinical/biological risks such as obesity, diabetes, hypertension and dyslipidaemia,7 8 (2) psychosocial factors, such as stress, anxiety and depression7 9 and (3) behavioural/lifestyle risks, including sleep, drinking, smoking, diet and physical activity.7 10
Over the past two decades, there is growing research into social factors such as loneliness and social isolation. Several studies identified loneliness and social isolation as risk factors for CVD and CVD-specific mortality.11 Much research to date has suggested that these associations result from activation of a range of clinical risk mechanisms. For example, loneliness and social isolation were related to increased concentrations of stress hormones,12 blood pressure,13 levels of inflammatory markers14 and the risk of developing obesity, diabetes or hypertension.15 16 It was found that loneliness and social isolation exacerbated other psychosocial and behavioural risk factors such as higher levels of depression,17 decreased physical activity and increased smoking.13
However, while there are evidently multiple mechanisms by which social isolation and loneliness can affect CVD risks, it remains unclear if all individuals are equally affected. Given that risk factors tend to cluster together, it could be that certain groups of people, for example those who lead particularly unhealthy lifestyles having a number of behavioural risks or individuals with a number of clinical conditions, may be more strongly affected by loneliness and social isolation. This may not be manifested using the conventional risk score approach, which quantifies CVD risks but overlooks the pattern of combinations. Therefore, this study sought to identify clusters of modifiable CVD risk factors including clinical, psychosocial and behavioural risks using latent class analysis (LCA) and to explore the relationship between loneliness, social isolation and latent clustering of CVD risk factors.
Data and method
Data came from the English Longitudinal Study of Ageing, a large-scale panel study of people aged 50 or over and their partners, living in private households in England. The original sample was drawn from participants from the Health Survey in England in 1998, 1999 and 2001. The first wave of data collection took place in 2002/2003, and participants have been followed biennially since. Data collection is carried out though face-to-face interviews, self-completion questionnaires and nurse visits (every 4 years). We used wave 4 (2008/2009) in this study because some variables of interest were not measured at earlier waves. Of 9886 core members in this wave, 8218 participants had a nurse visit to provide the data relevant to our analyses. Further analysis including covariates excluded participants with missing values, reducing the sample size to 5947.
CVD risk indicators
Our analysis included risk indicators that were commonly used in risk assessment models such as the Systematic Coronary Risk Evaluation18 and Framingham Risk Score.19 These included hypertension, high cholesterol, diabetes, obesity and smoking. In addition, we also considered other indicators identified in the literature, such as depression, abnormal sleep, drinking, diet and physical activity.7 10
Hypertension was defined as having a diagnosis or a systolic blood pressure ≥140 mm Hg or diastolic blood pressure ≥90 mm Hg.20 Cholesterol risk was derived based on total cholesterol to high-density lipoprotein (HDL) cholesterol (TC/HDL-C) ratio, >4 for men and >3.5 for women.21 Diabetes was defined as having a diagnosis or a fasting glucose level ≥7 mmol/L.22 Abdominal obesity was defined as having a waist circumference ≥102 cm for men and ≥88 cm for women.23
Depression was measured using the eight-item Centre for Epidemiological Studies-Depression (CES-D) Scale, in addition to diagnoses of depression. The cut-off point 4 of the CES-D scale was used for defining serious depressive symptoms.24
Both long and short sleep durations have been associated with CVD.25 We defined disturbed sleep as ≤5 hours or ≥9 hours.26 Smoking was coded as a binary variable indicating whether participants were current smokers. Heavy drinking was defined as if participants drank daily and had ≥14 units of alcoholic drink in the past week. Poor diet was defined as having ≤5 portions of fruits and vegetables daily. Physical inactivity was defined as exercising less than weekly at either vigorous (eg, running, swimming, cycling, aerobics etc.) or moderate levels (eg, gardening, walking etc.).
Most of these risk variables were positively associated with each other as expected (see online supplemental figure S1). However, heavy drinking was negatively associated with many other risks. It was possible that drinking was confounded with social factors, for example, the frequency of social interactions. Therefore, drinking was excluded from the analyses.
Supplemental material
Loneliness and social isolation
Loneliness was measured using the three-item University of California, Los Angeles (UCLA) loneliness scale. Social isolation was measured in three ways. Living alone was coded as a binary variable to capture domestic isolation. Low social contact was derived from the frequency of social contacts (meeting up or speaking on the phone) with children, relatives and friends (a six-point scale from three or more times a week to never). Finally, social disengagement was measured by the frequency of (1) group membership (none, one group or two or more groups), (2) formal volunteering (a five-point scale from never to twice a month or more) and (3) engagement with cultural activities, for example, going to museums and exhibitions (a six-point scale from never to twice a month or more). Both low social contact and social disengagement were generated by confirmatory factor analysis (CFA) using the mean-adjusted and variance-adjusted weighted least squares (WLSMV) estimator. Both were standardised to a mean of 0 and standard deviation (SD) of 1, with higher scores indicating less social contact and increased social disengagement.
Other covariates
In addition to modifiable risk factors in the LCA model, our analyses also included non-modifiable risk factors, including gender (women vs men), ethnicity (white vs non-white) and age groups (50–59, 60–69, 70–79, 80+). There were also a set of socioeconomic measures, including education (degree or above, a level or below, no qualification), social class recoded from the National Statistics Socio-Economic Classification (high, medium, low) and household wealth in deciles. Finally, we considered existing CVD diagnoses, a binary variable indicating whether participants had reported any of the following diagnoses: angina, heart attack, congestive heart failure, heart murmur, abnormal heart rhythm, stroke and other heart disease.
Statistical analysis
We used LCA to depict the clustering of modifiable CVD risks. LCA posits that there is an underlying latent structure that divides a population into mutually exclusive and exhaustive classes. To determine the number of classes, we compared model fits on the basis of Akaike information criterion (AIC) and Bayesian information criterion (BIC). For both indices, smaller values indicate a finer balance between model fit and parsimony. We started with an unconditional LCA model, including only modifiable risk factors. We then introduced loneliness and social isolation measures as predictors of the latent class membership (model I). We then further added socioeconomic measures and existing CVD conditions (model II). These were estimated based on a multinomial logistic regression implemented simultaneously with the LCA model. CFA scores with WLSMV estimators were generated in R 3.5.1, but the full analyses were carried out using Stata V.15.
Results
Descriptive
Of 8218 participants without missing values in any of the CVD risk indicators, 51% had hypertension, 55% with high cholesterol, 9% diabetes, 54% abdominal obesity, 17% depression. Approximately 6% of participants experienced disturbed sleep. About 12% of them were current smokers, 43% not having a healthy diet and 34% being physically inactive. For sample demographic characteristics, see online supplemental table S1.
Latent classes
Starting with a single-class model, additional classes improved the model fit up to a four-class specification (figure 1A). BIC marginally increased from the four-class to five-class model, so the four-class model was identified as the optimal solution. As shown in figure 1B, the largest was class 3 (about 42.6%), followed by class 1 (30.2%), class 2 (15.0%) and class 4 (12.2%). The predicted probabilities of risk indicators for each class are shown in figure 2. Class 1 was termed the ‘low-risk’ group which consisted of people with a healthy lifestyle and a very low probability of having clinical risks. Class 2 contained people with a very high probability of having both clinical and behavioural risks (in particular, poor diet and physical inactivity). It was labelled as the ‘high-risk’ group. Class 3 which was characterised as having a high probability of clinical risks but a relatively healthy lifestyle was labelled as the ‘clinical-risk’ group. Finally, class 4 was characterised as having an unhealthy lifestyle, but with only a moderate probability of having clinical risks. This was labelled as the ‘lifestyle-risk’ group.
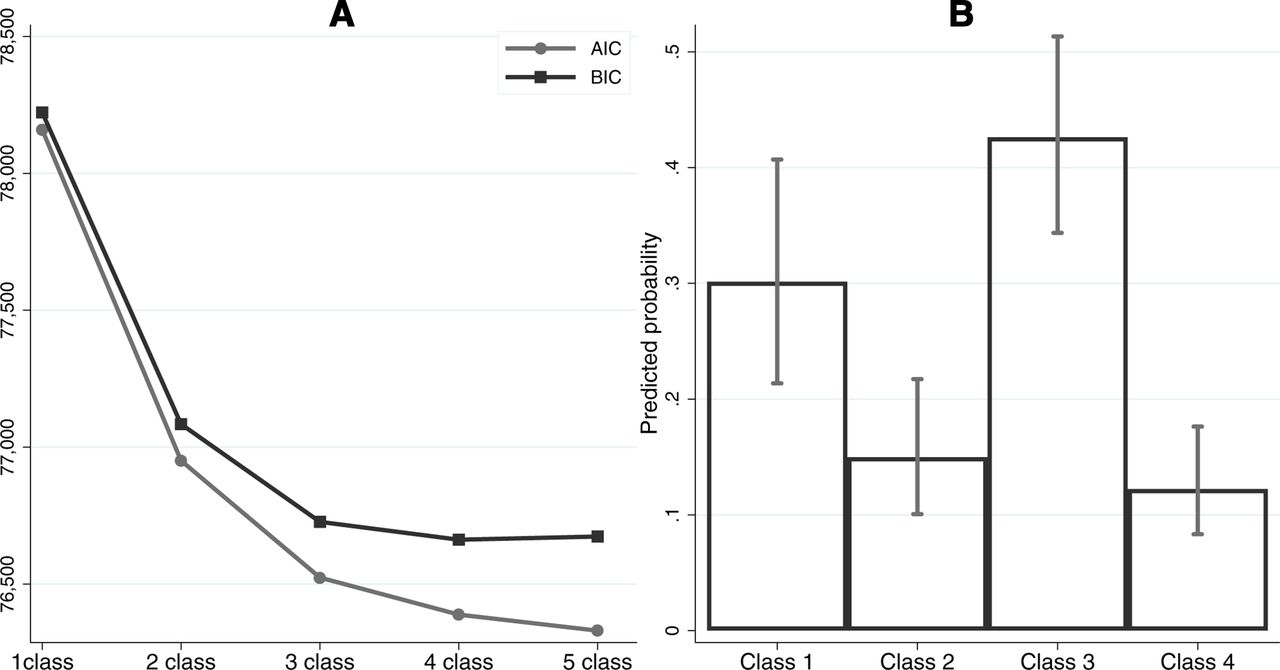
Model fit indices and predicted probability of class membership. AIC, Akaike information criterion; BIC, Bayesian information criterion.

Predicted probabilities of cardiovascular disease risks by latent classes from latent class analysis.
Loneliness, isolation and class membership
Table 1 reports the estimated relative risk ratio (RRR) and 95% CI for loneliness and social isolation measures using the low-risk class as reference. In the full model, loneliness was especially associated with the probability of being in the high-risk class (model II: RRR 2.40, 95% CI 2.40 to 1.96) and the lifestyle-risk class (model II: RRR 1.36, 95% CI 1.10 to 1.67) relative to the low-risk class. People who were lonely were less likely to be in the clinical-risk class (model II: RRR 0.84, 95% CI 0.72 to 0.98). Living alone was associated with higher risk of being in all three classes than the low-risk class, but when additionally controlling for socioeconomic factors and existing CVD conditions, only the association with being in the lifestyle-risk class remained (model II: RRR 1.86, 95% CI 1.18 to 2.91). Low social contact was only associated with a lower risk of being in the high-risk class (model II: RRR 0.78, 95% CI 0.66 to 0.92). Finally, social disengagement was associated with a higher risk of being in the lifestyle-risk class especially (model II: RRR 3.70, 95% CI 2.91 to 4.70), as well as the high-risk class (model II: RRR 3.03, 95% CI 2.40 to 3.83) and the clinical-risk class (model II: RRR 1.22, 95% CI 1.04 to 1.43).
Relative risk ratio (RRR) and 95% CI from the latent class analysis model with covariates using the low-risk group as the reference (N=5947)
Figure 3 presents the predicted probability of class membership by loneliness and social isolation from the full model. Higher levels of loneliness were markedly associated with increased probability of being in the high-risk class and lowered probability of being in the clinical-risk class as well as a slight decrease of being in the low-risk class (figure 3A). Greater social disengagement was associated with declines in the probability of being in the low-risk or clinical-risk classes and increased probability of being in the lifestyle-risk and high-risk classes (figure 3B). Living alone was associated with a lower probability of being in the low-risk class and a higher probability of being in the lifestyle-risk class (figure 3C). Finally, lower social contact was associated with a slight decrease in probability of being in the high-risk class and a slight increase of being in the lifestyle-risk class (non-significant) (figure 3D).

Predicted probabilities of latent cardiovascular disease risk groups.
As a sensitivity analysis, we also fitted a multigroup latent class model by gender. No evidence was found that the latent structure of CVD risks differed between men and women (see online supplemental figures S2 and S3).
Discussion
Our analyses identified four latent classes of modifiable CVD risks among older adults: (1) a low-risk class with few risks, (2) high-risk class with a range of risk factors, (3) clinical-risk class, who have poor health but a healthy lifestyle and (4) lifestyle-risk class, who have an unhealthy lifestyle but relatively good health. Further, we found that social disengagement was consistently associated with being in one of the higher-risk classes (classes 2–4), while other social factors, such as loneliness, living alone and low social contact had differential associations with different patterns of modifiable risks.
We found that modifiable CVD risk factors tend to cluster around two groups: clinical and lifestyle risks. As a result, people with hypertension have a high probability of having other CVD-related clinical conditions; and poor diet is likely to be companied by other lifestyle risks, such as smoking and physical inactivity. This echoes previous studies that have shown a high prevalence of concomitant conditions, such as diabetes, hypertension, dyslipidaemia and obesity,27 and the clustering of health behaviours within individuals.28 No class exhibits a mixture of high and low lifestyle or clinical risks. Moreover, we found that depression tend to cooccur specifically with lifestyle risks. This is supported by evidence showing a strong association between lifestyle measures and depression.29 Notably, depression was not characteristic of the clinical-risk class. While depression is often comorbid with conditions such as hypertension, diabetes and obesity,30–32 our results suggest two possibilities. Either among individuals with these physical health conditions, an absence of depression might help to buffer against the risk of engaging in unhealthy behaviours,33 or the engagement in a healthy lifestyle might help to reduce the risk of developing depression.29
Our findings build on previous literature suggesting that social factors are associated with CVD risk, but extends these findings by showing differential associations with different patterns of risk factors. Our most consistent finding was that social disengagement was associated with a heightened probability of being in any of the classes other than the low-risk class. Social engagement in activities such as volunteering, community groups and culture has been shown to build aspects of social capital and enhance individual’s informational and structural resources.34 Therefore, it is possible that individuals who are disengaged have less access to such support and are more likely to lead unhealthy lifestyles and accumulate avoidable health conditions. Importantly, this finding persisted independent of wealth, social class and education, suggesting it does not merely reflect socioeconomic factors. Further, the association was less strong for the clinical-risk group, who may already be engaging more proactively in healthy behaviours.
We also found that loneliness was associated with an increased probability of being in the high-risk class but a lowering probability of being in the clinical-risk class. The high-risk versus clinical-risk class is differentiated by the fact that the former contains individuals with depression who are engaging in unhealthy behaviours while the clinical-risk group contains individuals who have poor health but a healthy lifestyle and little evidence of depression. This is consistent with previous research showing that individuals who are lonely are more likely to be depressed and engage in unhealthy behaviours.35 However, it is notable that loneliness is associated with a lower risk of being in the clinical-risk group compared with the low-risk group. Levels of depression were similar across these two classes, such that the only major difference is that the clinical-risk group has poor health conditions. One potential explanation for this finding could be that people from the clinical-risk group may have engaged in more healthy behaviours as a result of their health conditions; a behavioural change that could have caused them to consider their lives more broadly and led them to address any deficits in the quality of their social interactions. However, this remains to be tested further.
Our third finding was that living alone and low social contact only had small associations with class membership. Living alone was associated with a higher probability of being in the lifestyle-risk group, which could be due to the absence of another to help modify unhealthy behaviours.36 Indeed, it has previously been shown that people are more likely to make a positive health behaviour change if their partner does too.37 But any other associations for living alone were attenuated when accounting for socioeconomic factors. Further, low social contact was associated with a lower probability of being in the high-risk class. It is possible that unhealthy behaviours among individuals with existing health conditions may be partly driven by socialising.38 Conversely, among individuals who have fewer health conditions (the lifestyle-risk group) or are being more proactive in their health behaviours (the clinical-risk group), social contact does not present as a vulnerability. It is also relevant to draw parallels between the finding for low social contact and social disengagement and the probability of being in the high-risk group. Low social contact presents a decreased risk of being high risk, while engagement with community activities has protective associations. This builds on findings from studies showing that engagement in community activities can help to build factors such as self-esteem, self-efficacy and agency that may support health behaviours.39
To our knowledge, our study is the first to investigate the latent structure of modifiable cardiovascular risks in a western context. It has the advantage of a large and representative sample. Moreover, our study has shown the link between social factors and the latent structure of cardiovascular risks for the first time. However, the study is not without limitations. First, our list of risk indicators is by no means exhaustive. Due to data constraint, we were unable to consider other risk factors such as stress. Further, as our analysis is based on people aged 50 or over, it remains unknown whether the same pattern occurs in younger age groups. Finally, this is a cross-sectional study, so causality cannot be established and our results must be interpreted with caution. Future research could explore how clusters of CVD risk factors evolve over time and which changing behavioural or clinical risk patterns pose the highest risk for CVD.
Overall, these findings supplement our existing knowledge of modifiable CVD risk factors by showing how different risks cluster together, and shows for the first time the differential patterns of association with different social factors. This study has implications for clinical practice, where an understanding of risk patterns could support the development of interventions for different groups of people, offering tailored health recommendation protocols.
What is already known on this subject
Previous research has established a range of cardiovascular disease (CVD) risk factors. There has been evidence for the association between social factors, such as loneliness and social isolation, and CVD events and risks.
What this study adds
This study has shown for the first time the latent structure of the modifiable cardiovascular disease (CVD) risk factors in a Western context. Further, it shows how loneliness and different aspects of social isolation are differentially associated with the latent classes of CVD risk factors. Our findings offer important implications for clinical practice and preventive interventions.
Data availability statement
Data are available in a public, open access repository. Data from ELSA are available from the UK Data Service (https://ukdataservice.ac.uk/). The access to the linked data with Hospital Episode Statistics can be obtained from NatCen.
Ethics statements
Patient consent for publication
References
Supplementary materials
Supplementary Data
This web only file has been produced by the BMJ Publishing Group from an electronic file supplied by the author(s) and has not been edited for content.
Footnotes
Correction notice This article has been corrected since it first published. The provenance and peer review statement has been included.
Contributors All authors conceived and designed the study. FB analysed the data and FB and DF wrote the first draft. All authors provided critical revisions. All authors read and approved the submitted manuscript.
Funding The funding for English Longitudinal Study of Aging is provided by the National Institute on Aging [R01AG017644] and a consortium of UK government departments coordinated by the Economic and Social Research Council. DF was supported by the Wellcome Trust [205407/Z/16/Z]. This research was supported through a grant from the Leverhulme Trust [PLP-2018-007].
Competing interests None declared.
Provenance and peer review Not commissioned; externally peer reviewed.
Supplemental material This content has been supplied by the author(s). It has not been vetted by BMJ Publishing Group Limited (BMJ) and may not have been peer-reviewed. Any opinions or recommendations discussed are solely those of the author(s) and are not endorsed by BMJ. BMJ disclaims all liability and responsibility arising from any reliance placed on the content. Where the content includes any translated material, BMJ does not warrant the accuracy and reliability of the translations (including but not limited to local regulations, clinical guidelines, terminology, drug names and drug dosages), and is not responsible for any error and/or omissions arising from translation and adaptation or otherwise.