Article Text

Abstract
Introduction Air pollution has been suggested to be associated with depression. However, current evidence is conflicting, and no study has considered different sources of ambient particulate matter with an aerodynamic diameter below 2.5 µm (PM2.5). We evaluated the associations of long-term exposure to PM2.5 from road traffic and residential wood combustion with the prevalence of depression in the Helsinki region, Finland.
Methods We conducted a cross-sectional analysis based on the Helsinki Capital Region Environmental Health Survey 2015–2016 (N=5895). Modelled long-term outdoor concentrations of PM2.5 were evaluated using high-resolution emission and dispersion modelling on an urban scale and linked to the home addresses of study participants. The outcome was self-reported doctor-diagnosed or treated depression. We applied logistic regression and calculated the OR for 1 μg/m3 increase in PM2.5, with 95% CI. Models were adjusted for potential confounders, including traffic noise and urban green space.
Results Of the participants, 377 reported to have been diagnosed or treated for depression by a doctor. Long-term exposure to PM2.5 from road traffic (OR=1.23, 95% CI 0.86 to 1.73; n=5895) or residential wood combustion (OR=0.78, 95% CI 0.43 to 1.41; n=5895) was not associated with the prevalence of depression. The estimates for PM2.5 from road traffic were elevated, but statistically non-significant, for non-smokers (OR=1.38, 95% CI 0.94 to 2.01; n=4716).
Conclusions We found no convincing evidence of an effect of long-term exposure to PM2.5 from road traffic or residential wood combustion on depression.
- depression
- environmental health
- traffic
- air pollution
Data availability statement
Data are available upon reasonable request. Health data are not available due to confidentiality issues. Reuse of the concentration and meteorological data is permitted upon request, without limitations. Contact: Professor Jaakko Kukkonen, Finnish Meteorological Institute, Erik Palmenin aukio 1, PO Box 503, FI-00101 Helsinki (email: jaakko.kukkonen@fmi.fi, ORCID identifier https://orcid.org/0000-0002-5943-7069).
This is an open access article distributed in accordance with the Creative Commons Attribution Non Commercial (CC BY-NC 4.0) license, which permits others to distribute, remix, adapt, build upon this work non-commercially, and license their derivative works on different terms, provided the original work is properly cited, appropriate credit is given, any changes made indicated, and the use is non-commercial. See: http://creativecommons.org/licenses/by-nc/4.0/.
Statistics from Altmetric.com
Introduction
The physical environment has been suggested to play an important role in mental well-being, but relevant environmental components remain unclear. Emerging evidence suggests that air pollution could be associated with a mental health decline.1
The hypothesis that particulate matter affects the biological mechanisms behind depressive disorders is plausible. Several theories on the pathophysiology of depression have been presented.2 3 Some of the covered pathophysiological processes, such as inflammation and oxidative stress, neurotransmitter imbalances including monoamine and serotonin decrease, elevated glucocorticoids, and brain atrophy, have been shown to correlate with exposure to particulate matter. Indeed, a few studies have reported that particulate matter is associated with inflammation and oxidative stress in animal brain.4 5 Particulate matter has also been associated with stress hormone release in animals and humans, and with decreased hippocampal nerve growth factors along with depressive symptoms in animals.4 6 Short-term exposure to gasoline exhaust has caused changes in neurotransmitter levels in favour of depression in rats.7
Epidemiological studies have also suggested that exposure to air pollution could be associated with depression. Both short-term (hourly or daily) and long-term exposures to ambient particulate matter with an aerodynamic diameter below 2.5 µm (PM2.5) have shown a correlation with depression. However, the evidence base is limited due to the scarcity of available studies and the shortcomings in their design.8 9 Moreover, results have been conflicting, especially for areas with lower concentrations of PM2.5.10 To our knowledge, no research has considered the associations between depression and different source categories of PM2.5.
This study evaluates the associations of long-term exposure to PM2.5 from road traffic and residential wood combustion with the prevalence of depression in the Helsinki region, Finland, an area with relatively low PM2.5 levels (annual average in most locations ≤10 µg/m³). Road traffic and wood combustion are the main local sources of fine particles in the study area.
Methods
Study design and population
We conducted a cross-sectional study based on the Helsinki Capital Region Environmental Health Survey. The survey was conducted by the Finnish Institute for Health and Welfare in Finland, in Helsinki in 2015 and in Vantaa and Espoo in 2016, as described earlier.11 Participants (n=7321), aged 25 years and above, were sampled randomly from the general population living in the Helsinki region using the population register. The survey response rate was 47% in 2015 and 45% in 2016.
Exposure assessment
We used residential outdoor levels of fine particulate matter as estimates of personal exposure. Estimates of traffic-originated PM2.5 concentrations in the Helsinki region were based on emission and dispersion modelling. The dispersion model used was the ‘Contaminants in the Air from a Road-Finnish Meteorological Institute’.12 Vehicular exhaust emission factors originated from 2014, and meteorological data for years 2012–2014 were used in the modelling. The distances between the receptor points varied from 25 m near roads to 200 m in rural areas. In the present study, the PM2.5 concentration assigned to a participant’s home was evaluated as the road traffic concentration at the nearest outdoor modelling point. The highest annual average of 2010–2014 was used as the exposure estimate.
The outdoor concentrations of PM2.5 have been modelled globally, in Europe and in the Helsinki region for a period of 35 years, from 1980 to 2014.13 In the Helsinki region, the emissions originating from domestic wood combustion were assumed to be uniformly distributed in area sources of size 100×100 m2. The corresponding concentrations were evaluated using the Urban Dispersion Model of the Finnish Meteorological Institute on a horizontal resolution of 100×100 m2.13 In the present study, the concentration of PM2.5 for each participant’s home was evaluated as the residential wood combustion concentration at the nearest outdoor modelling point. The average values for the years from 2010 to 2014 were used as the exposure estimates.
The description of how exposures to traffic noise and green and blue spaces were estimated is available in online supplemental materials and methods.
Supplemental material
Primary outcome measure
We used a binary outcome measure for depression that was based on self-report. The question in the survey was ‘has a doctor diagnosed or treated you for [depression] during the last year (12 months)?’ with response options (yes/no).
Statistical analysis
We performed logistic regression analyses using the function glm() in R V.3.6.0 software.14 We calculated the ORs for 1 µg/m3 increase in PM2.5 and their 95% CIs.
In the crude model, we included residential wood smoke and road traffic PM2.5 simultaneously and adjusted air pollutant effects for road traffic noise (Lden), green space within 1 km, age and sex. In the main model, we included variables of the crude model but further adjusted for marital status, employment status, annual household income, education, alcohol intake in the last 7 days, daily smoking, weekly physical exercise, area-level unemployment (rate, %) and area-level income (mean, €). In the single-pollutant models, we considered either road traffic PM2.5 or residential wood combustion PM2.5, and we adjusted for the same covariates as in the main model. Covariate categories are described in online supplemental table S1.
Using the main model, we tested the linearity of the exposure–response function for air pollution and for the confounders used on a continuous scale, namely road traffic noise, green space within 1 km, area-level unemployment and area-level income. We used the spline function s() from the mgcv package V.1.8–33.15
To test the consistency and robustness of the results, we conducted several sensitivity analyses, each on the main model: in separate models, we considered potential confounding by green space within 300 m; nature space within 1 km (including green and blue spaces and excluding field and pasture, %); use of summer cottage in summer; body mass index (kg/m2); own wood combustion; comorbidities; and road traffic noise annoyance. A detailed description of these variables is available in online supplemental table S1.
We also used information on depression medication intake as an alternative outcome measure. It was defined by the survey question ‘when did you last take [antidepressants]?’ and the possible answers were ‘during the past week’, ‘one to four weeks ago’, ‘one to 12 months ago’, ‘over a year ago’ and ‘never’. We then dichotomised this outcome measure by categorising the three first possible answers as ‘depression medication use’ and the two last possible answers as ‘no depression medication use’.
In further sensitivity models, we excluded one by one some population groups: smokers, participants who had lived in the same address for less than 1 year or less than 3 years, and participants living in floors higher than the fifth floor. To test for potential effect modification, we applied a multiplicative function for road traffic noise, by adding an interaction term road traffic noise*road traffic PM2.5 in the model. Finally, we tested the effect of influential data points, including outliers, and we checked whether the variables used on a continuous scale were collinear.16
Results
The total number of study participants with full exposure and confounder data was 5895. Of these participants, those diagnosed or treated for depression by a doctor represented 6.4% (n=377) and those using depression medication 6.6% (n=385). The mean residential outdoor concentration of PM2.5 attributable to road traffic was 0.59 µg/m³ and that attributable to residential wood combustion was 0.52 µg/m³.
These estimates correspond to an urban background concentration of ambient PM2.5 of 8 µg/m³ in the Helsinki region, as measured in 2014 at the station of Kallio.17 The station is located in central Helsinki, in a park area which is not immediately influenced by any road. The concentration value at this station in 2014 consisted mainly of regional and long-range transported particulate matter, with smaller contributions from urban traffic and residential wood combustion.18 19
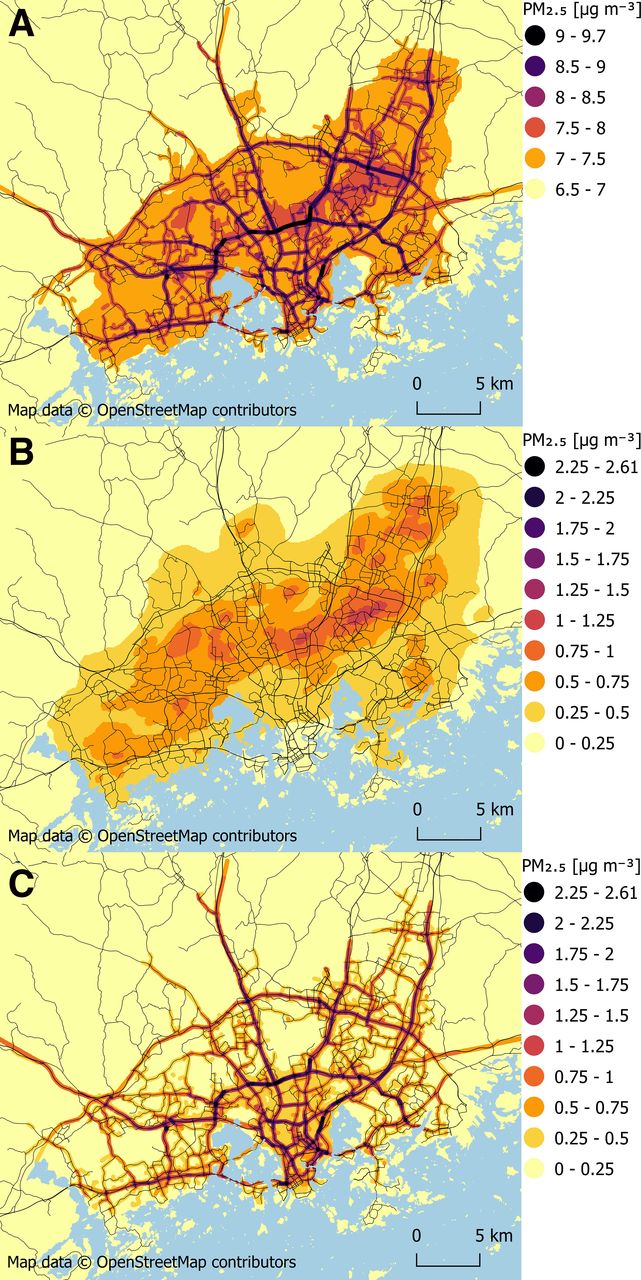
The modelled concentrations of PM2.5 in the Helsinki region in 2013, originating from all sources and from the two considered urban source categories, are presented in figure 1A–C. The concentrations originating from residential wood combustion are focused mainly on the suburbs situated north and north-west from the centre of Helsinki. The predicted spatial distributions of the yearly PM2.5 concentrations in this region during various years and originating from various source categories have been discussed in more detail.18 19

Predicted concentrations of PM2.5 in the Helsinki metropolitan area in 2013, originating from (A) all urban sources and the long-range and regionally transported background, (B) residential wood combustion, and (C) vehicular traffic. The figures also show the location of the main street and road network and the sea areas. Map data copyright: OpenStreetMap contributors. PM2.5, particulate matter with an aerodynamic diameter ≤2.5 μm.
Tables 1 and 2 present the key characteristics of the study participants and their environment.
Key characteristics of the study participants (N=5895)
Descriptive statistics for the environmental exposures of study participants (N=5895)
The mean age of the study participants was 53.6 years. The prevalence of high alcohol intake (ie, more than six units per week) was 18.3% (n=1076). The prevalence of participants who reported to burn wood themselves at least once a week was 11.9% (n=680). The mean coverage of nature space within 1 km was 29.4% (SD=12.53) and of green space within 300 m 19.45% (SD=14.17). Participants who experienced some to extremely high road traffic noise annoyance represented 9.1% (n=539). Participants using summer cottage for 2 weeks at least, during summertime, counted for 33.9% (n=1981). Participants who had lived in the same address for less than 1 year represented 7.5% (n=439), those living in the same address for less than 3 years 28.0% (n=1651), and participants living in the fifth floor or lower 87.4% (n=5139). Online supplemental figure S1 presents the correlation matrix for the continuous covariates of exposure and outcomes.
In the crude model, long-term exposure to road traffic PM2.5 was associated with the prevalence of depression (OR=1.54, 95% CI 1.10 to 2.14). Using the main model, we still found an elevated effect estimate for PM2.5 from traffic, but it was not statistically significant (OR=1.23, 95% CI 0.86 to 1.73). Similarly, in the single-pollutant model we found somewhat elevated but not statistically significant effect estimate for PM2.5 from traffic (OR=1.29, 95% CI 0.93 to 1.79). We found no association between long-term exposure to residential wood combustion PM2.5 and depression in the crude model, main model (OR=0.78, 95% CI 0.43 to 1.41) or single-pollutant model (table 3).
Associations of long-term exposure to road traffic PM2.5 and residential wood combustion PM2.5 with the prevalence of depression, calculated for a 1 µg/m3 increase in PM2.5 (N=5895)
Adding income to the crude model diminished the effect estimate for traffic-related PM2.5 to a statistically non-significant level (OR=1.27, 95% CI 0.90 to 1.77). The income variable included four categories (online supplemental table S1) and correlated with both the mean PM2.5 from road traffic and depression: individuals with the lowest incomes (ie, earning up to €30 000 per year) were exposed to the highest levels of PM2.5 from road traffic (0.62 µg/m³) and had the highest prevalence of depression with 48.5%.
We concluded all confounders to have a linear relationship with the outcome based on the shape of the exposure–response functions (online supplemental figures S2‒S5). Similarly, the exposure–response functions for air pollution effects could be considered linear (online supplemental figures S6 and S7).
In further sensitivity analyses, the results remained essentially the same as in the main analyses. However, when only non-smokers were included, effect estimate for the association between PM2.5 from road traffic and depression increased, but was still statistically non-significant (OR=1.38, 95% CI 0.94 to 2.01; n=4716) (online supplemental table S2). The test on the effect modification by road traffic noise was inconclusive (p=0.12). Removing influential data points with the highest hat value (>0.0225) had no effect on the main model, either for road traffic PM2.5 (OR=1.28, 95% CI 0.89 to 1.82; n=5883) or residential wood combustion PM2.5 (OR=0.80, 95% CI 0.44 to 1.46; n=5883). Finally, we found that the continuous variables used in the analysis were not collinear (data not shown).
Discussion
We conducted a cross-sectional analysis to study the associations of long-term exposure to PM2.5 from road traffic and residential wood combustion with depression in the Helsinki region, Finland. Although the crude model showed an association between long-term exposure to road traffic PM2.5 and the prevalence of depression, no clear associations were found after controlling for additional confounders. In non-smokers, there was a suggestive association between PM2.5 from road traffic and depression. We found no association between long-term exposure to residential wood combustion PM2.5 and the prevalence of depression.
No other study has evaluated the effects of source-specific PM2.5 on depression. However, comparisons can be made with studies that have included total PM2.5. The present study is in line with the evidence from two systematic reviews and meta-analyses. One meta-analysis found no association of PM2.5 with depression after either short-term or long-term exposure.8 Another meta-analysis found no association of long-term exposure to PM2.5 with depressive symptoms for levels of PM2.5 less than 15 µg/m3.10 The urban background level of ambient PM2.5 in the Helsinki region was 8 µg/m³ in 2014.17 One more meta-analysis reported an association related to long-term exposure, but included only studies published in English up to September 2017, while the literature has grown rapidly afterwards.9
Similarly to our findings, several cohort studies found no clear associations between long-term exposure to ambient PM2.5 and depression in areas with low (<10 µg/m³) or moderate (10–25 µg/m³) concentrations. These studies include three European cohorts and one prospective cohort from the USA.20 21 One other cohort from South Korea also found no association between exposure to PM2.5 and depression.22
Of the three European cohorts, one was Finnish. However, it was different from this study in terms of setting, study years, outcome definition and exposure modelling. The cohort included data from the city of Turku in addition to Helsinki and Vantaa, and the outcome was based on self-reported depressed mood. Health data were collected in 2007 and air pollution modelled for the years 2010–2011 using land use regression methodology. The sample was also smaller than the sample in the present study (n=1367), and 11.3% participants had depressed mood.20
Some other cross-sectional and longitudinal studies suggest that there could yet be an association between long-term exposure to ambient PM2.5 even in areas with low (<10 µg/m³) or moderate (10–25 µg/m³) levels and depression.23–28 That said, the results of one longitudinal study suggested that long-term exposure to PM2.5 in an area with low concentration is associated with the onset of depression in the elderly, but may not be associated with its continuation or exacerbation.29
Most of the studies showing no clear associations tend to have increased ORs/risk estimates but also large CIs crossing the null-effect line.20 21 23 30 Therefore, an effect cannot be ruled out. In areas with long-term levels of PM2.5 exceeding 15 µg/m³, stronger and more consistent associations with depression have been reported.10 31–35
To our knowledge, the present study is the first to consider road traffic and residential wood combustion as source categories of PM2.5 in relation with depression. These sources may have different health effects due to differences in the chemical composition; for example, a higher concentration in polycyclic aromatic hydrocarbons has often been found in residential wood smoke, which may indicate a higher toxicity.36–38
The present study is also one of the rare studies that control for the confounding effect of green space and road traffic noise. Most of the available studies described above did not adjust for these important confounders.21 22 24 26 27 29 30 39 The three European cohorts controlled for noise, and the association between PM2.5 exposure and depression was not clear.20 One cross-sectional study for which noise data were available for a small sample found no effect of noise on depression, but did not include noise in the models to assess the association between PM2.5 exposure and depression.24 One cross-sectional study adjusting for noise and green space found no clear associations between PM2.5 and depression.23
One of the strengths of this study is the assessment of exposure. The models used to estimate PM2.5 in the Helsinki region are sophisticated and have been shown to predict measured PM2.5 reasonably well. The annual average concentration of PM2.5 from road traffic did not change significantly in the period 2010–2014.12 Thus, these estimates are expected to reflect long-term exposure of the study participants. In 2008, 72%–92% of PM2.5 in the Helsinki region originated from outside of Finland.40
The present study was based on an a priori protocol, from which we only deviated to conduct more sensitivity analyses than planned initially. The extensive sensitivity analyses supported the initial findings, which increased confidence in the results.
The cross-sectional design of our research is an obvious limitation and longitudinal studies controlling for green space and traffic noise are necessary to further confirm these findings. The participation rate of the survey was 45%–47%. If persons with depression were less likely to participate, this may have led to a loss of power. It would have also diluted potential associations if, in addition, PM2.5 was higher among non-participants. Further, the use of self-reported data on depression may have led to underdiagnosis/overdiagnosis. This may have led to some loss of statistical power. However, it is unlikely that the misclassification would be linked to PM2.5 exposure and thus bias the results of the study.
What is already known on this subject
Previous studies have shown inconsistent results on the association between long-term exposure to ambient fine particulate matter (PM2.5; aerodynamic diameter below 2.5 µm) and depression.
No epidemiological evidence exists for different sources of PM2.5 such as road traffic and residential wood combustion.
What this study adds
We evaluated whether long-term exposure to PM2.5 from road traffic or residential wood combustion is associated with the prevalence of depression in an urban area with fairly low air pollution concentrations.
We found no convincing evidence that long-term exposure to low levels of road traffic PM2.5 or residential wood combustion PM2.5 would be associated with the prevalence of depression; however, an effect could not be ruled out for traffic-related PM2.5, especially among non-smokers.
Data availability statement
Data are available upon reasonable request. Health data are not available due to confidentiality issues. Reuse of the concentration and meteorological data is permitted upon request, without limitations. Contact: Professor Jaakko Kukkonen, Finnish Meteorological Institute, Erik Palmenin aukio 1, PO Box 503, FI-00101 Helsinki (email: jaakko.kukkonen@fmi.fi, ORCID identifier https://orcid.org/0000-0002-5943-7069).
Ethics statements
Patient consent for publication
Ethics approval
According to Finnish legislation, no ethical permission is needed for a questionnaire which only includes adults.
Acknowledgments
The Academy of Finland funding for the project ‘Global health risks related to atmospheric composition and weather (GLORIA)’ is acknowledged. We thank Mr Kari Riikonen for processing the geographical concentration data.
References
Supplementary materials
Supplementary Data
This web only file has been produced by the BMJ Publishing Group from an electronic file supplied by the author(s) and has not been edited for content.
Footnotes
Contributors SA wrote the manuscript and analysed the data. TY-T, JK, LK, MK and MA produced the exposure data. PT designed the questionnaire and supervised the data analyses. AWT designed the questionnaire. TS and TN interpreted the results. TL designed the study and the questionnaire, drafted the analysis plan, and supervised the work. He is the guarantor. All authors revised the draft and approved the manuscript before submission.
Funding SA received a doctoral research grant from the Finnish Cultural Foundation – North Savo Regional Fund, and additional intramural funding from the University of Eastern Finland.
Map disclaimer The depiction of boundaries on this map does not imply the expression of any opinion whatsoever on the part of BMJ (or any member of its group) concerning the legal status of any country, territory, jurisdiction or area or of its authorities. This map is provided without any warranty of any kind, either express or implied.
Competing interests None declared.
Provenance and peer review Not commissioned; externally peer reviewed.
Supplemental material This content has been supplied by the author(s). It has not been vetted by BMJ Publishing Group Limited (BMJ) and may not have been peer-reviewed. Any opinions or recommendations discussed are solely those of the author(s) and are not endorsed by BMJ. BMJ disclaims all liability and responsibility arising from any reliance placed on the content. Where the content includes any translated material, BMJ does not warrant the accuracy and reliability of the translations (including but not limited to local regulations, clinical guidelines, terminology, drug names and drug dosages), and is not responsible for any error and/or omissions arising from translation and adaptation or otherwise.