Article Text

Abstract
Background Prior studies on spatial inequalities in mortality in Russia were restricted to the highest level of administrative division, ignoring variations within the regions. Using mortality data for 2239 districts, this study is the first analysis to capture the scale of the mortality divide at a more detailed level.
Methods Age-standardised death rates are calculated using aggregated deaths for 2008–2012 and population exposures from the 2010 census. Inequality indices and decomposition are applied to quantify both the total mortality disparities across the districts and the contributions of the variations between and within regions.
Results Regional variations in mortality mask one-third (males) and one-half (females) of the inequalities observed at the district level. A comparison of the 5% of individuals residing in the districts with the highest and the lowest mortality shows a gap of 15.5 years for males and 10.3 years for females. The lowest life expectancy levels are in the shrinking areas of the Far East and Northwest of Russia. The highest life expectancy clusters are in the intercity districts of Moscow and Saint Petersburg, and in several science cities. Life expectancy in these best-practice districts is close to the national averages of Poland and Estonia, but is still substantially below the averages in Western countries.
Conclusion The large between-regional and within-regional disparities suggest that national-level mortality could be lowered if these disparities are reduced by improving health in the laggard areas. This can be achieved by introducing policies that promote health convergence both within and between the Russian regions.
- health inequalities
- mortality
- spatial analysis
This is an open access article distributed in accordance with the Creative Commons Attribution Non Commercial (CC BY-NC 4.0) license, which permits others to distribute, remix, adapt, build upon this work non-commercially, and license their derivative works on different terms, provided the original work is properly cited, appropriate credit is given, any changes made indicated, and the use is non-commercial. See: http://creativecommons.org/licenses/by-nc/4.0/.
Statistics from Altmetric.com
Introduction
Concerns have been raised about the persisting or even increasing health inequalities between and within countries.1 2 Although a large body of research has examined socioeconomic disparities in mortality and health, the spatial dimensions of these trends are of equal importance. A number of ecological studies have explored the geographical patterns and variations in total and cause-specific mortality at different geographical levels. Most of these studies relied on the data aggregated to the highest administrative division within a country, which inevitably led them to ignore important disparities at the next spatial scale. More comprehensive studies on health inequalities that are based on data for smaller geographical units, or that use a multilevel approach (ie, that simultaneously analyse area-level and individual-level variables), have emerged relatively recently.3
Several novel studies on long-term trends in mortality across small areas in the UK, the USA and New Zealand have provided evidence of persisting or even increasing geographical disparities in these countries. An examination of long time series (1921–2007) in the UK found that the increasing trend in spatial mortality inequalities accelerated in the 2000s, reaching the highest levels since those recorded in the early 1920s.4 In New Zealand, geographical disparities in health had also reached historically high levels by the beginning of the 2000s.5 A study on cross-county mortality disparities in the USA (1961–1999) found a similar upsurge in geographical disparities between 1983 and 1999, mainly due to stagnating or increasing mortality in the laggard populations.6 This evidence suggests that in recent years, overall life expectancy improvements at the national level have been masking growing spatial mortality disparities within countries.
Although it has made significant progress in reducing mortality since the mid-2000s, Russia continues to have one of the lowest life expectancy levels across the developed countries.7 8 Underlying the overall life expectancy disadvantage in Russia is substantial diversity in the social, economic, ecological and other characteristics of different regions.9 10 Prior studies using regional mortality data—that is, at the highest level of administrative division—collected around the 1970 and 1979 censuses detected a pronounced southwest-to-northeast geographical mortality gradient.11 12 Later studies showed that this gradient could be largely explained by mortality variations from external and alcohol-related causes of death at the middle ages.10 13 Gorbachev’s antialcohol campaign of the late 1980s weakened the gradient, and caused the inter-regional disparities in Russia to fall to their lowest recorded levels.14 However, as the radical socioeconomic changes of the 1990s had selective effects on population health across the regions of Russia, the country’s inter-regional disparities increased, and its regional mortality pattern changed.15–18 The evidence obtained for the recent period of health improvements in Russia (from 2003 onward) shows very small changes in the aggregated measure of inequality, which can be attributed to the diverse effects of mortality convergence at young and middle ages, and of mortality divergence at older ages. Moscow and Saint Petersburg are currently pioneering mortality improvements in Russia, and contribute more than other districts to the inter-regional divergence at older ages.14
One of the major disadvantages of all prior studies on spatial health inequalities in Russia is that the data they used were from the highest level of administrative division, and thus masked large disparities within these territories. This study represents the first comprehensive mortality analysis conducted across Russia’s municipal units with the aim of understanding the real scale and the spatial mortality disparities.
Data and methods
District-level data
We performed our analysis based on data for 2239 districts aggregated into 77 regions representing the top level of administrative division in Russia (see online supplementary appendix for more information on the definition of districts). We excluded 130 districts because there were problems with the numerator-denominator data linkage, or because the districts had a very small population size (<1000 males and/or females) or were in the North Caucasus region. As the mortality estimates for the Caucasus republics display dubious patterns, especially at old ages, scholars have expressed concerns about their validity.19 The total excluded population made up 4.9% of the total population.
Supplemental material
The data on deaths classified by sex, age and district for 2008–2012 were obtained by aggregating anonymous vital registration records provided by the Russian State Statistical Service (Rosstat). The population counts came from the 2010 population census. The data on district-level deaths have never been published, and are used in this study for the first time.
Methods
We calculated the sex-specific age-standardised death rates (SDRs) for each district and region. To ensure that our results are comparable to the findings from the other countries, we applied direct standardisation using the 1976 WHO European standard population.20 To account for random annual fluctuations due to the small numbers, we aggregated deaths over a 5-year period around the 2010 census.
Several absolute and relative measures of inequality were tested: namely, conventional statistical indices (maximum–minimum range and ratio, standard deviation (SD) and inter-quartile range (IQR)) and regression-based measures (slope index of inequality (SII) and relative index of inequality (RII)).21 22 Using the decomposition technique, we split the total variance in mortality across districts into between-region and within-region partitions.23
We ranked all the districts by SDRs and assigned them to eight groups defined by population percentiles: four groups representing 5% on the tails of the ranking, and four groups in-between representing 20% of the total population each. We then calculated the sex-specific life expectancies for each of these groups.
Results
Magnitude of spatial mortality inequalities at the two levels of geographical division
Table 1 provides several major relative and absolute measures of inequality in sex-specific, SDRs across the districts and regions of Russia. As expected, we find that the mortality disparities at the municipal level are greater than those at the regional level for both males and females. The absolute gap in the SDR between the best-performing and the worst-performing district is about 2.5 times bigger than the corresponding difference between the best-performing and the worst-performing region. Although analyses of more advanced measures of inequality (IQR, weighted SD, SII or RII) come to the same overall conclusion, the differences in inequality levels they found between districts and regions are smaller, at 1.3 to 1.7-fold, depending on the measure. The magnitude of the absolute spatial disparities is larger for males, whereas the relative inequalities are about the same for males and females at each level of the geographical hierarchy.
Selected measures of mortality disparities across regions (n=77) and districts (n=2239), by sex (average for 2008–2012)
Decomposition analysis allows us to quantify the share of cross-district variations in mortality that cannot be explained by the differentials observed across the regions. Of the total interdistrict inequalities in mortality, around one-third for males and almost one-half for females are due to mortality variations within the regions.
Ranking and grouping the districts by SDRs
Summary statistics for the eight groups of districts or clusters arranged from the districts in our data (see the Methods section above) are presented in table 2. The most important finding is that the two best-performing groups, constituting 10% of the total population, are living in only 29 districts; while the corresponding two worst-off groups are living in around 360 districts (355 for males and 376 for females). Many of the districts with extremely high mortality are very large in terms of land area, and most have very small populations.
Definition and major characteristics of the eight groups of districts (average for 2008–2012)
Figure 1 displays a very steep mortality gradient across both the districts and the eight groups of districts. It shows that a substantial share of the total population is living in settings with exceptionally high mortality: compared with the mortality levels in the most advanced districts (group VIII vs group I), the mortality levels in these districts are 2.5 times higher for males and 2.0 times higher for females (table 2). Another important observation is that the gender gap increases significantly from the best-performing to the worst-performing districts, which suggests a much steeper mortality gradient for males than for females. The sex-specific rate ratio increases from 1.7 to 2.1 from the best-off to the worst-off groups.

Age-standardised death rates (SDRs) in districts and eight groups of districts, by sex, average for 2008–2012.
Spatial patterns in mortality
Figure 2 provides evidence on mortality disparities by highlighting the exact geographical locations and spatial clustering of the districts assigned to each of the eight groups. A visual inspection of the map allows us to identify hot spots of elevated and low mortality in space, and to see whether the spatial clusters coincided with or crossed the regional borders.
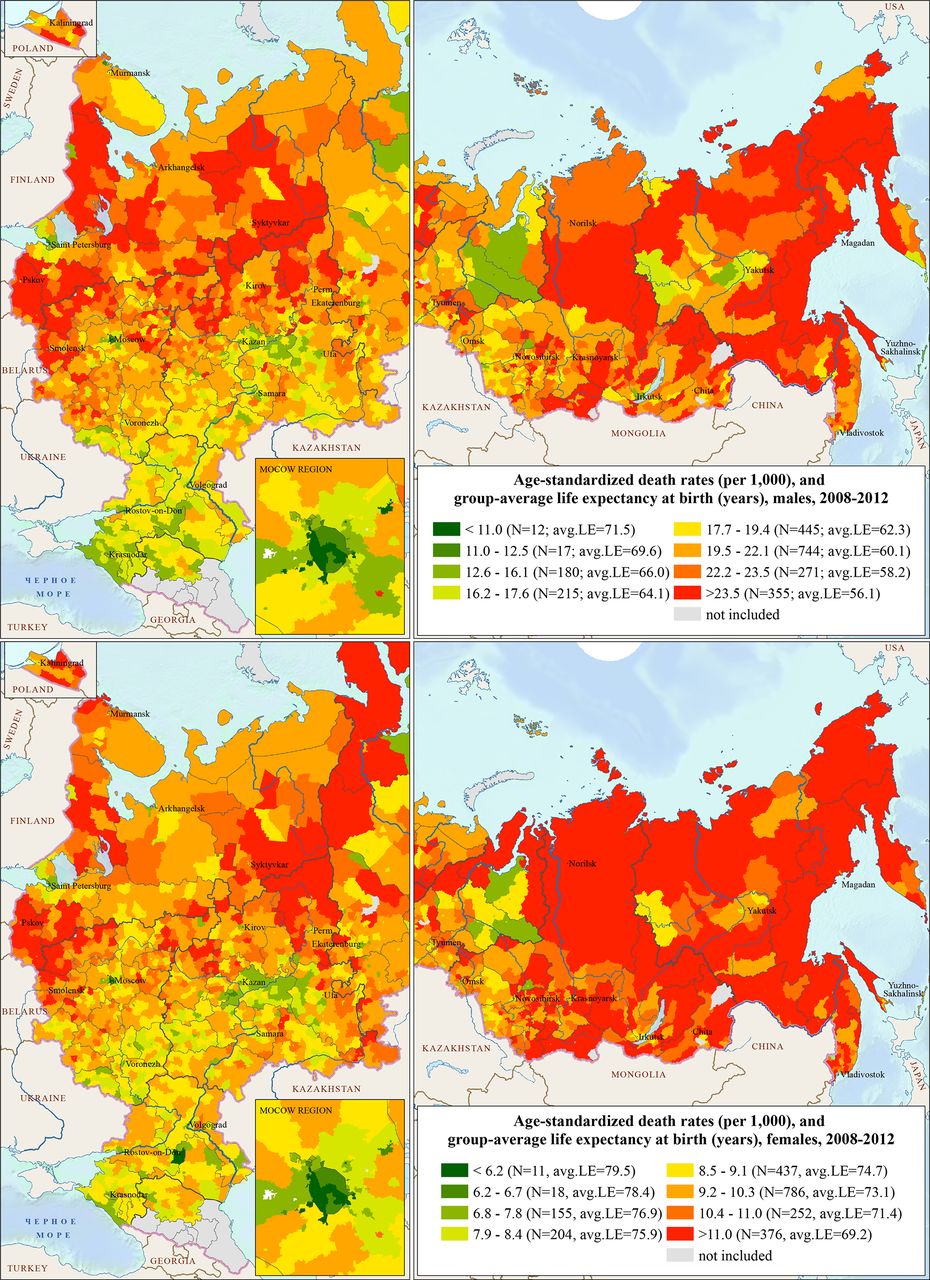
Geographical patterns of mortality in Russia, average for 2008–2012 (males—upper panel, females—lower panel). LE, life expectancy.
In general, the existence of a geographical gradient of increasing mortality from the southwest to the northeast, previously detected by Andreev11 and Shkolnikov,12 is confirmed using the district-level data. However, this type of data gives us the opportunity to track the spatial changes with a clearer microscopic view. The largest (in terms of land area) territories of low mortality are located in the southern part of European Russia, and in the neighbouring Central Black Earth region. Other low-mortality areas are more compact in size, including the districts of the Republic of Tatarstan in the Volga region, the majority of the intercity districts in the metropolitan areas of Moscow and Saint Petersburg, and the districts in some oil-drilling and gas-mining areas in West Siberia. Among the other best-practice districts in Russia are the so-called ‘science’ cities and cities with a special regime (often related to the defense/applied industry). Moreover, in the south of the European part of Russia, resort cities and towns with even lower mortality levels can be distinguished.
By contrast, a huge belt of very high mortality levels can be detected in the Far East and East Siberia. These are mostly depopulating areas with very severe environmental conditions. The settlements in these areas are usually located very far from the main cities, where the country’s human and economic resources tend to accumulate. Moreover, the Far East and East Siberia are the main regions where the indigenous northern populations, who have long had extremely high levels of adult mortality, live.24 Another cluster of elevated mortality consists of economically disadvantaged areas of the Northwest of European Russia, located between Moscow, Saint Petersburg, and the bordering Baltic countries and Finland. Deindustrialised urban and rural districts in the European North form the third-most important cluster of high mortality.
It is quite surprising that no big differences between males and females can be seen in these geographical patterns. Male and female mortalities across the districts show high and statistically significant levels of correlation, with Pearson’s coefficient equal to 0.79 (p<0.001).
Comparisons of clusters to national averages in other countries
Figure 3, which was produced in a manner similar to that of figure 1, compares the inequalities in sex-specific life expectancies for the same eight groups of Russian districts with the national estimates for Russia as a whole and selected developed and developing countries. The figure shows the best, the average and the lowest life expectancy levels.25 26 These results clearly illustrate the striking life expectancy divide between the best-performing and the worst-performing groups of districts in Russia. Even at this aggregated level, the life expectancy gap ranges from 10.3 years for females to 15.5 years for males. Interestingly, the life expectancy of the worst-off females is almost equal to that of the best-off males.

Life expectancy at birth in eight groups of Russian districts and in selected countries, by sex. Source: table 2 for Russia as a whole and eight groups of districts (average for 2008-2012); UN world population prospects, the 2019 revision for india and south africa (estimates for 2010-2015); human mortality database for other countries (estimates for 2010).
The international comparison confirms that Russia occupies an unfavourable position, as even the best-performing districts in Russia have substantial life expectancy disadvantages relative to the life expectancy levels observed in Western Europe, Japan, and the US. However, these best-practice districts in Russia have life expectancy levels that are similar to the national averages in the best-performing countries in Central and Eastern Europe (Poland, Estonia, Lithuania and Latvia). At the same time, the males and females in the worst-performing districts have extremely large disadvantages with the life expectancy levels close to those in South Africa and India (females), respectively.
Discussion
Summary of the main findings
Our analysis using district-level mortality data provides new evidence of the strikingly large size of the geographical mortality divide in Russia. We have shown that the previous studies on this topic, which relied on data for the highest level of administrative division in Russia, tended to mask important variations in mortality within the regions. Depending on the metrics of mortality disparity applied, the cross-district mortality inequalities were found to be 1.3–2.6 times larger than the cross-regional mortality inequalities. Of the total cross-district variance in mortality, the inter-regional variation explained only one-third for males and one-half for females. Even more striking is the finding that there was a huge life expectancy divide (almost 16 years for males and more than 10 years for females) between the best-performing and the worst-performing groups of districts, each of which accounted for 5% of the total population. The results clearly show that the disproportionately low life expectancy levels observed in the worst-performing groups of districts were comparable to or even worse than the levels in some developing countries, such as India or South Africa; and can be considered largely responsible for the persisting overall life expectancy disadvantage of Russia in the international context. The findings also indicate that Russia’s longevity vanguards, who live primarily in Moscow, Saint Petersburg and some other cities, had life expectancy levels similar to the levels observed in successful Central and Eastern European countries, such as Poland and Estonia. Nonetheless, given the economic wealth of Russia, and of its metropolitan cities in particular, the expected length of life in the country could be substantially higher.27
Interpretation
The current study has provided only indirect evidence regarding the mechanisms that underlie the small-area health disparities we observed in Russia. The persisting disparities found across the districts suggest that the public health losses in some of these areas are avoidable, and should be addressed through appropriate policies aimed at promoting the convergence of the economic, social, and health conditions within the regions of Russia. Such policies can be planned and implemented by central and local governments, and should be based on reliable population-level evidence and data collected through timely monitoring. Achieving further sustained reductions in excess mortality and significant longevity gains at the national level in Russia will be very difficult if the existing cross-district mortality disparities remain at the same level or increase.
The previous findings on this topic suggest that regional mortality inequalities in Russia were increasing through the end of the 2000s, when they reached their peak levels. Since then, these inequalities have remained at the same level or have even slightly increased.14 It is, therefore, very likely that that there has also been a lack of progress in reducing mortality inequalities across the districts. This can be seen as a worrying sign, as it suggests that the marked improvements in life expectancy recently observed at the national level have been spread very unevenly across the regions and districts. Several observations can be made about the regions with particularly large cross-district inequalities in mortality. In all of these regions, the mortality levels in the peripheral areas were found to be 1.7–3.0 times higher than the mortality levels in the administrative centres (cities). This finding supports the idea that there is a strong polarisation between the healthier and wealthier ‘core’ and the ailing and impoverished ‘periphery’.28 29 Our results are further supported by the findings of another important study for Russia, which showed that life expectancy differences have been increasing between the largest cities (with a population of more than one million people, n=13) and the rest of the country.30
The advantages of the populations of the largest cities relative the populations living in the rest of the country can be explained by several fundamental compositional factors. Compared with their counterparts living elsewhere, these urban residents have better education, lower unemployment, higher income and better access to healthcare services.31–34 Other best-practice districts in Russia found to have very high life expectancy levels are science cities and cities with a special regime (often related to the defense/applied industries). The people living in these settlements can be considered an ‘urban elite,’ as they have high concentrations of intellectual, scientific, and technical skill levels, and often enjoy economic and administrative privileges.35 36
To ensure the sustainable spatial development of Russia and to reduce the inter-regional and within-regional differences in socioeconomic development levels, the Russian government has launched a project called the ‘Spatial Development Strategy until 2025’.37 Among the main principles of this initiative is to increase access to social and healthcare services for populations living in different geographical areas. The national project ‘Healthcare’, which has been allotted an additional budget of around US$25 billion for 2019–2024, also aims to improve the health of the Russian people by ensuring that they have optimal access to healthcare services and adequate healthcare resources.38
Strengths and limitations
To the best of our knowledge, this study is the first systematic analysis of the geographical mortality inequalities conducted at such a detailed level of administrative division. Our study has shed light on the real scale and the demographic costs of the spatial mortality disparities in 2239 districts across 77 regions of Russia. By offering some broad initial insights into the small-area geographical mortality inequalities in Russia, our findings provide useful directions for future research on the changes in and the determinants of mortality inequalities in this vast and geographically diverse country.
This study inevitably has a number of limitations. An important limitation is that we were unable to explore the temporal changes in spatial inequalities because age-specific data are not routinely collected and published at the district level. Technically, deaths can be tabulated by district only from 2000 onwards, when the electronic system of vital registration was first introduced in Russia. Moreover, the intercensus estimates of the population age structure in the small areas seem to be rather inconsistent, mainly due to the difficulties involved in accounting for migration. Another important point is that the definition of what constitues a district has changed several times, which makes conducting comparable long-term analysis of trends in health disparities almost impossible.
What is already known on this subject
Based on the data at the highest (ie, regional) level of administrative division, there is evidence of a persisting ‘Southwest to Northeast’ mortality gradient in Russia.
Regional mortality inequalities had reached their highest levels by the mid-2000s.
Moscow and Saint Petersburg are currently pioneering mortality improvements in Russia. Because of their rapid progress in reducing mortality at older ages, these cities are contributing more than other territories to the inter-regional mortality disparities in Russia.
What this study adds
Analysing mortality data at the level of larger administrative areas (regions) leads to a substantial underestimation of the full extent of the mortality inequalities in Russia.
This study has found a marked life expectancy divide between the best-performing and the worst-performing groups of districts. The findings indicate that the disproportionately low life expectancy levels in the worst-off groups of districts are responsible for Russia’s persisting overall disadvantage in an international context, while the relatively high life expectancy levels in the best-practice districts suggest that there is a huge potential for further reducing excess mortality at the national level.
The largest share of the spatial inequalities within the regions is usually determined by a strong polarisation of life expectancy levels between the administrative centres of the districts (‘cores’) and the remaining peripheral areas.
This study points to the failures of previous policies to ensure sustainable and equitable socioeconomic and health progress across and within the regions of Russia. At the same time, the results clearly show that district-level mortality can be used for monitoring and addressing public health issues at the national and the local level.
Acknowledgments
We thank Svetlana Nikitina from the Russian State Statistical Service (Rosstat) for providing the microdata on all deaths that occurred between 1 January 2008 and 31 December 2012.
Footnotes
Contributors ST, VS and DJ conceived the research question and designed the study. ST and EA collected the mortality data. ST conducted the statistical analysis, interpreted the results and wrote the first and subsequent drafts of the manuscript. ST, DJ and VS contributed to the interpretation of the data and to revisions of the manuscript. All authors approved the final version of the submitted manuscript.
Funding The paper was prepared within the framework of the Basic Research Program at HSE University, and was funded by the Russian Academic Excellence Project '5-100'. The work of ST on GIS mapping was partly supported by the Russian Foundation for Basic Research (research project no 18-05-60037).
Competing interests None declared.
Patient consent for publication Not required.
Provenance and peer review Not commissioned; internally peer reviewed.
Data availability statement Data can be obtained upon reasonable request.