Article Text

Abstract
Background Internationally, the prevalence of adults with obesity is a major public health concern. Few studies investigate the explanatory pathways between fast-food outlets and body mass index (BMI). We use structural equation modelling to explore an alternative hypothesis to existing research using area-level deprivation as the predictor of BMI and fast-food outlets and diet quality as mediators.
Methods Adults (n=7544) from wave II of the Yorkshire Health Study provided self-reported diet, height and weight (used to calculate BMI). Diet quality was based on sugary drinks, wholemeal (wholegrain) bread and portions of fruit and vegetables. Fast-food outlets were mapped using the Ordnance Survey Points of Interest within 2 km radial buffers around home postcode which were summed to indicate availability. Age (years), gender (female/male) and long-standing health conditions (yes/no) were included as covariates.
Results There was little evidence linking fast-food outlets to diet or BMI. An independent association between fast-food outlet availability and BMI operated counterintuitively and was small in effect. There was also little evidence of mediation between fast-food outlet availability and BMI. However, there was more evidence that area-level deprivation was associated with increased BMI, both as an independent effect and through poorer diet quality.
Conclusion This exploratory study offers a first step for considering complexity and pathways linking fast-food outlets, area-level deprivation, diet quality and BMI. Research should respond to and build on the hypothesised pathways and our simple framework presented within our study.
- obesity
- health inequalities
- preventive medicine
Statistics from Altmetric.com
Introduction
Globally, existing approaches for reducing the prevalence of adults with obesity have only resulted in modest improvements suggesting an incomplete understanding of the mechanisms.1 Internationally, fast-food outlets have received substantial attention as they sell cheap, energy-dense and nutritionally poor foods which contribute to increases in body mass index (BMI). Within England for instance, Public Health guidelines suggest that local planning authorities can use their responsibilities to address local health needs. Restrictions have been applied to approving planning applications for new fast-food outlets in areas with a high density of existing fast-food outlets.2 The decision to target fast-food outlets is supported by evidence showing associations between fast-food outlets and BMI. However, the majority of evidence has demonstrated a lack of, or even counterintuitive associations.1 3 4 A plethora of issues may affect evidential consistency,5 however these inconsistencies may exist due to a lack of evidence exploring potential pathways through which fast-food outlets and BMI may be interlinked.
A focus on only fast-food outlets ignores the broader social context in which they operate. For instance, fast-food outlets are more commonly located in deprived areas.6 7 While literature from other developed nations outside the USA is much less consistent with respect to other food retail outlets,8 the impact of fast-food outlets may be more strongly felt in deprived areas. Obesity and diet quality are independently associated with social disadvantage.9 10 Separating out the independent effects of social disadvantage from fast-food outlets is therefore difficult. However, most, if not all, of the current evidence exploring these issues is based on methods like linear regression. While acceptable, they do not specify how different variables may operate.11 Using techniques such as structural equation modelling (SEM) may therefore help outline how fast-food outlets, area-level deprivation, diet quality and BMI are interlinked.12 13
Following a scoping review of the literature, most research in this area conceptualised fast-food outlets as an exposure or predictor, BMI as the outcome and controlled for area-level deprivation. Despite this, evidence was largely inconsistent.1 Area-level deprivation was more consistently linked to fast-food outlets, diet and BMI.1 7 14 We therefore provide an alternative hypothesis to much existing research that area-level deprivation (predictor) is associated with BMI (outcome) through fast-food outlets (mediator 1) and diet quality (mediator 2). We test two simple frameworks to delineate these associations. First, we investigate associations based on all pathways in figure 1 based on both consistent and inconsistent evidence.1 Second, we include only those pathways with more consistent evidence identified in prior literature. Importantly, this study is exploratory in nature, however it serves as a starting point to explore complexity from which other research can build on and refine the simple framework presented here.
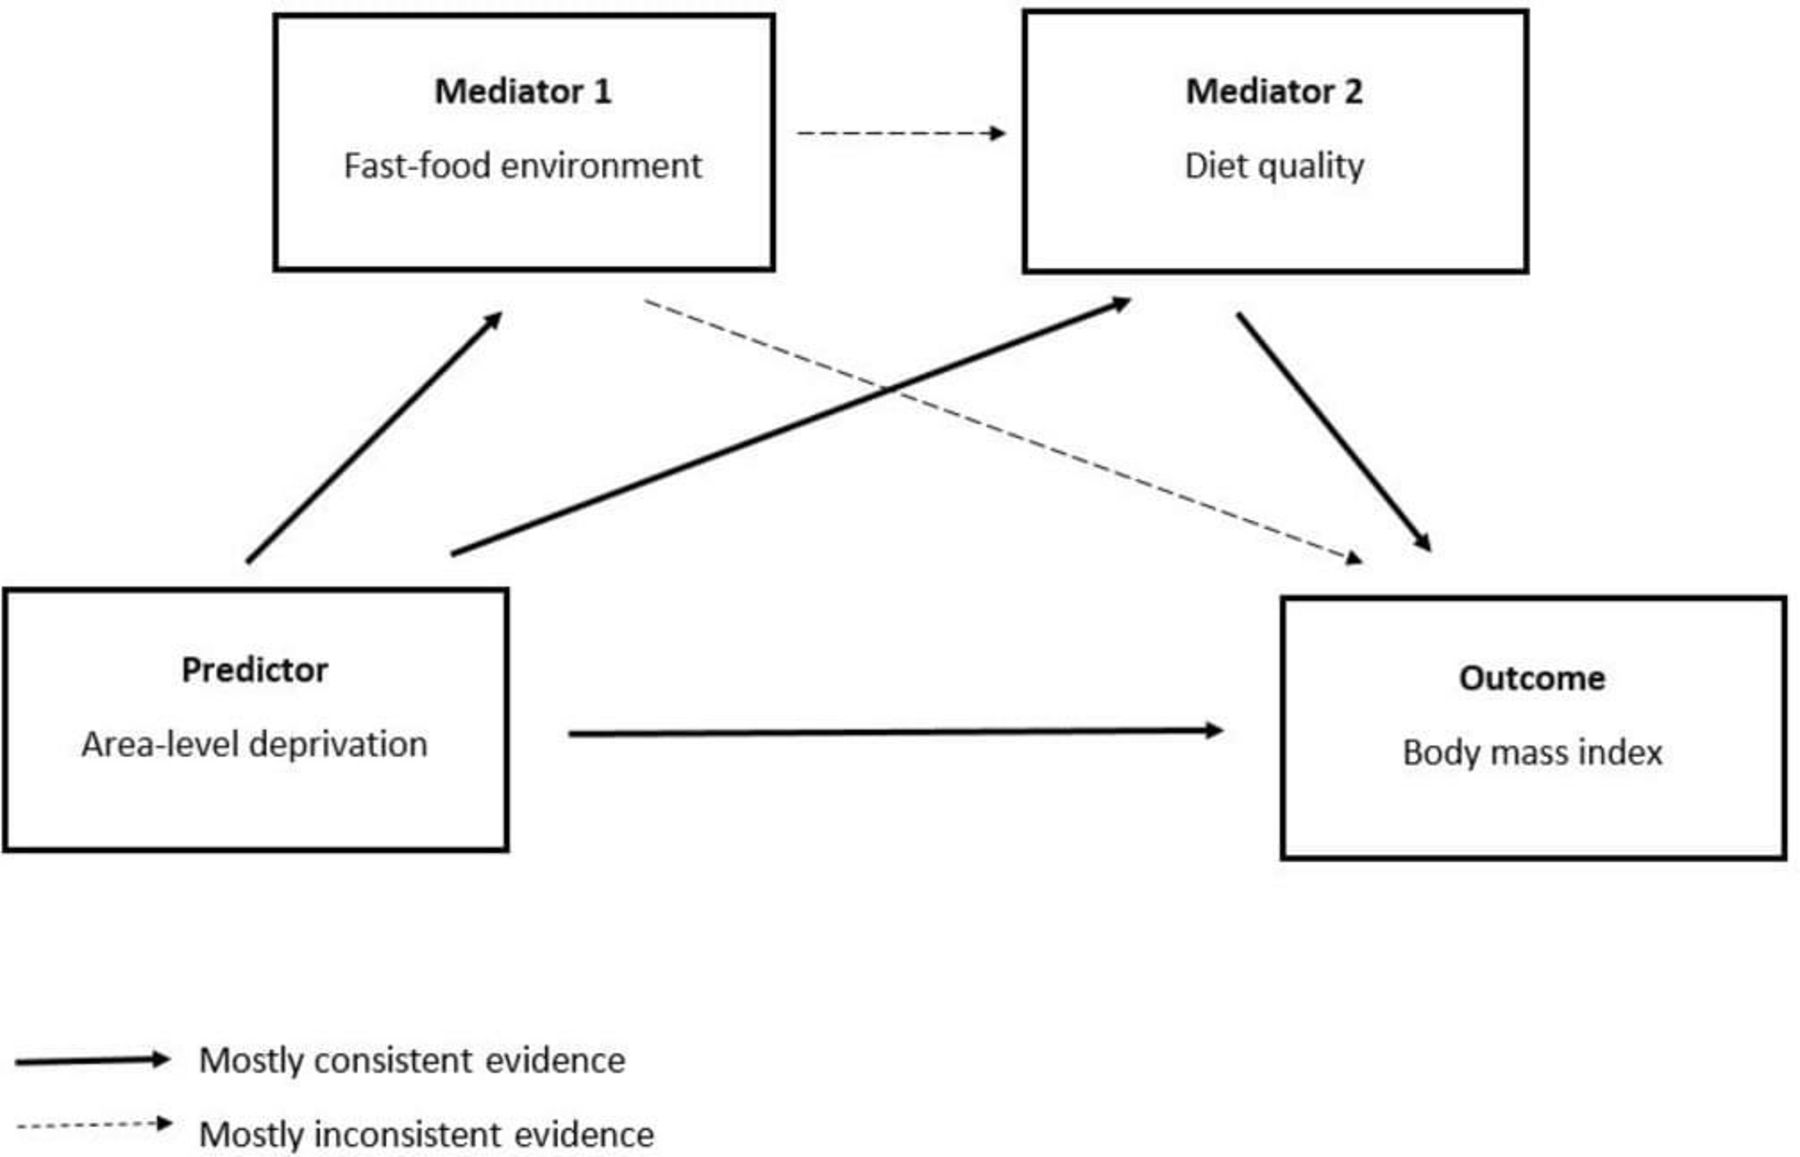
The simple framework outlining potential associations between area-level deprivation, fast-food outlets, diet quality and body mass index (BMI) and consistency of evidence.
Methods
Participants and settings
Cross-sectional survey data collected by questionnaire from wave II (2013–2015) of the Yorkshire Health Study (YHS) were used. The YHS is a longitudinal observational regional health study collecting health information on the residents from the Yorkshire and Humberside region in England.15 Data were collected on current and long-standing health, healthcare usage and health-related behaviours, with a focus on weight and weight management. While the data are self-reported, we selected the YHS since very few alternative data sources included measures for both diet behaviours and BMI that were spatially referenced by postcode (in the UK, postcodes contain around 15 addresses). A two-stage approach was used for the initial data collection. First, general practitioner surgeries were invited to participate in the study (43 agreed: 50% acceptance). Compared with the 2011 census for the total South Yorkshire population, participants over-represented people who were older, of white ethnicity and female.15 Total sample size was 11 164 adults (aged 18–86 at baseline) living within the study area. We included all individuals with a valid height, weight, postcode, ethnicity, gender, long-standing health conditions and diet quality measures. This resulted in an analytical sample of 7554 participants (see online supplementary figure S2.1 for flow of participants).
Supplemental material
Outcome variable: BMI
Self-reported BMI was calculated as weight (kg) divided by height-squared (m2). While it is an imperfect measure of excess body weight and obesity, the measure does hold some validity and is also important for policy decisions.16
Measure of fast-food environment
Environmental data were provided by Ordnance Survey, a national mapping agency for the UK. The data set (Points of Interest (PoI), 2013) included information on the locations of all commercial facilities in the UK. It provided food outlet locations (easting and northings). Food outlets were categorised into fast-food outlets (n=6259) containing the PoI categories of ‘fast-food and takeaway outlets’, ‘fast-food delivery services’ and ‘fish and chip shops’.
We created a radial buffer of 2 km centred on an individual’s home postcode to represent their exposure to features of the food environment. Although we acknowledge that individuals are known to operate outside a radial buffer, previous research shows little variation in outcomes by different neighbourhood definitions.17 Furthermore, when previously using 1600 m radial buffers which are hypothesised to better reflect walking behaviours18 few differences in associations were seen.17 Food outlets within each 2 km buffer were counted using a point in polygon analysis using ArcGIS V.10.2.2 (ESRI, Redlands, CA) and summed using a spatial join between food outlet layers and each individual’s 2000 m radial buffer. Sensitivity analyses were undertaken for 1600 m radial buffers in this study.
Diet
Four diet variables on the consumption of sugary drinks, wholemeal (wholegrain) bread, portions of fruit and portions of vegetables were used to provide a proxy measure of diet quality. These indicators have been shown to be moderately predictive of a Nutrient-based Diet Quality Score (NDQS) based on adherence to UK Diet Reference Values and government recommendations for consumption of 12 key nutrients and alcohol.19 20 Consumption of sugary drinks and wholemeal (wholegrain) bread was collected as five ordinal categories: (1) never/occasionally, (2) one to three times a week, (3) four to six times a week, (4) daily, and (5) more than once a day. Consumption of portions of fruit and vegetables was collected as servings per ‘typical’ day, however these were also split into ordinal outcomes in order to allow for a comparison with the former to categories. These four variables were then added together to provide a score out of 20. Sugary drinks were reverse coded as they were associated negatively with diet quality (online supplementary table S1).
Area-level deprivation
We used the Index of Multiple Deprivation (IMD) 2010 as a measure of area-level deprivation as it provides a multidimensional measure of deprivation and is commonly used by local governments. Neighbourhood deprivation has been shown to be associated both to BMI and the food environment; particularly fast-food outlets.1 7 IMD is measured at the Lower Super Output Area (LSOA) level. An LSOA is a geographical area that typically contains a minimum population of 1000 and a mean of 1500.
Covariates
We controlled for individual-level factors that may explain an individual’s BMI. Non-modifiable personal characteristics of age and gender (male or female) were each included since they each display associations to BMI. Whether an individual had a long-standing health condition or not was also included since health status is associated with BMI.21 As described previously in detail,15 long-standing health conditions included, but were not limited to, cancer, heart disease, stroke, high blood pressure, depression and diabetes. Ethnicity was not included as a covariate due to the low number of individuals classified as non-white.
Statistical analysis
SEM was used to test our proposed conceptual frameworks. SEM includes a series of multivariate approaches including factor analysis, regression and path models. An exploratory approach is conducted to analyse their structural associations based on two frameworks: the first framework using pathways with both consistent and inconsistent evidence and the second using pathways based on only consistent evidence. Within the SEM covariates were included to adjust for their effects directly impacting on BMI and are reported in full in the online supplementary material. We report several measures estimating the goodness of fit of the model including the comparative fit index (CFI), root mean square error of approximation (RMSEA) and a χ2 test. An RMSEA value of <0.05 indicates good fit, <0.08 indicates acceptable fit, while 0.08–0.10 is stated as neither good nor bad.22 A good fit for CFI relates to a value greater than 0.95 while >0.90 indicates a satisfactory fit.22 Due to the high statistical power in the data set and assumption that data were missing at random (online supplementary table S3.1) missing data were dealt with by listwise deletion. All analyses were undertaken using STATA MP V.14.2.
Results
Sample characteristics
Descriptive statistics (n=7544) are shown in table 1. Mean BMI was 26.33 (SD=4.73) and 17.9% of individuals were obese (BMI ≥30). Individuals were exposed to a median of five fast-food outlets.
Overall sample and environmental (% (n)) characteristics (n=7544; n=3136 male)
Associations between area-level deprivation, fast-food outlets, diet quality and BMI
The first SEM includes pathways with both consistent and inconsistent evidence (figure 2). Goodness of fit statistics indicate that the framework has a relatively poor model fit (RMSEA=0.12; CFI=0.55). Count of fast-food outlets was independently but counterintuitively associated with BMI and was small in effect (b=−0.03 [−0.04, –0.02]). Fast-food outlets were not associated with diet quality (b=0.00 [−0.01, 0.01]). However, area-level deprivation was associated with fast-food outlet count (b=0.10 [0.08, 0.11]), diet quality (b=−0.02 [−0.02, –0.01]) and BMI (b=0.05 [0.04, 0.05]) in the expected direction. Diet quality was associated with BMI (b=−0.20 [−0.25, –0.14]). Full indirect and direct effects are included in the online supplementary tables S4.7–S4.9. The results from figure 2 should be interpreted with caution, however effects were similar to those in figure 3 which exhibited a better model fit.

Results from a structural equation model based on both inconsistent and consistent evidence, assessing the association between fast-food outlets, diet quality, area-level deprivation and body mass index. CFI, comparative fit index; RMSEA, root mean square error of approximation.

Results from a structural equation model based on only consistent evidence, assessing the association between fast-food outlets, diet quality, area-level deprivation and body mass index. CFI, comparative fit index; RMSEA, root mean square error of approximation.
Our second framework (figure 3) includes only those pathways with more consistent evidence. Goodness of fit statistics indicated CFI fit was satisfactory (CFI=0.905) and RMSEA was acceptable (RMSEA=0.059). Increased area-level deprivation was associated with increased BMI (b=0.05 [0.04, 0.06]), lower diet quality (b=−0.02 [−0.02, –0.01]) and increased fast-food outlets (b=0.10 [0.08, 0.11]), and diet quality was associated with BMI (b=−0.16 [−0.21, –0.11]). Models adjusted for age, gender and long-standing health conditions and are shown in full in online supplementary tables S4.10–S4.12.
Two sensitivity analyses are shown in online supplementary tables S4.1–S4.6. The first with fast-food outlets as the predictor, BMI as the outcome and diet quality as the mediator; few associations were present. The second sensitivity analyses showed area-level deprivation as the predictor, BMI as the outcome and fast-food outlets as the mediator. Models adjusted for age, gender and long-standing health conditions. A further sensitivity analysis on the effect of different buffer sizes for measuring fast-food outlets also revealed consistent findings (online supplementary tables S4.13-S4.15).
Discussion
Our study uses a large cohort of UK adults to explore two simple frameworks, based on previous evidence1 7 10 that relates area-level deprivation, fast-food outlets, diet quality and BMI. Our exploratory analysis revealed that the association between fast-food outlets and BMI was small and counterintuitive, and there was no mediation effect by diet quality. Our alternative explanation was thus confirmed as we found the strongest evidence for an association between area-level deprivation and increased BMI, both as an independent effect and through diet quality. While exploratory and cross sectional in design, our simple model offers an opportunity to reconsider or critically examine the pathways linking area-level deprivation, fast-food outlets, diet quality and BMI.
Our findings confirm existing inconsistencies linking geographical availability of fast-food outlets and BMI.1 Given that diet quality is the main hypothesised mediation mechanism, the lack of evidence for any association or mediation suggests that this pathway is perhaps misguided. Our study may lack power to detect such distal effects or unobserved effects or a suppressor variable could be operating.23 However, previous studies detecting associations may result from residual confounding through social disadvantage; these associations are consistent throughout the literature between location of fast-food outlets and deprivation6 and between deprivation and BMI.24 25 This suggests that focusing on the role of social disadvantage rather than the fast-food outlets may yield more effective policy gains. This has been reported previously in the USA,12 26 but requires further research to confirm such effects.
A notable difference in our study was examining pathways with area-level deprivation as a predictor not the food environment. Consistent with previous evidence,1 7 14 increased area-level deprivation was associated with higher fast-food outlet availability, lower diet quality and higher BMI. This provides insights into what the explanatory variables may be that link these often-intertwined measures and outcomes. While further research is needed to build on the hypothesised pathways presented within this study, we suggest that research may benefit by including area-level deprivation as the predictor of adults with obesity with fast-food outlets and dietary quality as a potential mediator—a mechanism by which area-level deprivation may operate.1 We do not intend these models to be the model, instead we hope that they are considered as a first step to building complexity in this area and at the very least, provoke increased criticality around how we define the pathways which link food environments, diet quality, social disadvantage and health.
Implications for policy and research
Our key result suggests that area-level deprivation is more strongly associated with BMI than fast-food outlets. This is particularly important given that socioeconomic inequalities in health continue to persist across generations despite policies being designed to reduce them.24 27 28 This may suggest that new policies such as those that focus on the most deprived in tandem with an environmental approach may be required.24 If policymakers are to continue to focus on the environment as a contributor to BMI, it may be important to consider the broader system within which these environments operate. BMI and diet behaviours are influenced by a complex set of inter-related psychological, social, economic, cultural and environmental factors,29 30 therefore future research will benefit by building on our findings to test more complex pathways that link food environments to BMI. Our study points to the potential of SEM as an analytical approach to be considered in future research.
Methodological considerations
Our study raises several methodological considerations. First, we acknowledge that our SEM is simplistic. This paper adds to the literature by examining specific pathways by which fast-food outlets are associated with BMI. We conducted this study as a useful first step for incorporating these approaches and building on current practice. However, our models may still be insufficient to explain the complexities of obesity. For example, our models only test one single pathway and measure of the food environment and do not include other factors such as perceptions of the environment. Furthermore, considering the broader food retail environment will be important. For instance, a recent review1 highlighted that relative measures were more likely to be associated with obesity in adults in the expected direction than with individual food outlet types. Furthermore, a recent multinational study from 60 neighbourhoods in urban regions of five different countries across Europe31 showed no association between objective measures of geographic availability of fast-food outlets and obesity, but did show associations with individual perceptions of the fast-food environment. To understand the association between the food environment and BMI or diet, both geographic (ie, physical availability) and economic availability (ie, price) measures of the food environment were required.32 33 Our study did not control for other covariates such as car ownership. We therefore aimed to keep the focus purely on associations between area-level deprivation, fast-food outlets, diet quality and BMI as a first step. We acknowledge that further study should now try to tease out the complexities which shape and modify these associations.30
It was plausible that results in this study were sensitive to the choice of buffer distance and/or the measure of diet quality. However, previous research using the study sample has shown few differences when using different buffer types and distances.17 Moreover, our sensitivity analyses (online supplement 4) showed similar associations when using different buffer sizes which are suggested to reflect walking behaviours in the UK. Although buffers were based on the best available evidence, how to define a neighbourhood remains a limitation across the evidence base as it is known individuals may operate beyond a radial buffer, a concept known as the uncertain geographical problem which has been discussed by Kwan extensively.34 Future research may consider employing measures of daily mobility, such as individual activity spaces.1 35 While such approaches may result in notably different results, the practicality of collecting such data in large cohort samples is still difficult and we use a method that is comparable with existing literature.1 The self-selection of individuals into neighbourhoods remains a potential confounder and may have been driven by the availability and type of food environment in the neighbourhood.
We only include a measure of diet quality, as opposed to information on the consumption of fast food. The four-item diet quality tool used was developed through secondary analyses of the UK National Diet and Nutrition Survey. The tool was moderately associated with an NDQS that was based on UK Dietary Reference Values and validated against biomarkers of nutrient intake and nutritional status.19 20 Brief dietary assessment tools such as this can be error prone and, in studies where cost, time and participant burden considerations allow it, more detailed dietary assessment methods such as a 24-hour recall may be preferable.36
As geographical areas differ, the results presented here may not be generalisable to settings outside of the YHS. In addition, our measure of area-level deprivation is measured at the LSOA which does not align with an individual’s radial buffer. This study also does not control for spatial autocorrelation. Future research may benefit by using more novel approaches such as multilevel SEM that deal with spatial confounding once further methodological development has taken place to establish best practice approaches to integrate such approaches in these methods. Finally, BMI was defined by self-reported height and weight which can produce biased estimates of BMI.
Conclusion
This study empirically tested two simple frameworks that investigated associations between area-level deprivation, fast-food outlets, diet quality and BMI. In our exploratory analysis, there was little evidence to suggest fast-food outlet availability was associated with diet or BMI. We found stronger evidence for the contribution of area-level deprivation both as an independent effect and through diet quality for increased BMI. It is worth emphasising that the models are exploratory, however they may provoke increased criticality for both research and policy around how we define the pathways linking food environments to BMI. Future research could build on the pathways in this study to include additional complexity.
What is already known on this subject
Evidence linking geographical exposure to fast-food outlets and obesity is equivocal.
There is a dearth of evidence investigating the pathways by which area-level deprivation, fast-food outlets, diet quality and body mass index (BMI) are linked.
What this study adds
The association between fast-food outlets and BMI was small and counterintuitive, and there was no mediation effect by diet quality.
We found stronger evidence for the contribution of area-level deprivation both as an independent effect and through diet quality for increased BMI.
This is an exploratory paper which aims to provoke discussion and criticality around how we link social disadvantage, environments and health outcomes.
Acknowledgments
We acknowledge the Ordnance Survey who provided the Points of Interest data set for the food environment. We also acknowledge that the Yorkshire Health Study was funded by the NIHR Collaboration for Leadership in Applied Health Research and Care Yorkshire and Humber (NIHR CLAHRC YH, http://www.clahrc-yh.nihr.ac.uk).
References
Footnotes
Contributors All authors contributed significantly to this manuscript.
Funding The authors have not declared a specific grant for this research from any funding agency in the public, commercial or not-for-profit sectors.
Disclaimer The views and opinions expressed are those of the authors, and not necessarily those of the NHS, the NIHR or the Department of Health.
Competing interests None declared.
Patient consent for publication Not required.
Ethics approval The study was approved by the institutional review boards of Carnegie Faculty, Leeds Beckett University.
Provenance and peer review Not commissioned; externally peer reviewed.
Data sharing statement No data are available.