Article Text

Abstract
Background Residents of disadvantaged neighbourhoods report higher levels of depressive symptoms; however, few studies have employed prospective designs during adolescence, when depression tends to emerge. We examined associations of neighbourhood social fragmentation, income inequality and median household income with depressive symptoms in a nationally representative survey of adolescents.
Methods The NEXT Generation Health Study enrolled 10th-grade students from 81 US high schools in the 2009–2010 school year. Depressive symptoms were assessed with the Modified Depression Scale (wave 1) and the paediatric Patient-Reported Outcome Measurement Information System (waves 2–6). Neighbourhood characteristics at waves 1, 3, 4, and 5 were measured at the census tract level using geolinked data from the American Community Survey 5-year estimates. We used linear mixed models to relate neighbourhood disadvantage to depressive symptoms controlling for neighbourhood and individual sociodemographic factors.
Results None of the models demonstrated evidence for associations of social fragmentation, income inequality or median household income with depressive symptoms.
Conclusion Despite the prospective design, repeated measures and nationally representative sample, we detected no association between neighbourhood disadvantage and depressive symptoms. This association may not exist or may be too small to detect in a geographically dispersed sample. Given the public health significance of neighbourhood effects, future research should examine the developmental timing of neighbourhood effects across a wider range of ages than in the current sample, consider both objective and subjective measures of neighbourhood conditions, and use spatially informative techniques that account for conditions of nearby neighbourhoods.
- depression
- neighborhood/place
- social epidemiology
- inequalities
- longitudinal studies
Statistics from Altmetric.com
Introduction
The neighbourhood environment appears to be an important determinant of mental health.1 Neighbourhood attributes linked to depression include socioeconomic disadvantage, instability, lack of social cohesion and income inequality.2–4 Social theories (eg, social ecologic, social cognitive and social stress)5 suggest that associations of neighbourhood attributes with depression arise from the lack of investment and limited resources for health-promoting behaviours in disadvantaged neighbourhoods. Resource constraints break down social processes at the aggregate (eg, through low social cohesion) and individual (eg, through breaking social ties)6–10 levels that benefit mental well-being.5 Associations of low neighbourhood income with depression may arise because of increased exposure to interpersonal violence and other stressful life events in contexts without sufficient social and material supports to buffer their effects,11 and high income inequality generates invidious social comparisons which are deleterious for mental health.12 Associations of neighbourhood income or income inequality with depression may also exist because of higher social fragmentation or lower social cohesion in more disadvantaged, less egalitarian places.13 14
Neighbourhood economic disadvantage is captured by median household income and percentages of residents below the poverty line, with less than high school education, unemployed and receiving public assistance. We found 26 studies showing that residents of neighbourhoods with higher economic disadvantage had higher scores on depressive symptom scales and higher risks of major depressive disorder (eg, ORs 1.05–2.40).3 4 Residents of neighbourhoods with higher income inequality also had higher levels of depressive symptoms.12 15 16 However, there were 19 studies in which neighbourhood disadvantage was not associated with depression.
In 12 studies, residents of socially disadvantaged neighbourhoods (ie, characterised by residential instability or low social cohesion) had higher mean levels of depressive symptoms and higher risks for clinical depression; conversely, residents of neighbourhoods with lower social disadvantage (eg, greater social cohesion) had lower scores and lower risks. In other studies, however, neighbourhood social disadvantage was not associated with residents’ depression.
These inconsistent findings may reflect methodological differences between studies such as prospective versus cross-sectional study designs, focus on single regions or population subgroups rather than nationally representative samples, sample size, length of follow-up, definition of neighbourhood (census tract or ZIP code vs respondent-defined neighbourhood boundaries), assessment of disadvantage (Census data vs respondents’ perceptions) and measurement of depression. Prospective studies with longer follow-up periods were less likely to detect associations of neighbourhood social or economic disadvantage with depression. The studies reporting associations were based on follow-up periods <5 years.3 4 17 Of the studies reporting no associations between neighbourhood context and depression, nine had follow-up periods ≥ 5 years and five followed up respondents for ≥ 10 years.3 4 17–20 Notably, few studies with follow-up periods >5 years included repeated measures of neighbourhood exposures, which could fail to detect associations if neighbourhood effects decay over time.
Neighbourhood studies of mental health, most of which focused on adults or young children,3 4 17 may also have missed the developmental period of greatest risk, as depression tends to emerge during adolescence.21 22 Pabayo et al reported an association between higher income inequality and depressive symptoms among adolescent girls but not boys.12 In contrast, Airaksinen et al found that neighbourhood socioeconomic conditions were not associated with depressive symptoms measured repeatedly over five waves in young adulthood, though neighbourhood conditions were only assessed at baseline.18 Similarly, in a 14-year study of depressive symptoms among US adolescents, Barr found that Census-based neighbourhood socioeconomic conditions at baseline were unrelated to depression, whereas participants’ perceptions of neighbourhood safety and neglect were associated with higher depressive symptoms.19 However, the use of subjective measures is problematic if individuals with depression perceive their neighbourhoods more negatively than individuals without depression.23 24
Because of these inconsistent findings, we examined prospective associations of three features of neighbourhood conditions with depressive symptoms in a nationally representative sample of adolescents: social fragmentation, neighbourhood income inequality and median household income. We leveraged the following design strengths of the NEXT Generation Health Study (‘NEXT’)25: (1) a nationally representative sample; (2) six annual follow-up assessments providing repeated measures of depressive symptoms through young adulthood; and (3) repeated measurement of neighbourhood exposures utilising objective, Census-derived neighbourhood characteristics geolinked to respondents’ addresses at four study waves. We hypothesised that higher social fragmentation, lower median household income and higher income inequality would be associated with higher levels of depressive symptoms between ages 16 and 22.
Methods
Sample
NEXT enrolled a nationally representative sample of adolescents using a three-stage stratified design targeting 10th graders enrolled in public, private or parochial high schools in the USA in the school year 2009–2010.25 Primary sampling units (PSUs, n=27) consisted of school districts or groups of school districts stratified by US Census divisions. Schools in each PSU with 10th-grade classes were sampled with probability proportional to enrolment; 58.4% of sampled schools (n=81) participated. All students within randomly selected classrooms (1 to 5 per school) were eligible to participate. Parents provided informed consent for their children’s participation and youth provided assent (if <18 years of age) and consent once they reached 18 years of age. The protocol including informed consent procedures was approved by the institutional review board of the Eunice Kennedy Shriver National Institute of Child Health and Human Development and conforms to the principles embodied in the Declaration of Helsinki.
Among eligible students, 73.4% (n=2786) participated. Baseline surveys were administered in 2009–2010; however, the timing of school approval for participation resulted in the collection of baseline data for 260 respondents during wave 2 2010–2011, 11th grade). This study used data from the first six annual waves that were self-administered either in school or online. Retention rates were 86.8% at wave 2, 83.9% at wave 3, 75.9% at wave 4, 76.6% at wave 5 and 79.9% at wave 6. Schools with large percentages of African American students were oversampled to obtain reliable estimates for them.
Measures
Depressive symptoms
We assessed depressive symptoms at wave 1 using the Modified Depression Scale (MDS).26 The MDS asks respondents to rate on a Likert scale from ‘never’ to ‘always’, the frequency with which they experienced symptoms such as sadness, grouchiness or irritability, and increases or decreases in appetite and sleep over the past 30 days (Cronbach’s α=0.76– 0.80).26–28
At waves 2–6, we measured depressive symptoms using the paediatric Patient Reported Outcome Measurement Information System (PROMIS29) scale. This scale asks respondents to rate on a Likert scale from ‘never’ to ‘almost always’,30 the frequency with which they experienced symptoms including feeling that they cannot do anything right, feeling that everything in their lives had gone wrong and being unable to stop feeling sad over the preceding 7 days (Cronbach’s α=0.85 and test-retest reliability=0.76).31 The decision to switch from the MDS to the PROMIS reflected accumulating evidence of its desirable psychometric properties such as internal consistency and test-retest reliability and discrimination over wider ranges of depressive severity.30–34
Scores on the PROMIS were converted into T-scores based on distributions of scores in the general US paediatric population. We analysed depressive symptom T-scores for the PROMIS (mean=50, SD=10) and MDS scores standardised to the same mean and SD. The correlation between MDS at wave 1 and PROMIS at wave 2 was 0.48, very similar to correlations between PROMIS scores at any two consecutive waves (0.50–0.54), suggesting the two measures are performing similarly in the NEXT sample and justifying our combining them for analysis.
Neighbourhood characteristics
Respondents’ home addresses were geocoded to census tracts at waves 1, 3, 4 and 5. Consistent with previous studies of neighbourhood disadvantage and adverse health outcomes,35–39 and because of their greater stability compared with single-year estimates, neighbourhood measures were based on 5-year census tract-level estimates from the American Community Survey (ACS40): 2007–2011 for wave 1, 2009–2013 for wave 3, 2010–2014 for wave 4 and 2011–2015 for wave 5. Neighbourhood characteristics were therefore updated based on respondents’ geocoded census tracts at waves 3, 4 and 5. Because respondents were not geocoded at waves 2 and 6, we applied the values of the neighbourhood variables at wave 1 to wave 2 and those at wave 5 to wave 6. All neighbourhood variables were standardised to a mean of 0 and SD of 1 in the total US population and treated as time-varying in all models. At baseline, there were 1105 census tracts represented in the sample; census tracts were more geographically dispersed than PSUs, with an average of 41 census tracts represented within each PSU.
Social fragmentation
It is an index consisting of the sum of the standardised percentages in respondents’ census tracts of female-headed households, residents living in the area <5 years, foreign-born residents and renters.41 Single-parent households are significantly more likely than two-parent households to be poor.42 Poverty, particularly among single mothers, is a strong risk factor for the lack of social support that might buffer the stress resulting from competing demands of supporting their families financially, parenting and other life tasks.43–45 This constellation of adversity may contribute to role overload.46 Higher proportions of households in these circumstances may mean fewer adults able to act as long-term, stable, dependable sources of emotional and adaptive social support or consistently enforced norms of prosocial behaviour.6 47 Cultural and linguistic barriers in neighbourhoods with high proportions of immigrants,47 48 and the residential instability and turnover that frequently characterise renters, may likewise make it difficult to develop and maintain such ties.17 47 48
We assessed income inequality using the Gini Index.49 A value of 0 denotes perfect income equality, whereas a value of 1 denotes the scenario of all income accruing to one individual. Median household income in the ACS was adjusted for inflation to the final year covered by each relevant 5-year estimate (eg, 2014 for wave 4) using the Consumer Price Index.50 To enable the assessment of potentially non-linear associations between neighbourhood variables and depressive symptoms, we categorised the neighbourhood variables into quartiles of their distributions in the study sample for analysis.
Covariates
Time-varying covariates adjusted for in the analyses were minority composition of the neighbourhood (proportion non-White) and respondent age. Respondent-level covariates ascertained at baseline were sex, race/ethnicity (Hispanic/Latino, Black/African-American, White, other), and family socioeconomic status measured using Health Behaviour School-Aged Family Affluence Scale.51 This scale is the summed score of four items querying family car (0, 1, 2+) and computer (0, 1, 2+) ownership, the past-year frequency of family vacations (0, 1, 2+) and whether respondents had their own bedrooms (0=no, 1=yes). Scores ranged from 0 to 7 and were categorised as low (0–4), moderate (5-6) or high (7).
Analytical approach
Respondents successfully geocoded to census tracts who provided data on sex, family affluence, race/ethnicity, age and at least one measurement of depressive symptoms between waves 1 and 6 of the study were included in the analysis sample (n=2752). Among survey respondents at each wave, 18 of 2524 were missing geocodes at wave 1, 3 of 2395 at wave 3, 30 of 2177 at wave 4 and 6 of 2202 at wave 5.
We fit linear mixed models with random intercepts for PSUs and individual respondents nested within PSUs to account for the non-independence of respondents sampled from the same PSU and within-person correlation over time. The first set of models examined associations of each covariate with depressive symptoms adjusted only for respondent age. Next, we fit separate multivariable models examining each neighbourhood exposure adjusted for respondent-level covariates (model 1). As associations of neighbourhood income and income inequality may be due in part to differences in social fragmentation across neighbourhoods, we fit models with income only, income inequality only (model 2) and both (model 3), followed by a model that added social fragmentation (model 4), each adjusted for respondent-level and neighbourhood-level covariates. All analyses incorporated NEXT’s sampling weights and were performed using SAS V.9.4.
Results
The mean age of respondents at enrolment was 16.3 years. Forty-six per cent of the sample was men; 55.7% self-identified as non-Hispanic White, 20.2% as non-Hispanic Black or African-American, 19.3% as Hispanic and 4.8% as another race or ethnicity. Almost half (48.6%) reported moderate family affluence. Over the six survey waves, there were minimal changes in respondent depressive symptoms, family affluence, race/ethnicity, and neighbourhood income inequality, percentage of minority residents and median household income (table 1). However, the percentages of male respondents decreased and residents of more socially fragmented neighbourhoods increased over time.
Sociodemographic characteristics of NEXT respondents (total N=2752) and their residential neighbourhoods by survey wave, % or mean (SE)*
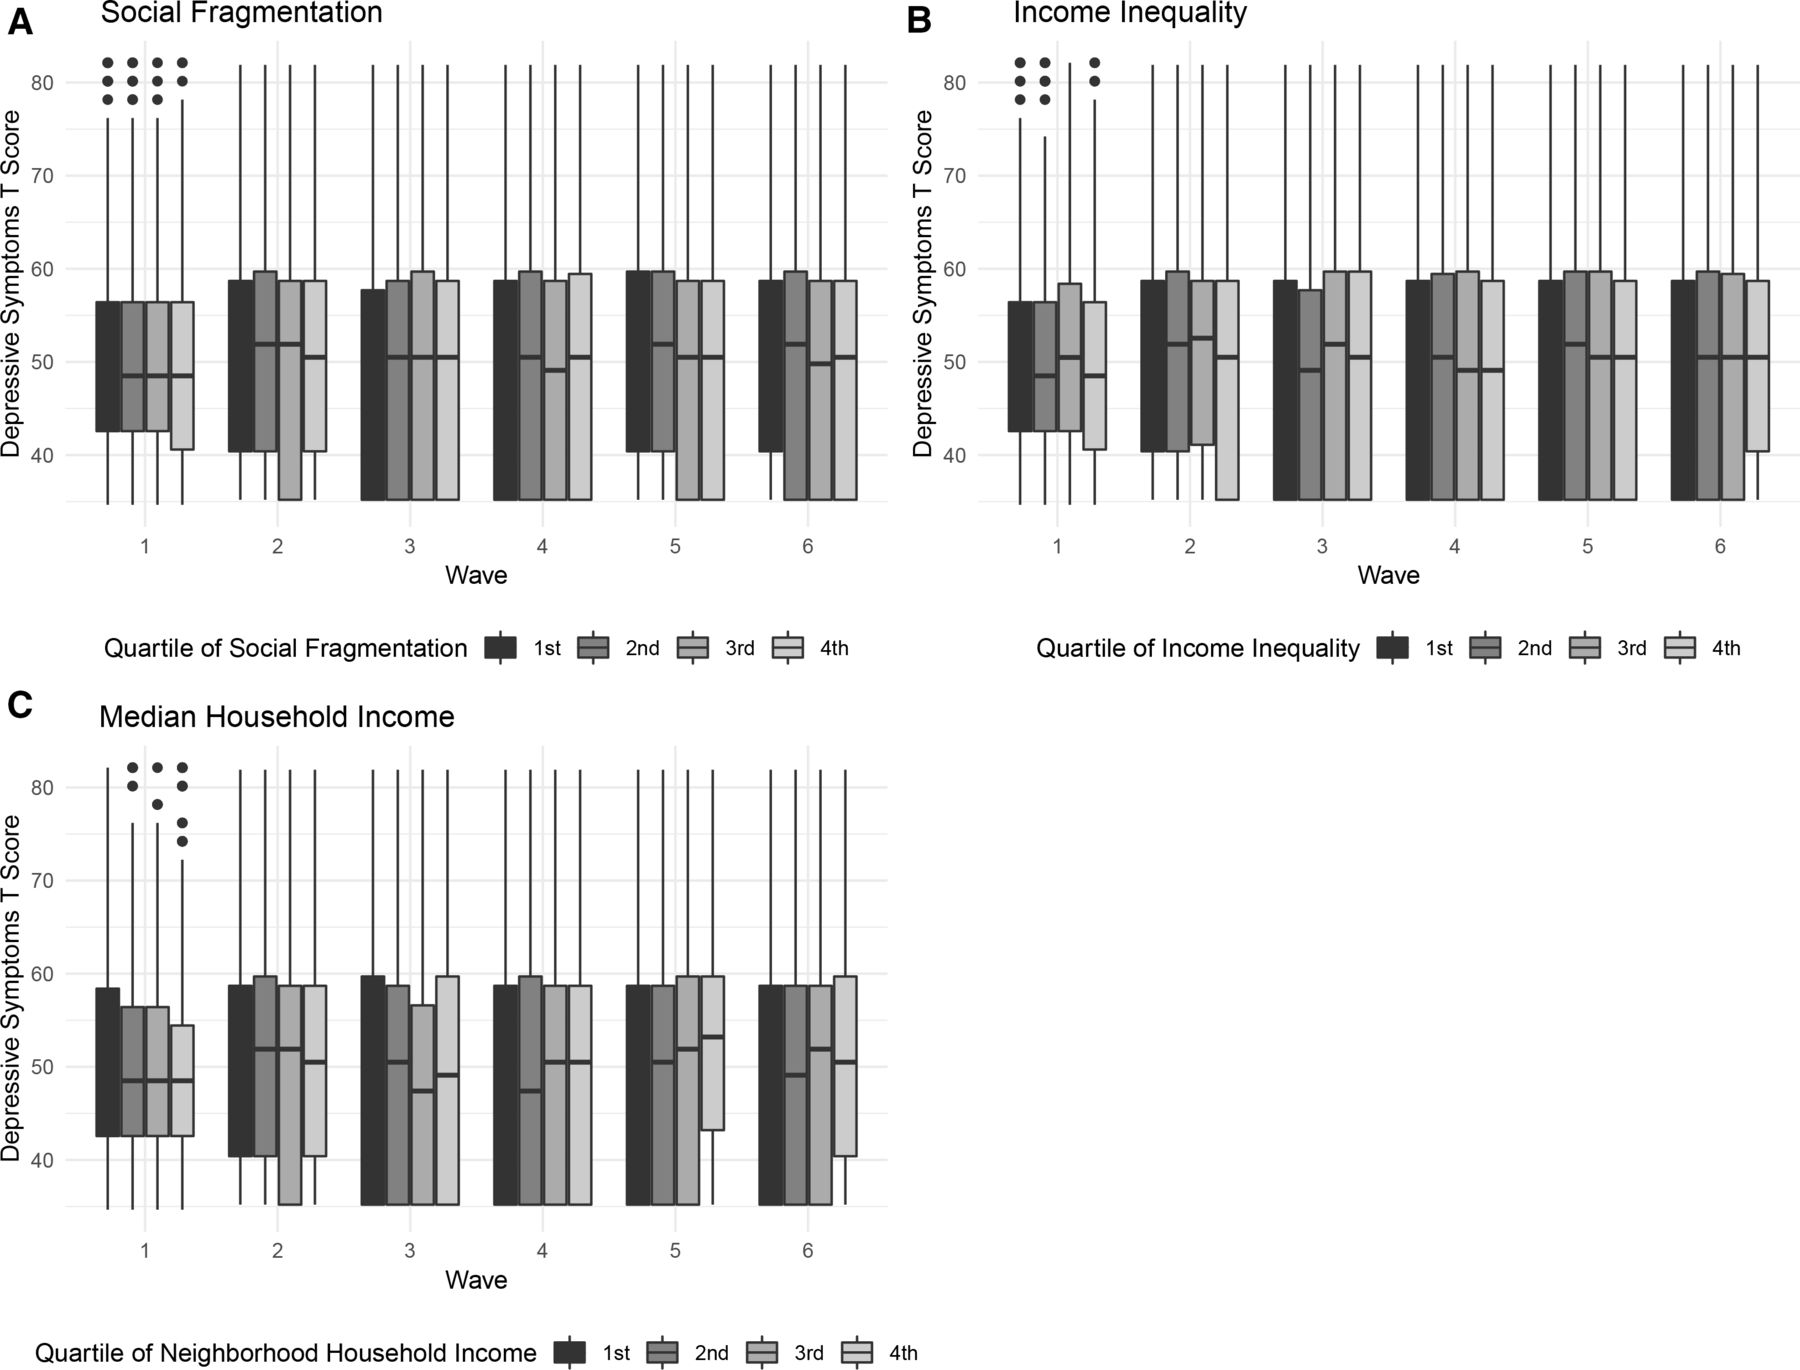
Distributions of depressive symptom T-scores by quartiles of neighbourhood exposures within each wave are shown in figure 1. The distribution of depressive symptoms was virtually the same across quartiles of neighbourhood social fragmentation, median income, and income inequality.
Box plots of depressive symptom T-scores by wave-specific quartiles of social fragmentation (panel A), income inequality (panel B), and median household income (panel C) in respondents' neighbourhoods.
Results of linear mixed models of depressive symptoms are shown in table 2.
Regression coefficients (95% CIs) from linear mixed models of depressive symptoms in the NEXT Generation Health Study, waves 1–6 (n=2752)
None of the models demonstrated evidence for associations of social fragmentation, income inequality, or median household income with depressive symptoms. For example, in the final regression model, there was no difference in mean depressive symptoms between residents of neighbourhoods at the highest vs lowest quartiles of disadvantage: 0.06 for social fragmentation (95% CI −0.95 to 1.07);−0.43 for income inequality (95% CI −1.14 to 0.29) and −0.27 for median income (95% CI −1.19 to 0.64).
Discussion
We used repeated annual measures from a prospective study of 2752 respondents enrolled in 10th grade to examine associations of census-based indicators of neighbourhood social and economic disadvantage with depressive symptoms from mid-adolescence into emerging adulthood. We found no evidence of associations of social fragmentation, income inequality or median household income of respondents’ neighbourhoods and their levels of depressive symptoms.
Our study incorporated design strengths long advocated by neighbourhood researchers: prospective follow-up, population-based sample not limited to a single geographic area, and objective, repeated assessments of neighbourhood characteristics. Moreover, our study was conducted during a developmentally sensitive period for depression and used reliable measures of depressive symptoms. Given these strengths, our findings cast doubt on the existence of robust relationships between neighbourhood social and economic disadvantage and depression among adolescents and emerging adults. These findings are compatible with those reported by many but not all studies with follow-up periods >5 years,3 4 17 52 and specifically with those reported by Airaksinen et al 18 and Barr19 that followed young people into adulthood. Although adolescence and emerging adulthood are important developmental phases for depression, our results, together with those of previous studies,3 4 17 52 suggest that neighbourhood structural characteristics may be more important during other phases. Alternatively, adolescents’ individual, family or contextual factors during the period captured by the study that operated more proximally to the young people than their residential neighbourhoods, which we were unable to measure, may have obscured any influences of their neighbourhoods. Additionally, although neighbourhood effects may decay over time, there may also be lagged effects over longer intervals than our study could capture.
Barr19 found that associations between neighbourhood disadvantage and depressive symptoms disappeared after respondent, parent and interviewer perceptions of neighbourhood safety and physical neglect were accounted for. If individuals do not perceive their neighbourhoods as disadvantaged, neighbourhoods with objectively disadvantageous structural characteristics may not be associated with a higher risk for depression. Adolescents and young adults may be less likely to perceive their neighbourhoods as disadvantaged than older individuals, even in the presence of objective indicators, if their peers in similar neighbourhoods also do not perceive their neighbourhoods as disadvantaged.53 Alternatively, supportive relationships with peers may buffer the stressors associated with neighbourhood adversity that are implicated in the aetiology of depression.53
Potential study weaknesses include the use of two different measures of depressive symptoms with two different reporting periods and two different underlying metrics over the course of the study. However, results did not change when we reanalysed the data using only the outcomes measured by the PROMIS. Short scales of depressive symptoms may not be sufficiently sensitive for detecting small to moderate neighbourhood effects. The lack of neighbourhood data from waves 2 and 6 is also a potential concern; our inability to update neighbourhood data at these waves could have attenuated associations with depressive symptoms if respondents moved to neighbourhoods with qualitatively different social and economic conditions. Although residential census tracts are standard units of analyses in studies of neighbourhood exposures, individuals’ daily lives may span multiple census tracts beyond their residences. There may also be substantial sociodemographic segregation within tracts that our measures did not capture.
Given the design strengths of our study—nationally representative and diverse sample, repeated assessments of both neighbourhood characteristics and depressive symptoms, and reliable measures of depression—it is tempting to interpret our results as suggesting that, at least on a national level and among adolescents and emerging adults, neighbourhood social and economic characteristics are not associated with mental health. Nevertheless, the potential weaknesses noted above and generally discounted in the aggregate may have obscured real but small effects. The public health implications of putative neighbourhood effects are important because they can have diffuse impacts over large numbers of individuals and because of the substantial burden attributable to depression.54 Therefore, we offer the following suggestions for strengthening future studies.
Future attempts to resolve inconsistent findings concerning the role of neighbourhood disadvantage in the risk of depression across the life course will benefit from incorporating prospective designs spanning multiple developmental phases, particularly the highest-risk periods of adolescence and early adulthood.21 22 Future studies might also consider both objective and subjective neighbourhood measures and accessibility of services and amenities such as green space that might mitigate deleterious effects of neighbourhood disadvantage.55 Multiple statistical approaches could be utilised, including spatial analyses that take conditions of nearby neighbourhoods into account and provide finer-grained characterisation of respondents’ neighbourhoods. Clarifying the potential mental health risks associated with neighbourhood disadvantage, including their developmental phase specificity, and identifying neighbourhood-level targets for intervention will ultimately benefit efforts toward optimising the mental health of adolescents and emerging adults.
What is already known on this subject
Neighbourhood social and economic disadvantage, social fragmentation and income inequality have been associated with depression in some but not all studies.
Few prospective follow-up studies of neighbourhood effects on depression have been conducted during adolescence when depression tends to emerge, few have utilised nationally representative samples and few have obtained repeated measures of neighbourhood characteristics.
What this study adds
We detected no associations of neighbourhood disadvantage with depressive symptoms from mid-adolescence into emerging adulthood despite a prospective design, nationally representative US sample and repeated measures of both neighbourhood disadvantage and depressive symptoms.
Neighbourhood effects on depression may be too small to detect in geographically dispersed samples of adolescents and young adults.
Future research should consider the developmental timing of neighbourhood effects, assess both objective and subjective neighbourhood measures, and utilise multiple analytic approaches, including spatial techniques that account for conditions of nearby neighbourhoods and provide a more refined characterisation of individual respondents’ neighbourhood exposures.
Acknowledgments
The authors are grateful for the expert data management and statistical programming support of Ms. Gina Ma.
References
Footnotes
Contributors Study concept and design: RBG, AKL and SEG. Drafting of the manuscript: RBG. Acquisition, analysis or interpretation of data; critical revision of the manuscript for important intellectual content; approval of submission and accountability for all aspects of the work in ensuring that any questions related to the accuracy or integrity of any part of the work are appropriately investigated and resolved: All authors.
Funding This research (contract number HHSN275201200001I) was supported in part by the Intramural Research Program of the Eunice Kennedy Shriver National Institute of Child Health and Human Development, and the National Heart, Lung and Blood Institute, the National Institute on Alcohol Abuse and Alcoholism, and Maternal and Child Health Bureau of the Health Resources and Services Administration, with supplemental support from the National Institute on Drug Abuse.
Disclaimer The views, opinions and assertions expressed in this report are those of the authors and should not be construed to represent the views or the official policy or position of any of the sponsoring organisations or agencies or the US government, including the Uniformed Services University or the Department of Defense.
Competing interests None declared.
Patient consent for publication Not required.
Provenance and peer review Not commissioned; externally peer reviewed.
Data sharing statement Data from the Next Generation Health Study are available through the Data and Specimen Sharing Hub (DASH), a centralized data resource for researchers to access data from research studies funded by the Eunice Kennedy Shriver National Institute of Child Health and Human Development for use in secondary research. For further information, please visit: https://dash.nichd.nih.gov/