Article Text

Abstract
Background It is unclear if adolescent personality predicts mortality into late life, independent of adolescent socioeconomic status (SES).
Methods Over 26 000 members of Project Talent, a US population cohort of high school students, completed a survey including 10 personality scales and SES in 1960. Multi-source mortality follow-up obtained vital status data through an average 48-year period ending in 2009. Cox proportional hazard models examined the relative risk associated with personality traits, as well as confounding by both a measure of SES and by race/ethnicity.
Results Adjusted for sex and grade, higher levels of vigour, calm, culture, maturity and social sensitivity in high school were associated with reduced mortality risk (HRs=0.92 to. 96), while higher levels of impulsivity were associated with greater mortality risk. Further adjustment for SES and school racial/ethnic composition mildly attenuated (eg, 12%), but did not eliminate these associations. Final HRs for a 1 SD change in personality traits were similar to that for a 1 SD change in SES.
Conclusions Adaptive personality traits in high school are associated with all-cause mortality in the USA as far into the future as the seventh decade, and to a degree similar to high school socioeconomic disadvantage.
- all-cause mortality
- life course epidemiology
- personality traits
- project talent
This is an open access article distributed in accordance with the Creative Commons Attribution Non Commercial (CC BY-NC 4.0) license, which permits others to distribute, remix, adapt, build upon this work non-commercially, and license their derivative works on different terms, provided the original work is properly cited, appropriate credit is given, any changes made indicated, and the use is non-commercial. See: http://creativecommons.org/licenses/by-nc/4.0/.
Statistics from Altmetric.com
Introduction
Numerous studies now indicate that personality phenotypes measured during the second half of life prospectively predict all-cause mortality.1 2 Such studies typically involve a follow-up period from one to two decades, and use relatively brief measures of personality traits.1 2 This work has established a valuable evidence base around the patterns of mortality risk associated with certain personality traits. However, from a life course epidemiology perspective,3 bidirectional associations may exist between personality and other factors which themselves confer mortality risk. These include age-related increases in medical morbidity4 and patterns of socioeconomic status (SES) over time.5 Not all of these factors can be measured or adequately controlled in studies focused on personality in the latter years. Thus, estimating the true mortality risk due to personality can be difficult, due to a life time of unobserved confounding.
Another challenge that has limited progress is that when personality is measured later in life, it may be characterised by selective survivorship. Accurate mortality risk estimates for such traits are then difficult to achieve, even though they may be of greatest interest for life course researchers. Viewed over time, periods of acceleration or deceleration in the risk of an exposure can reveal important information about sensitive periods for prevention.6 For instance, some have suggested that personality dispositions related to impulsiveness may confer greater health risk earlier in life,7 8 potentially producing selective survivorship among older cohorts. Personality assessment in adolescence followed by several decades of follow-up would facilitate the assessment of whether mortality risk for certain traits is focal to particular periods of life.
Finally, while studies have shown mortality risk for personality traits measured in mid-life, it remains unknown how early in life such risk can be traced. It would be somewhat remarkable to observe long-term mortality risk for traits relatively early in life, given that this is also the period during which they show the greatest plasticity.9 Of course, traits conferring risk or protection against death may change, becoming more pronounced over time, such as conscientiousness or diminishing with time, such as neuroticism.10 In contrast to IQ,,11 virtually no work has examined the mortality risk arising from personality traits measured early in life. The only US study involved roughly 1300 childhood geniuses, finding that conscientiousness-social responsibility measured in grade school reduced risk of death from any cause in the 70 s.12 One similar finding in Luxembourg exists,13 but US population data are lacking.
We sought to determine whether the so-called ‘long arm’ of mortality risk decades later – which has been documented for earlier life socioeconomic disadvantage14 and lower IQ11 – also exists for personality traits. There is also a debate about whether socio-structural factors such as SES, or individual traits such as personality and IQ represent the so-called ‘fundamental cause’ of US population gradients in mortality.15–17 This would imply that even if personality traits in adolescence confer mortality risk, some or all of this risk could ultimately be explained by family or background SES. Therefore, after obtaining relative risk estimates for personality traits, we examined the extent to which they were confounded by contemporaneous measurements of family SES or minority race/ethnicity.
Methods
Participants
The Project Talent (PT) Study is a national probability sample of 5% of all US high schools (n=1226), originally conducted in 1960.18 Students in selected high schools (n=377 016) completed a 2-day (or four half-days) battery of tests and questionnaires assessing a variety of factors. The vast majority of participants ranged in age from 13 (9th grade) to 18 (12th grade). The current report involves mortality data obtained through 2009 on a sample of 26 845 PT participants (spanning 1171 of the original schools).
Measures
PT personality inventory
The Project Talent Personality Inventory (PTPI) was designed after contemporary leading personality inventories,19 and measures 10 traits postulated to be important for life success:
Calm (freedom from distressing emotions),
Social sensitivity (empathy and sensitivity to others’ feelings),
Impulsiveness (recklessness or tendency towards rash action),
Leadership (responsibility and self-direction),
Vigour (an energetic disposition),
Self-confidence (assurance in one’s own judgement and abilities),
Tidiness (propensity towards organisation and order),
Sociability (outgoingness and desire for social interaction),
Culture (artistic and intellectual refinement), and
Maturity (responsibility, persistence, goal-orientation).
The traits of the PTPI have been located within the modern Big 5 taxonomy of personality, with calmness and self-confidence most closely corresponding to low levels of Big 5 Neuroticism, sociability and vigour reflecting Big 5 Extraversion, culture being linked to Big 5 Openness, sensitivity to Big 5 Agreeableness, and leadership and tidiness corresponding to high Big 5 Conscientiousness.20 Impulsivity is most indicative of low Conscientiousness.20
Internal consistency reliability was estimated in a random subset of PT for which item-level data was recorded in 1960 (n=13 478: summary scores were recorded in the main data file due to limitations in electronic storage media at the time). Internal consistency ranged from. 77 to 91 for nine of the 10 traits. Internal consistency for Impulsivity was lower (0.51).20 All PTPI scales were scored so that high values reflect higher levels of the trait in question, and standardised to a mean of zero and SD of 1. Thus, hazard ratios (HRs) reflect the relative risk associated with a 1 SD increase in the trait.
Other variables of interest
Additional participant characteristics considered include sex, grade in 1960 and family-level SES. Family SES was measured with a scale developed to tap several common indicators of socioeconomic status.19 These included parental education, occupation, income, housing and property ownership (α=0.69). This composite is associated with SES outcomes such as education and occupational status by age 30,21 as well as with later life health outcomes such as cognitive impairment.22 At baseline in 1960, school racial composition, rather than individual race, was recorded. However, individual race could be derived from the various PT follow-up data collections, administrative data linkagesand reports from siblings for roughly 40% of the sample. For the remainder, five imputations based on school and sibling data agreed almost perfectly with one another and yielded an individual race classification with an accuracy of 92%23 in a test sample with known race. Analyses using 1960 school level racial composition were conducted and revealed nearly identical results, so individual race is used here. Finally, a baseline survey item asked: ‘Which of the following best describes your health over the last 3 years?' with six choices ranging from excellent to poor. While adolescents are expected to be in good health as a whole, this was included as an additional covariate in sensitivity analyses to detect any confounding of baseline personality and health.
Mortality surveillance
The research team tracked mortality data for participants sampled for modern PT data collections. The samples tracked include an oversample of African-American participants from majority African-American high schools in 1960, participants who are twins or siblings of twins, and two random samples of participants. These samples were combined to form the analytic sample for the present analysis (figure 1). The analytic sample included marginally more females (53% vs 51% of the overall sample), and differed by less than 0.05 SD on all personality traits. Compared with the overall baseline sample, the analytic sample was approximately 18 SDs lower on the SES index. Mortality status was determined through linkage with the National Death Index (NDI). Participants were classified as deceased if they were successfully matched to an NDI record. The analytic sample captures deaths between 1979 and 2009.

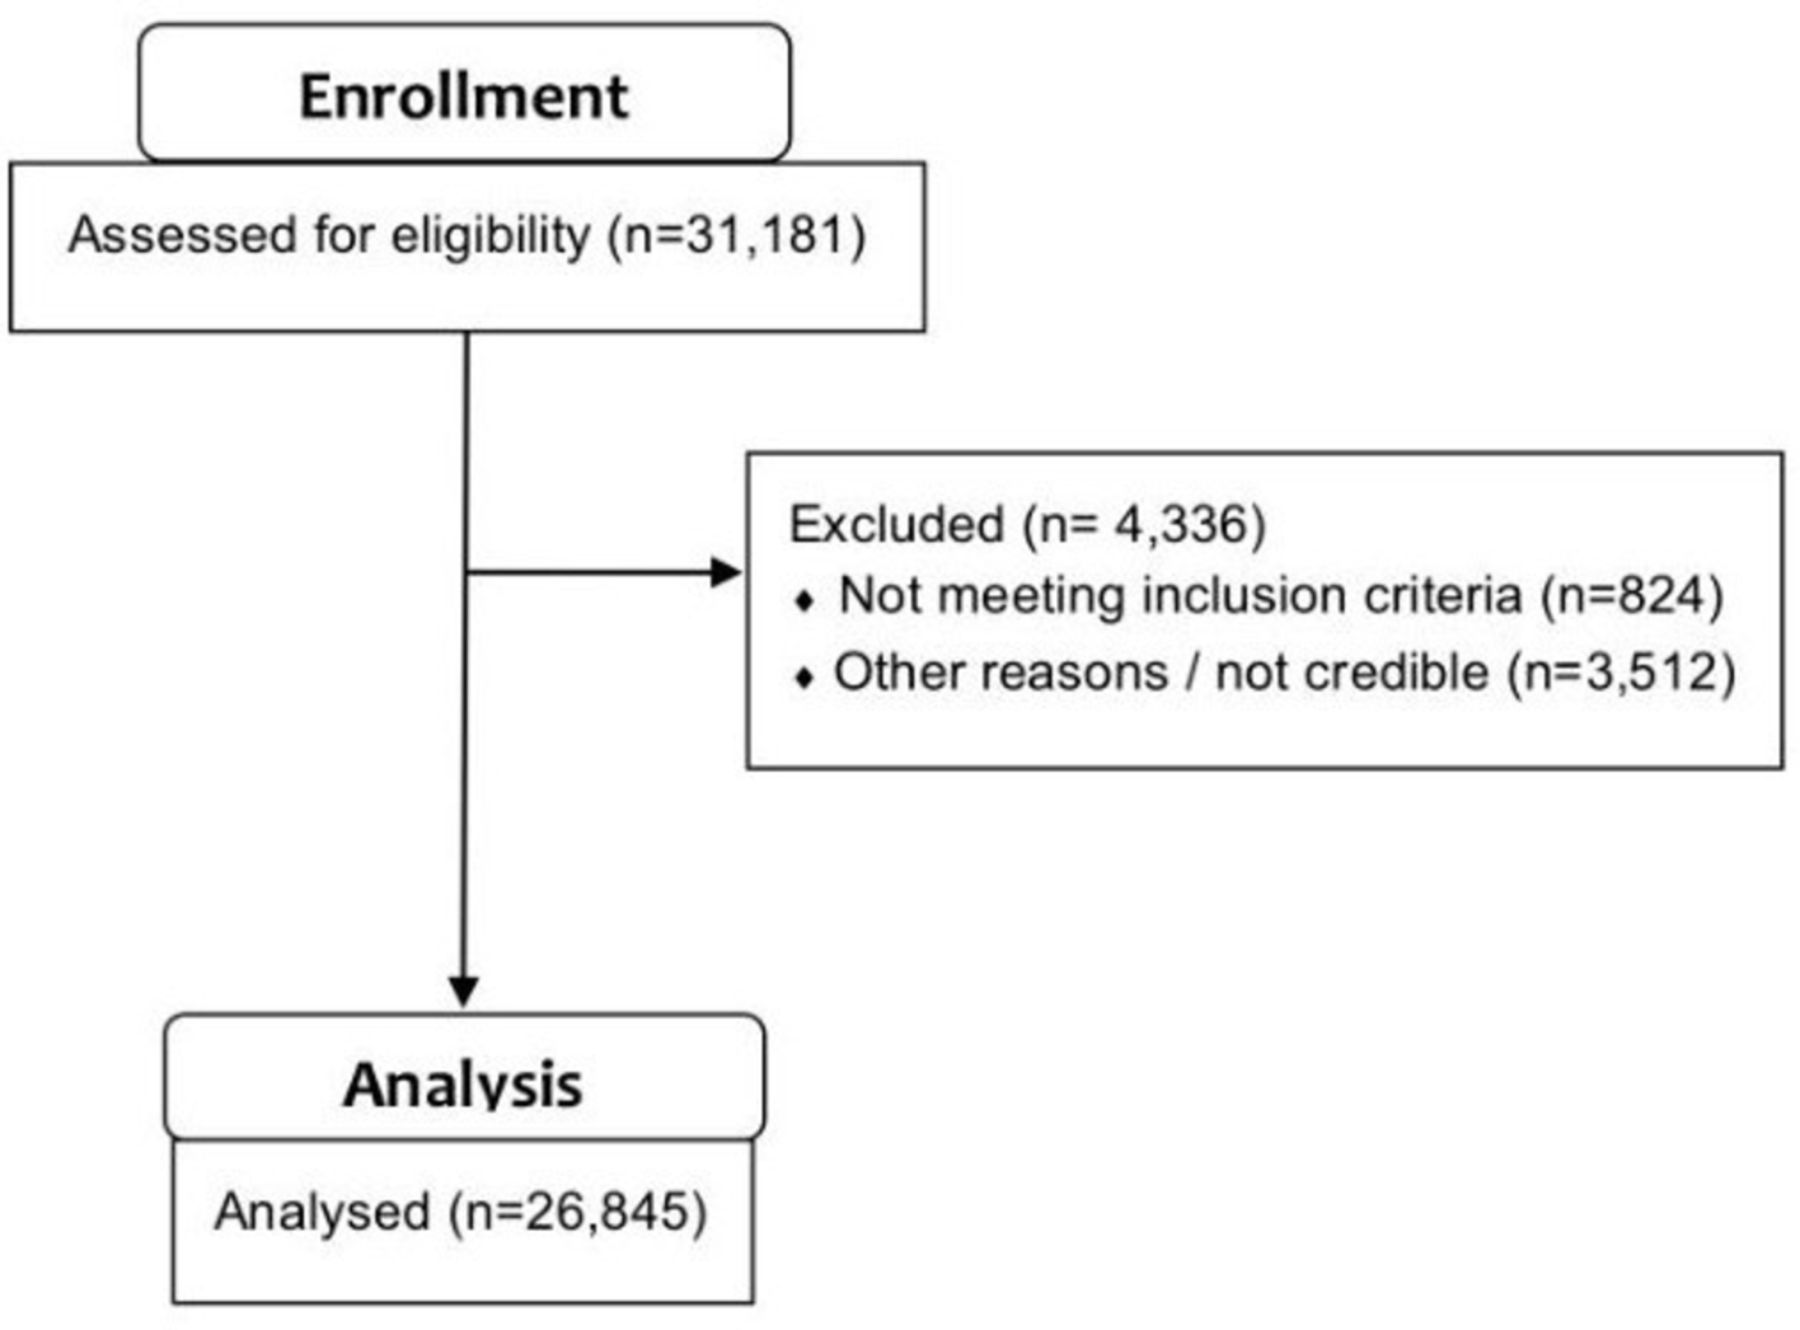
Flow from eligible cases to analytic sample.
Analyses
We first examined descriptive statistics and univariate distributions of all variables. Specification tests first examined personality traits for evidence of non-proportional hazards in Cox models (which would indicate periods of accelerating or decelerating risk over the life course) and (multiplicative) interactions with covariates. After these specification tests, an initial set of models estimated the relative risk associated with a 1 SD increase in each personality trait, adjusted for sex and grade. Since the PTPI scales were moderately intercorrelated (ie, Pearson r=0.2’s to. 6’s), separate covariate-adjusted models were estimated for each trait. A second series of models then adjusted for the SES index and minority race, to examine any confounding of personality traits by factors reflecting background socioeconomic disadvantage. All models were fitted with cluster-robust standard errors to account for clustering within families. In a sensitivity analysis, all models were fitted with cluster-robust standard errors to account for 1960 schools. To address potential overlap between the PTPI scales, supplementary analyses factor analysed the scales to determine if one or more common dimensions accounted for their inter-correlation. Factor scores were then estimated, scaled to a mean of 0 and SD of 1, and the series of sequentially adjusted models again estimated. Another sensitivity analysis adjusted for self-rated health at baseline. Finally, supplementary analyses were conducted using trait tertiles. The study was IRB-approved.
Results
Table 1 shows sample descriptives. Follow-up spanned an average of 47.82 (SD=4.19) person years, with a mortality rate of 13.12%. Preliminary specification tests revealed no strong evidence of non-proportional hazards or non-linearity in the log-hazard for the PTPI trait scales. Table 2 shows relative risk estimates from the Cox models. In models adjusted for age and sex only (first column), all adaptive traits except leadership and self-confidence conferred protection against mortality over the follow-up period. Sex- and grade-adjusted HRs ranged from 0.92 to 0.96 for 1 SD of adaptive traits, and an HR of 1.08 was observed for 1 SD of impulsivity. In model 2, adjusting for family SES and minority race/ethnicity yielded little change in these estimates. The mild protective effect for sociability was yielded non-significant, but remained within the 95% CI of the original estimate. The protective HRs for social sensitivity, vigour and calm were attenuated by roughly 23%, 16% and 11%, respectively. However, they remained well within the original 95% CIs.
Sample characteristics
Relative risk estimates for adolescent personality traits
In supplementary analyses, factor analysis of the PTPI scales provided strong evidence of a single, general factor accounting for the correlations among scales (first unrotated eigenvalue=4.36, second unrotated eigenvalue=0.28). This general factor showed relatively high loadings for maturity, social sensitivity, culture, calm and tidiness (all factor loadings>0.7). Consistent with the mortality observed for these traits, table 3 shows that higher scores on the general factor reflected reduced risk for all-cause mortality over follow-up in sex- and grade-adjusted models (HR=0.93, 95% CI 0.91 to 0.97 for a 1 SD change). Further adjustment for family SES and race/ethnicity yielded little (12%) attenuation of this estimate. Across all models, minority race/ethnicity, male gender, and lower SES were all associated with increased mortality risk across models for all individual traits. Representative hazard ratios appear in table 3. Sensitivity analyses adjusting SES for clustering at the school level revealed a nearly identical pattern of results, as did analyses using school racial composition rather than individual race. Adjusting for self-rated health at baseline resulted in minimal change in personality trait estimates. Tertiling of traits did suggest a possible threshold for vigour at which risk increased at the second, relative to the top tertile (HR=1.22, 95% CI=1.12 to 1.34, P<0.011) of vigour, but increased minimally after that at the lowest tertile of this trait. Compared with the top tertiles of calmness and tidiness, little risk was apparent in the middle tertile of these traits, becoming elevated at only the lowest tertile (HR=1.15, 95% CI=0.94 to 1.12 for calm, HR=1.14, 95% CI=1.05 to 1.23, P<0.001).
Relative risk estimates for global personality factor
Discussion
It has been unclear how early in the life course personality-related mortality risk can be detected. The bulk of work has focused on midlife and older samples with relatively shorter follow-ups. Our findings are the first of which we are aware that examine later life mortality risk associated with personality phenotype measured much earlier in the life course in a US population sample. Those scoring higher in vigour, social sensitivity, calm, tidiness, culture and maturity – and lower in impulsiveness – during high school enjoyed lower relative risk of mortality over the subsequent half century.
We also considered whether personality mortality risk could be accounted for by sociostructural inequalities present during high school – the so-called ‘fundamental cause’ question in social and life course epidemiology.24 Adjusted only for sex and grade in 1960, trait associations were slightly larger than when additional controls for SES and racial/ethnicity composition were added. This suggests that there is little confounding of the link between personality traits and later mortality by SES or race/ethnicity. While both of the latter factors are associated with mortality risk, they do little to explain the associations observed for adolescent personality traits.
This pattern of additive independence between individual level psychological and macro-level sociostructural factors has been referred to as a ‘compensatory-cumulative’ model of individual-contextual risk.17 Adaptive dispositions can compensate for a societally disadvantageous background such as lower family social class independently and additively, but maladaptive traits combined with lower social class create an additive risk. This can be viewed as a kind of ‘buffering’ of the health risks of social disadvantage by adaptive personality dispositions in adolescence. A stronger form of buffering reflecting statistical interaction or effect modification has been called ‘resource substitution', for instance, when personality traits actually mitigate the association of low childhood SES with low adult SES.21 25 Here, we observed no evidence of such interactions between personality traits and SES or race.
In fully adjusted models, a 1 SD change in personality traits was associated with 5%–7% increases or decreases in 48-year relative risk of death. Unlike prior work, we did not directly estimate population-attributable fractions.17 However, the relative risk observed for a 1 SD shift in personality traits was comparable to that observed for a 1 SD shift on the SES composite. Given the time horizon of eventual outcomes over half a century later, it is noteworthy that these associations are only slightly smaller than those reported for personality traits in the second half of life over shorter follow-up periods.1 2
In one sense, the tracing of personality-mortality associations back to adolescence is surprising because the high school years are widely seen as a time of personality development and malleability.26 Fundamental drift away from protective personality tendencies in high school would be expected to attenuate the associations observed here. On the other hand, an amplification of high school protective personality tendencies could also occur over the ensuing years,27 28 preserving and strengthening the pattern of associations observed here.
Personality change over the life course is a complex issue, with considerable individual variability.9 However, a ‘normative’ pattern of mean-level changes in traits appears to exist, in which people tend to become more Conscientious, while declining in Neuroticism, Openness and Extraversion with age.10 A recent study examined these exact issues in a subset of the current sample and found patterns of mean-level change quite consistent with prior meta-analytic estimates. In fact, the PT sample increased on maturity relevant scales, such as maturity calmness and social sensitivity.29 Some evidence also indicates that systematic intervention may induce personality changes in adulthood, particularly around traits related to negative emotion (eg, low levels of calmness).30
Life course mechanisms linking personality to poorer health outcomes include the adoption of poor health behaviours31 and long-term effects of wear and tear on the immune, endocrine and cardiovascular systems.32 Maladaptive traits also appear to limit later educational attainment,33 impede mid-life occupational advancement5 and increase risk of divorce34 – social and socioeconomic factors linked to later health.
The present findings underscore the importance of interventions, policies and programmes aimed at cultivating adaptive personality tendencies in adolescence. However, arguments for such initiatives should not be limited only to benefits like social adjustment or educational success. These results suggest that there is a measurable association with lifespan itself, a justification that is difficult to rebut. The present results also point towards the utility of a universal approach to programmes which leave a positive imprint on adolescent personality. Had we been able to explain personality associations with mortality largely by socioeconomic disadvantage, one might conceive of maladaptive personality traits as a pathway or mechanism that should be selectively targeted in lower socioeconomic strata. This was not the case, however – adolescent personality appears to be a predictor of long-term mortality regardless of one’s social background.
Our findings must be balanced with consideration of the strengths and limitations of our design. While our study arises from a national probability sample, our analytic sample was only partially randomly selected, with other segments oversampling African-Americans and sibling/twin pairs. While these factors were accounted for in the analysis, future work with a completely random population sample would be useful. Individual-level data on race/ethnicity was also available for only part of the sample, and estimated – although with strong validation results – in others. Use of school-level racial composition, however, yielded identical findings in our effort to determine if race/ethnicity confounded personality-related mortality risk. We also did not examine specific causes of death, although such data would provide further insight into the life course risk pathways posed by adolescent personality traits. Major strengths are the combination of a large national sample, nearly half-century of follow-up and an extensive personality inventory.20 The present findings cannot speak to mortality in very late decades of life, however.
Ultimately the PT cohort features many of the baby boom generation, who are driving the current ‘greying of America’ both due to their size and increases in life expectancy.35 Thus, findings are quite timely in that they reflect early life circumstance of older persons currently served by primary care, geriatrics and the Medicare programmes. As future cohorts age, it will be important to update findings such as these in order to ascertain any secular trends. For at least the current generation of older Americans, however, these results indicate that personality traits in high school have long-lasting implications for population mortality.
What is already known on this subject
Personality phenotype in older ages is known to prospectively predict mortality.
It is unclear how early in the lifespan this association appears, and if it can be explained by SES earlier in life.
What this study adds
We show that personality traits in adolescence prospectively predict all-cause mortality nearly 50 years' later, in a national US sample.
This association appears largely independent of family socioeconomic status at adolescence.
References
Footnotes
Contributors BPC: design, analysis, interpretation, drafting and critical revision. SL, KP, EH, ES, BR: interpretation, drafting, critical revision.
Funding This study was funded by National Institute on Aging (grant number: R01 AG053155).
Competing interests None declared.
Patient consent Not required.
Ethics approval University of Rochester Medical Center and American Institute for Research IRBs.
Provenance and peer review Not commissioned; externally peer reviewed.