Article Text

Abstract
Background We summarise the evidence for an association between screening scores from the Alcohol Use Disorders Identification Test (AUDIT) and all-cause mortality.
Methods Using the Preferred Reporting Items for Systematic Reviews and Meta-Analyses guidelines, prospective cohort studies reporting all-cause mortality risk by AUDIT scores (complete AUDIT-10 or AUDIT-C) were identified through MEDLINE, Embase, PubMed and Web of Science up to September 2016. Risk estimates were pooled using random effects meta-analyses.
Results Seven observational studies with 18 920 observed deaths among 309 991 participants were identified. At-risk drinking (ie, hazardous/harmful consumption, AUDIT-10 ≥8 and AUDIT-C ≥4) was associated with elevated mortality risk after 2–10 years of follow-up (pooled relative risk (RR)=1.24, 95% CI 1.12 to 1.37) compared with moderate drinking (AUDIT-10=1–7, AUDIT-C=1–3). Compared to past year abstainers (AUDIT=0), moderate drinkers had a lower mortality risk (RR=0.75, 95% CI 0.71 to 0.79) in US Veterans and a similar mortality risk (RR=0.99, 95% CI 0.72 to 1.38) in population-based studies. Most data came from studies among Veterans using the short AUDIT-C in men and showed a dose–response relationship (RR=1.04, 95% CI 1.04 to 1.05 for each AUDIT-C score among drinkers). Data for women and young adults were scarce.
Conclusion AUDIT screening scores were associated with mortality risk. The association was differential depending on the population examined, which may be related to prevalence of former drinkers among current abstainers. Due to heterogeneity between studies and the small number of populations examined, generalisability may be limited.
- alcohol
- screening
- cohort studies
- meta analysis
- mortality
Statistics from Altmetric.com
Introduction
Alcohol consumption accounts for 5.9% of total mortality worldwide and 5.1% of disability-adjusted life years,1 making it one of the top five risk factors for disease and disability; in men, it is the third most important risk factor globally.2 Alcohol consumption is prevalent in many high-income and increasingly in low-to-middle-income countries.3
The WHO Alcohol Use Disorders Identification Test (AUDIT),4 5 first published in 1989, was developed for use in a primary care setting and is now used in and recommended for many clinical and research settings in many countries as a time-effective screening tool for identifying at-risk alcohol consumption.6–8 It has been shown that both the AUDIT-10 and the AUDIT-C can be successfully used to screen for alcohol use disorder according to DSM-IV (Diagnostic and Statistical Manual of Mental Disorders fourth edition) and DSM-5 (fifth edition).8–11 It is unclear, however, to which extent the AUDIT screening tools are also able to predict mortality, arguably the most important clinical outcome. To our knowledge, no systematic review or meta-analysis has evaluated the ability of the AUDIT to predict all-cause mortality. We thus aimed at systematically investigating the ability of AUDIT scores to predict mortality.
Method
Search strategy
This systematic review and meta-analysis followed the Preferred Reporting Items for Systematic reviews and Meta-Analyses guidelines.12 The following electronic databases were searched for original articles published from 1989 to the first week of September 2016: MEDLINE and Embase (through Ovid), Web of Science (Science Citation Index Expanded, Social Sciences Citation Index and Arts & Humanities Citation Index) and PubMed. Search terms included: (AUDIT) AND (mortality OR mortal*) AND (alcohol OR alcohol* OR drinking OR drink* OR alcohol drinking OR alcohol drink*) (online supplementary table A). Additionally, reference lists of identified papers were searched. The literature search was conducted by SK-P. SK-P and MR abstracted the data and conducted the analyses in duplicate.
Supplemental material
Eligibility criteria
Studies were included if they: (1) used a prospective or historical cohort study design; (2) assessed drinking by the AUDIT-10 or AUDIT-C; (3) reported all-cause mortality as the outcome; (4) reported a measure of relative risk (RR) and its variance, or enough data to calculate these; (5) data were at least adjusted for age; (6) were of English or German language; and (7) did not involve a population with severe disease. Papers were initially screened for inclusion by title and abstract, followed by full-text review.
Data extraction
From all relevant papers, we extracted authors’ names, year of publication, country where the study was conducted, setting, year(s) of baseline examination, follow-up period, number of participants by AUDIT score category, number of deaths in each group defined by the AUDIT score, mean or median age, sex, adjustment for potential confounders and measures of RR and its SE. We preferred the most adjusted RRs and abstracted these by sex where reported. In case RRs needed to be recalculated to make reference groups comparable, we used the method of Hamling et al,13 taking into account the variance–covariance matrix.
Exposure assessment
The AUDIT measures current (past 12 months) alcohol consumption and related problems.5 The AUDIT-10 contains 10 questions (frequency and amount of drinks on drinking days and frequency of heavy drinking occasions (≥6 drinks), inability to stop drinking once started, failing to meet expectations because of drinking, needing a drink first in the morning after a heavy drinking session, guilt or remorse after drinking, inability to remember what happened because of drinking, injury to someone else because of drinking and being told by someone else about one’s drinking) and is scored from 0 to 4 for each question, resulting in a total score ranging from 0 to 40. The shorter version (AUDIT-C) contains three questions on frequency of drinking, volume on typical drinking days and frequency of heavy drinking occasions (≥6 drinks). The scores range from 0 to 12, and the questions are identical to the first three questions of the AUDIT-10.14 Scores of 0 for either the AUDIT-10 or AUDIT-C (those who answered ‘never’ to the question ‘How often do you have a drink containing alcohol?’ (in the last year)) were defined as ‘current abstainers’. We labelled AUDIT-10 scores of 1–7, and AUDIT-C scores of 1–3 as ‘moderate’ drinkers (one study reported AUDIT-C scores of 1–4).15 ‘At-risk’ drinking was defined as AUDIT-10 scores of ≥8 and AUDIT-C scores of ≥4.8 In sum, three drinking groups were distinguished for categorical analyses: current abstainers, moderate drinkers and at-risk drinkers, as defined by the AUDIT-10 or AUDIT-C.
Outcome
All-cause mortality was the outcome.
Quality assessment
Study quality was rated via the Newcastle-Ottawa Scale (NOS).16 Quality was rated independently by two reviewers. Furthermore, we included quality components such as study design into the inclusion and exclusion criteria and by conducting subgroup analyses by study setting. Data were abstracted in duplicate and independently by two authors with no differences recorded. Authors were contacted to clarify or provide additional information.
Statistical analyses
In most studies, less than 10% of participants died, thus HRs, ORs and RRs were treated as equivalent expressions of overall mortality risk and are referred to as RR throughout the remaining text. We preferred sex-specific and adjusted data. Meta-regression analyses examining the effect of setting (Veteran Affairs (VA) samples vs population-based samples) were conducted.17 The low number of studies did not allow for investigating other study characteristics as sources of heterogeneity. RRs were pooled across studies using inverse-variance weighted DerSimonian-Laird random effect models to allow for between-study heterogeneity.18 We quantified between-study heterogeneity using Cochran’s Q and the I 2 statistic.19 Possible publication bias was assessed using Egger’s regression-based test20 and visual inspection of funnel plots. Sensitivity analyses for the influence of single studies on the pooled RRs were conducted, omitting studies one by one and re-estimating the pooled RR. All meta-analytical analyses were conducted on the natural log scale in Stata statistical software, v.14. P<0.05 (two sided) was considered statistically significant.
Results
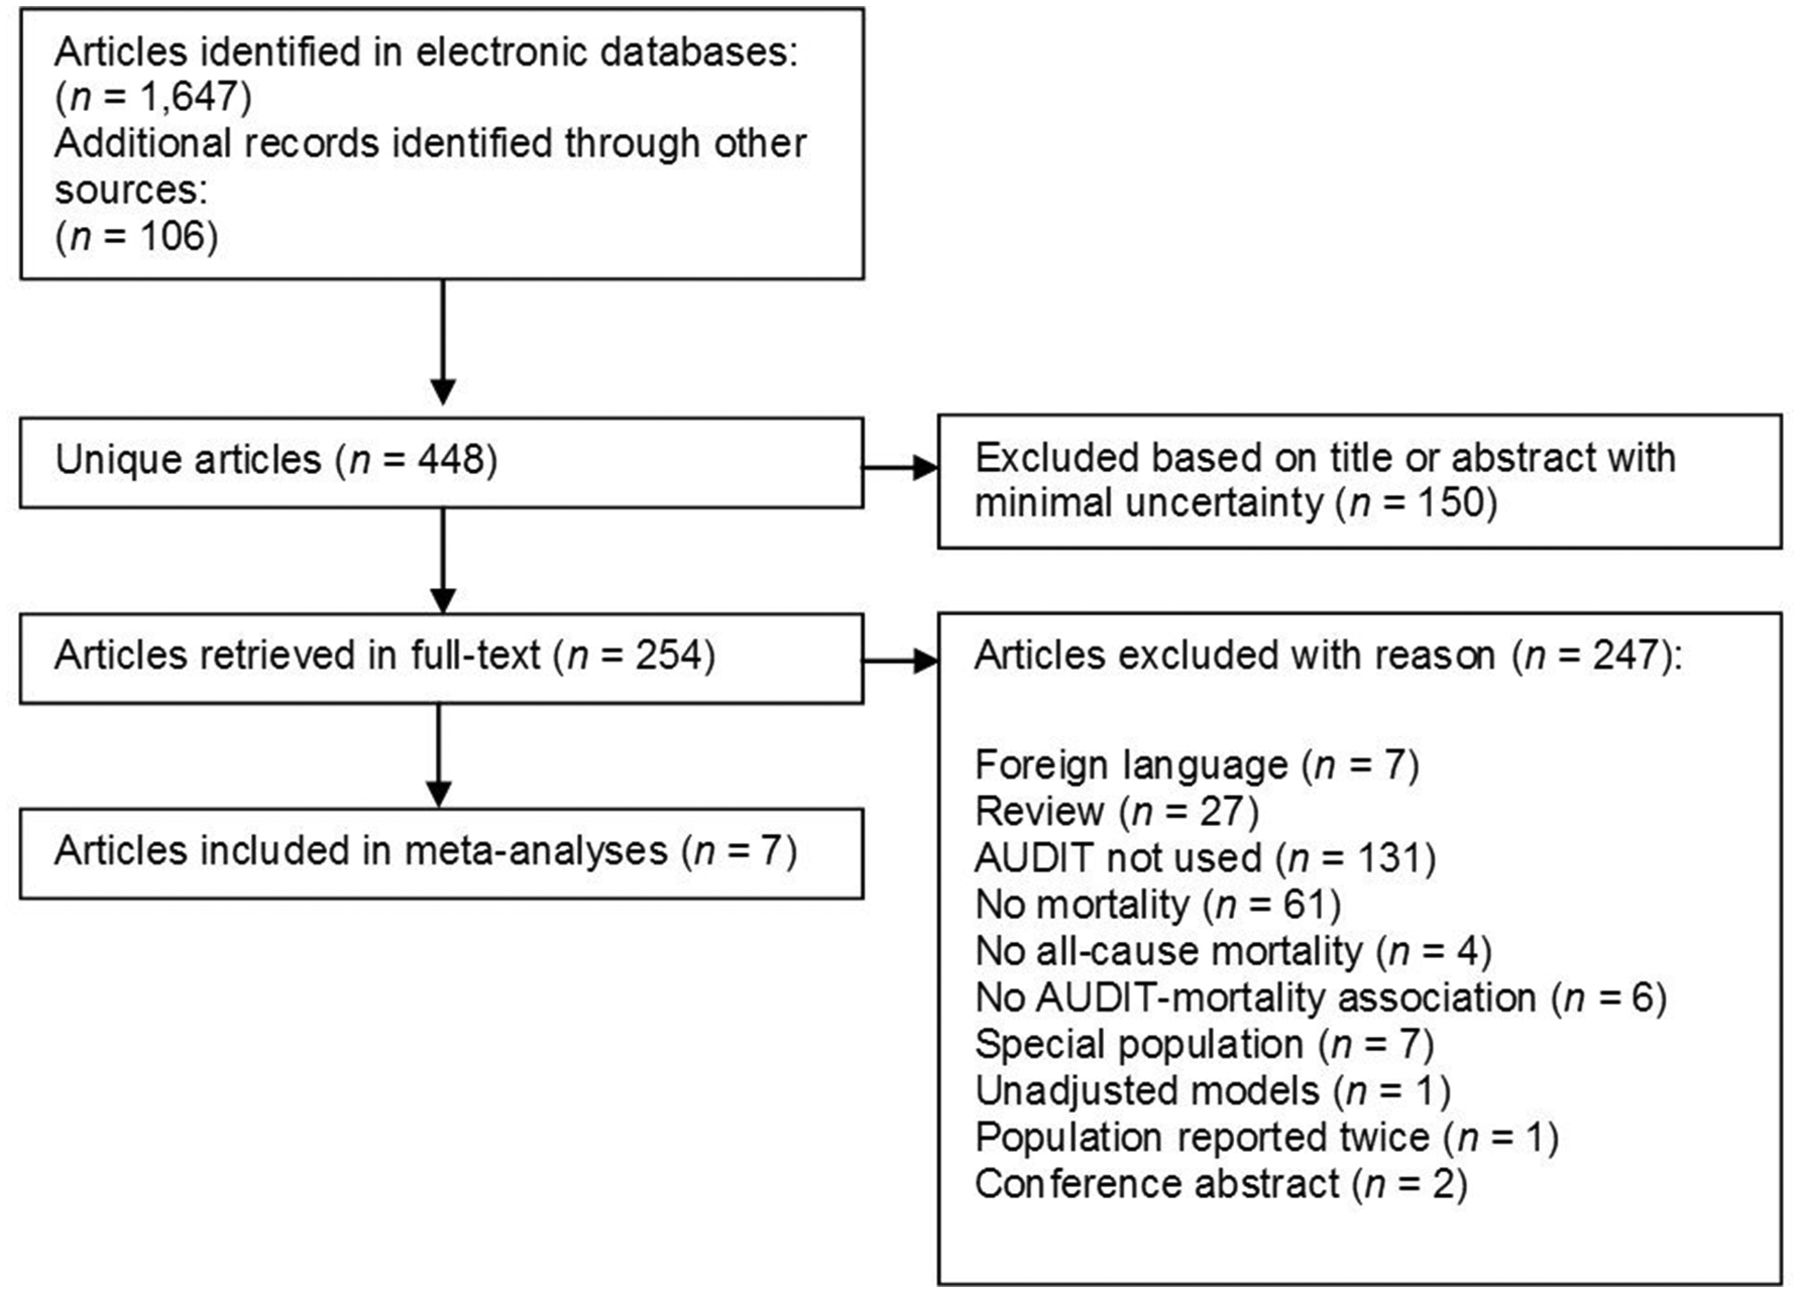
After removal of duplicates, 448 unique references were screened for inclusion. Of those, after exclusion based on title and abstract, 254 papers were obtained in full text. In total, seven unique cohort studies met the inclusion criteria for a quantitative analysis (figure 1). Four studies (97% of all participants) were conducted in the USA (all VA samples) (ie, refs 15 21–23) and one each in South Korea (survey of elderly population in a rural area),24 India (Goa area)25 and Russia (city of Arkhangelsk).26 The analyses were based on 309 991 participants with 18 920 reported deaths (18 493 men and 319 women). Weighted mean age was 53 years (54.4 among VA samples and 45.5 among population-based studies). Mean follow-up time ranged from 2 years15 to 10.2 years,26 with a weighted average of 2.4 years for VA samples and 8.1 years for population-based studies. Each study adjusted for risk factors, such as age, depression, smoking status or education, suggesting adequate study quality reflected in the NOS ratings (for details, see table 1).
Characteristics of seven cohort studies predicting all-cause mortality through Alcohol Use Disorders Identification Test (AUDIT) scores, 1989–2016

PRISMA flow chart. AUDIT, Alcohol Use Disorders Identification Test; PRISMA, Preferred Reporting Items for Systematic reviews and Meta-Analyses.
AUDIT and all-cause mortality
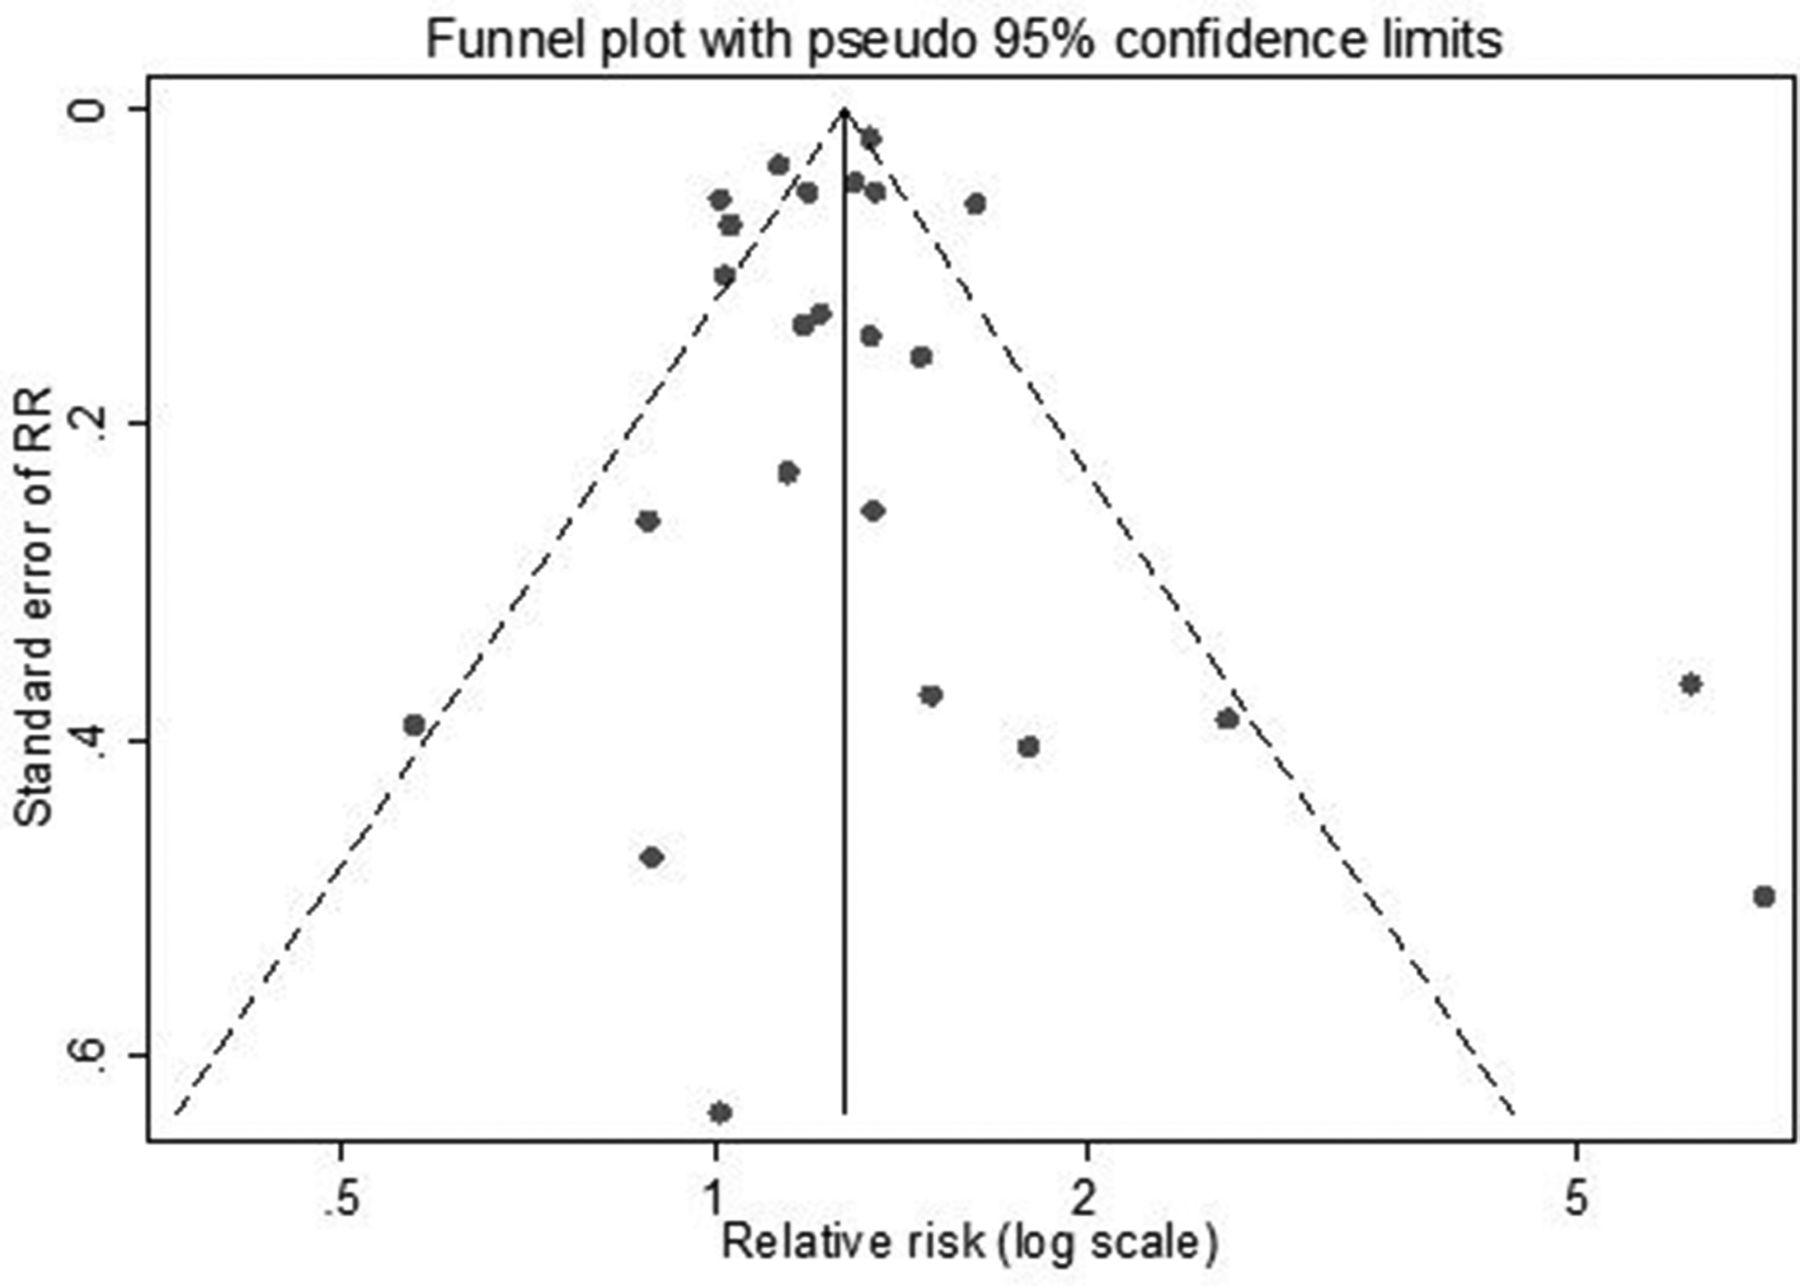
There was no evidence for publication bias based on Egger’s regression-based test (p=0.92) or based on visual inspection of the funnel plot (figure 2). The comparison between moderate drinking (assessed with either the full or abbreviated version of the AUDIT (AUDIT-10=1–7; AUDIT-C=1–3)) and current abstention (AUDIT-10=0; AUDIT-C=0) yielded an RR of 0.78 (95% CI 0.71 to 0.85; table 2, figure 3A). When compared with current abstention, at-risk drinking (AUDIT-10 ≥8; AUDIT-C ≥4) showed a similar risk for death (RR=1.18, 95% CI 0.92 to 1.52; figure 3B). When compared with moderate drinking, the overall pooled RR for death for at-risk drinking significantly differed from one with RR=1.24 (95% CI 1.12 to 1.36; figure 3C). In order to control for a potential overlap of Ambulatory Care Quality Improvement Project (ACQUIP) samples in Bradley et al 21 and Kinder et al,23 we conducted a sensitivity analysis without21 that indicated no changes in results.
Alcohol Use Disorders Identification Test (AUDIT) scores and all-cause mortality by setting, 1989–2016

Funnel plot for drinking groups (AUDIT-10 and AUDIT-C), both sexes, 1989–2016. RR, relative risk.

Comparing current abstainers (AUDIT-10=0 or AUDIT-C=0), moderate drinking (AUDIT-10: 1–7 or AUDIT-C: 1–2 or 3) and at-risk drinking (AUDIT-10: ≥8 or AUDIT-C: ≥3 or ≥4), both sexes, 1989–2016. RR, relative risk.
Meta-regressions to investigate the difference between settings showed that across all drinking groups, VA samples showed a significant lower mortality risk compared with population-based studies (pooled RR = 0.68 , 95% CI 0.50 to 0.94). When stratified by setting, the mortality risk was U-shaped in VA studies (ie, moderate drinkers had a significant lower risk compared with abstainers and at-risk drinkers). In population-based studies, there was no association between current moderate drinkers and abstainers, and at-risk drinking was associated with higher risk compared with abstainers (table 2). Statistical heterogeneity was low in most analyses; however, statistical power to detect heterogeneity was low. Excluding studies one-by-one did not show any substantial influence from one single study.
Discussion
In our systematic review and meta-analysis, at-risk drinkers as identified by the AUDIT were associated with higher mortality risk than moderate drinkers. The vast majority of the data came from register-based male VA samples using the AUDIT-C in studies. In VA samples, mortality risk among moderate drinkers was lower compared with current abstainers. In population samples, the risk among moderate drinkers was similar to current abstainers. Population-based studies were more heterogeneous with mean age ranging from 32 to 76 years and from countries or regions with various drinking cultures. Few data were available for women.
Because the sample size was much larger for studies using the AUDIT-C (VA samples), CIs were much smaller compared with analyses using only the AUDIT-10 (population-based samples). Population-based studies showed a higher RR compared with VA samples for all drinking groups.
What might explain these differences in mortality risk between VA samples and population-based studies? Because of the relatively low number of studies identified, a separation into VA and population-based studies is also a separation into AUDIT-C and AUDIT-10, shorter follow-up and higher age, and therefore we cannot be sure that study setting was the determinant factor in the heterogeneity we observed in pooled effect sizes.
It may be that current abstainers comprised of a large portion of former drinkers, which are likely to have higher mortality risk. In other words, it may be that the U-shaped association found in VA samples is explained by both a high baseline risk across drinking and non-drinking groups and a bias due to former drinking.27 28 However, the evidence is conflicting. One study has shown that the prevalence of alcohol drinking, binge drinking and Alcohol Use Disorder (AUD) may be higher in military personnel and veterans compared with the civilian population,29 while another study has found no differences.30 Adding questions on past drinking behaviour to the AUDIT may shed light on the role of heterogeneity among current abstainers and its relationship with mortality risk. Furthermore, AUDIT-10 scores combine two sources of information: alcohol consumption (ie, AUDIT-C) and AUD-related problems.5 Both might differ over time in their contribution to the total AUDIT score,31 and both might be related to separate risks for alcohol-related morbidity and mortality.
Limitations
As all meta-analyses are, our meta-analysis was subject to the limitations of primary studies identified and examined. All exposure measurements were restricted to one point in time and alcohol consumption can change over the life course and a single measurement may result in misclassification even among lifetime abstainers.28 In Veterans in particular, lifetime prevalence of AUD can be as high as 40%.32 33 Current abstainers may include lifetime abstainers and former drinkers who differ in mortality risk because of past drinking.28 We were unable to investigate the potential bias; this may have introduced on the overall relationship with mortality. However, it is very likely that such bias, which has been shown for several disease outcomes, was present. Aside from this potential bias, among current drinkers, mortality risk was increased in at-risk drinkers.
One study used a cut-off of ≥5 for the AUDIT-C.15 Nevertheless, results of this study were in agreement with the overall association found. It should be noted that, although not included in our meta-analysis because it was a cohort with a severe disease, Justice et al 22 showed that among US Veterans, the risk curve for all-cause mortality predicted by the AUDIT-C was much steeper among patients with HIV compared with non-HIV-positive Veterans.
Participants in VA samples were older than the general population and mostly male. Veterans are associated with high prevalence of post-traumatic stress disorder and other mental and somatic disorders,32–34 as well as lower socioeconomic status.35
A strength of our analysis is that all studies controlled for other important health behaviours and illnesses, both of which co-occur with alcohol use and likely influence mortality risk aside from alcohol consumption.36 Importantly, mortality risk differed by study setting and population. Because of the low number of studies, we were unable to investigate other potential effect modifiers, such as sex, age or drinking cultures.
Implications
Our results show that the AUDIT screening tool in both its full and abbreviated version is able to predict mortality risk among current drinkers. The application of either AUDIT version provides an opportunity for intervention in at-risk drinkers and thus reduce the large contribution of alcohol consumption to mortality in many countries. Including a question on former hazardous or harmful drinking or alcohol dependence symptoms to the AUDIT may further improve predictability of mortality risk. Given the clear increase in mortality risk among current drinkers across studies, there is a need to investigate the ability to predict mortality risk by AUDIT tools in populations with differing drinking cultures and particularly among young and middle-aged adults and women to allow for greater generalisability.
When mortality is the outcome of interest, the AUDIT-C may be preferred over the full AUDIT as it is less time-consuming than comparable quantity–frequency measures8 37 and cheaper than assessing biomarkers, which have their own problems in identifying current alcohol consumption.38 Although the full AUDIT may outperform the AUDIT-C in general population and inpatient samples in detecting alcohol use disorder,7 10 it might be useful to focus on the volume and pattern of alcohol consumption (AUDIT-C),31 which in turn may be the best determinants of alcohol-related harm and mortality. Furthermore, in students and emergency-department populations, the long version may be ineffective,39 while the AUDIT-C seems appropriate.8 31
Conclusions
The AUDIT showed good predictability of mortality risk among current drinkers. Further research is necessary to evaluate the relative effectiveness and usefulness of each version in detecting mortality risk among younger adults, women and various drinking cultures.
What is already known on this subject
The Alcohol Use Disorders Identification Test (AUDIT) is a time-effective screening tool invented for the identification of at-risk alcohol consumption throughout different settings.
There are, however, no systematic reviews or meta-analyses that evaluate the ability of the AUDIT to predict all-cause mortality, which in turn is highly associated with alcohol consumption.
What this study adds
In our systematic review and meta-analysis of population studies, we found that at-risk drinking (according to AUDIT scores) was associated with higher mortality risk compared to moderate drinking.
Overall, the AUDIT scores were predictive for mortality risk among current drinkers.
Further research is necessary to make assumptions beyond US Veteran samples, that is, among younger adults, women and various drinking cultures.
Acknowledgments
SK-P is indebted to Dr Michael Höfler, Paula T Kuitunen, Lucie Scholl and Ruth Schmidt for their support in conducting the analyses and commenting on earlier versions of this manuscript. We would like to thank Drs Amy C Justice and Oleg Sidorenkov for providing additional information.
References
Footnotes
Contributors MR conceived, designed and oversaw the study. Both authors acquired the data, performed the statistical analyses, contributed to the interpretation of the data, and drafted the manuscript. In agreement with the ICMJE guidelines, all authors critically revised the manuscript for intellectual content and read and approved the final version of the manuscript for publication.
Funding This research was partially supported by grants WI 709/10-1 and WI 709/10-2 of the German Research Foundation (Deutsche Forschungsgemeinschaft (DFG), FOR 1617).
Competing interests None declared.
Patient consent Not required.
Ethics approval Approvals of the primary studies were obtained as stated therein.
Provenance and peer review Not commissioned; externally peer reviewed.