Article Text

Abstract
Several independent analyses, by both epidemiologists and actuaries, have concluded that the previous rate of improvement of life expectancy in England and Wales has now slowed markedly, and at older ages may even be reversing. However, although these findings have led the pension industry to reduce estimates of future liabilities, they have failed to elicit any significant concern in the Department of Health and Social Care. In this essay, we review the evidence on changing life expectancy, noting that the problems are greatest among older women. We then estimate the gap between what life expectancy is now and what it might have been had previous trends continued. At age 85, the gap is 0.34 years for women and 0.23 for men. We argue that recent changes cannot be dismissed as a temporary aberration. While the causes of this phenomenon are contested, there is growing evidence to point to the austerity policies implemented in recent years as at least a partial explanation. We conclude by calling for a fully independent enquiry to ascertain what is happening to life expectancy in England and Wales and what should be done about it.
- mortality
- demography
- avoidable deaths
Statistics from Altmetric.com
Introduction
In July 2017, the UK’s Institute of Health Equity, using data from the Office for National Statistics (ONS), released a briefing on faltering improvements in life expectancy at birth in England. It showed that the previous increases of 1 year every 5 years for women, and 1 year every 3.5 years for men, had slowed since 2010 to 1 year in every 10 for women, and 1 in every 6 for men.1 The head of the institute, Professor Sir Michael Marmot, said he was ‘deeply concerned’ and called for work to discover what had happened as a ‘matter of urgency’.2 In particular, he noted that this could not be dismissed as the population reaching the biological limits of longevity, as life expectancy in the UK continues to lag behind that achieved in many other affluent countries.
The response by the UK Department of Health (DoH) failed to address his specific points, instead stating that ‘Life expectancy continues to increase, with cancer survival rates at a record high whilst smoking rates are at an all-time low’.2 Their first point was not disputed; Marmot’s concern was that the rate of improvement had slowed markedly rather than stopped. The second point was at best only partly relevant, and the third completely failed to address the concerns raised.
This is not the first time such concerns have been reported, or that the DoH has dismissed them so abruptly. In early 2017, our research in the Journal of the Royal Society of Medicine (JRSM) raised the alarm about an increase in deaths in England and Wales, particularly in the older population, an analysis complicated by delays in publication of the necessary data.3 4 Although some of the increase could be explained by changes in the age structure of the population, there remained a substantial increase, concentrated among older people, that could not be. After reviewing other possible causes, like Marmot, we concluded that it was not possible to offer a complete explanation and that an urgent, thorough investigation was needed. We too received a dismissive response from a DoH spokesperson who stated: ‘this report is a triumph of personal bias over research’.
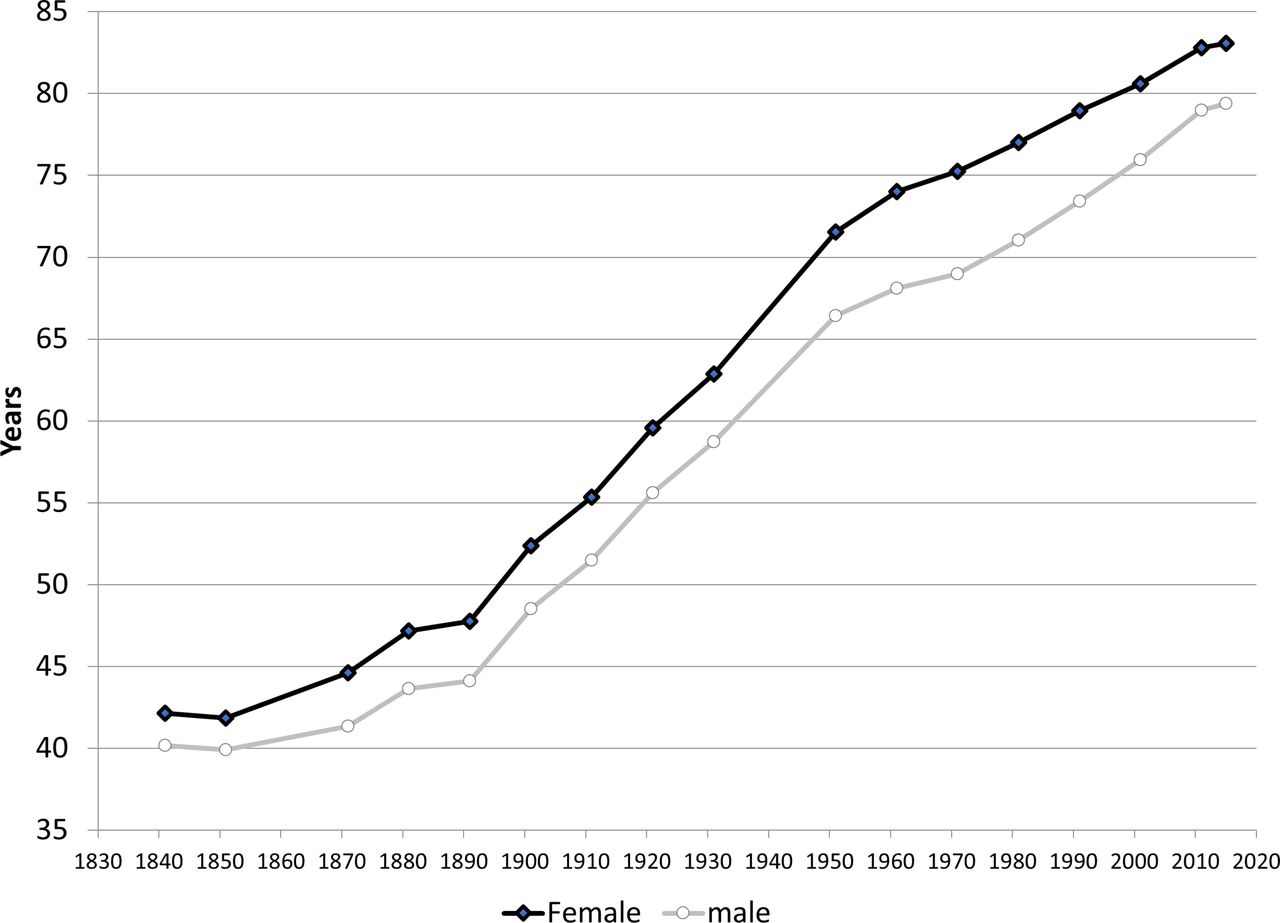
These concerns have not been assuaged by the most recent data on life expectancy for England and Wales, released by ONS in September 2017. Figure 1 is based on data from the ONS decennial supplement,5 compiled at 10-year intervals coinciding with censuses, which maximises the precision with which rates are calculated. It has been brought up to date using the very latest estimates of life expectancy published by ONS in September 2017.6 ONS life expectancy estimates are now based on age-specific mortality by individual year of age up to age 100, and so these estimates are not affected by any issues of ‘ageing within bands’.7

Life expectancy at birth in England and Wales, 1840–2016. Source: ONS.
The most recent period has seen one of the greatest slowdowns in the rate of improvement for both sexes since the 1890s (although there was also a marked slowdown for men in the 1960s) (figure 1).
Specifically, the most recent rate of improvement in life expectancy for either women or men in the most recent years (2010/2 to 2014/16) was between 2.1 and 3.5 times lower than at any time between 1981 and 2011. The previous decade that was most similar to the current one is 1881–1891. So far, we only have life expectancy data up until 2016. We will not be able to compare the whole of the current decade until 5 years from now. However, the current picture should be seen as sufficiently alarming to warrant serious investigation before then (before 2022). The most recent data on total number of deaths rising in 2017 (see below) and the response of the pensions industry add weight to this claim.
Although what is now the Department of Health and Social Care appears unperturbed by these recent trends, the pension industry has certainly taken note.8 Price Waterhouse Cooper estimates that ‘[a] sharp slowdown in the improvement to life expectancy could wipe £310bn from the pension deficits of thousands of UK companies with final salary schemes’, equivalent to a 15% reduction.9 There is some dispute over the final figure, but there appears to be no dispute in the pension industry that future life expectancies are likely to be lower than expected.10 This is especially important, given that those covered by this industry tend to be healthier than average.11 If we no longer expect people in the UK to live as long as we thought they would a few years ago, we need to know why.
We now consider the trends in life expectancy in the older population, compared with what could have been expected if previous trends continued, presenting evidence to refute claims by some that the trends seen are merely a ‘blip’. We argue that this demands an urgent independent investigation, with adequate resources and the power to obtain the necessary data for the detailed analyses we believe are required and to summon ministers and officials to give evidence.
Life expectancy for elderly people
Before 2012, life expectancy for elderly people was rising at an almost constant rate each year with some acceleration in the period immediately prior to 2011. This can be seen clearly in table 1, showing the change between consecutive 3-year averages (to smooth annual fluctuations). A very similar trend is seen for men and women and for life expectancy as measured from either age 65, age 75 or age 85. In every case, what had been consistent improvements declined markedly after ‘2008–2010’ and ‘2009–2011’. Given the consistency of the earlier trends, this reflected a marked increase in death rates in 2012. Worryingly, in the most recent period, in the oldest groups. there were actual declines. The worsening of life expectancy for women over 85 years was first raised as an issue of immediate concern over 3 years ago,12 yet it received little attention then and little since, despite becoming much worse year on year.
Change in life expectancy in England and Wales between overlapping time periods by age/sex (years)
Table 1 shows that there is no sign at all of the deceleration slowing down. What started in 2012 worsened dramatically in 2015, when deaths rose by 5.6%—the largest annual percentage increase since the 1960s.13 While there has been a slight recovery in the most recent data, the improvements are still less than half the size of those observed up until 2010/11. To explore this further, we now compare observed life expectancy with predicted trends calculated using regression techniques or ‘expected’ life expectancy.
Trends in life expectancy for the over 65s
The over 65s have borne the brunt of the deceleration in life expectancy gains. We have shown this in the crude differences in life expectancies and now examine the gap between expected life expectancy, if trends up to 2009–2011 had continued, and observed life expectancy, using data reported by the ONS, for people of ages 65, 75 and 85 years (figure 2).14 Note the axes in figure 2 do not start at zero.

Life expectancy at different ages, England and Wales.
The gap between the expected and the observed values varies from 0.49 years in women at age 65 years to 0.20 years in men at age 85 years.
However, it is not the slowing that is the most concerning. Although that should be considered an amber warning light, demanding investigation at least, any reversal in life expectancy should be considered a red danger sign. This can now be seen clearly for three groups following the change between 2012–2014 and 2013–2015. For female life expectancy at 75 years, there was a fall from 13.11 to 13.09 years; for women at age 85 years, a fall from 6.85 to 6.80 years and for male life expectancy at 85 years, a fall from 5.85 to 5.84 years. Life expectancy was not ‘continuing to increase’ for everyone at the time the DoH’s made its assertions.
A temporary change?
Politicians’ attempts to reassure the public that these changes are only temporary may be overly optimistic. Table 2 presents the same data but only reports changes between non-overlapping 3-year periods. The changes in the first two periods are very similar. In every case, there were rapid improvements in life expectancy for elderly people, which either stayed the same or improved slightly until 2012. Then, in the most recent 3-year period, the improvement for men from age 65 has more than halved (0.65 to 0.27). That for women aged 65 has reduced to just a quarter of what it had been (0.55 to 0.13). The most recent changes are worst for the very elderly (who are presumably the most frail or otherwise disadvantaged and potentially most susceptible to what is causing this recent trend). For men, aged from 85, the most recent improvement (0.02 years in 3 years) is a tenth of the previous rate of improvement. For women aged from 85, what had been a greater rate of improvement than among men of the same age (0.17 and 0.22 years) suddenly became a fall in life expectancy after 2011.
Change in life expectancy in England and Wales in 3-year time periods by age/sex (years)
The final column in table 2 shows the very latest data made available in September 2017. It compares 2011–2013 with 2014–2016 and shows that there has been no end to the slowdown in improvements. The latest provisional weekly deaths for England and Wales from January to October 2017 show a crude increase of 15 605 deaths compared with the average of the corresponding weeks over the past 5 years.15
There is, therefore, no sign yet that the pattern that emerged in 2012, and which worsened in 2015, is temporary. Evidence from a longer period in the USA shows that there are no grounds for confidence that such deceleration in improvements, or even declines, will be as short-lived as some policy makers in the UK seem to assume.
The fact that the changes have systematically harmed women more than men, and the very elderly more than the younger elderly, suggests that it is those who have less access to resources of all kinds that have been hardest hit. Elderly women are far more likely to live alone and to be poor as compared with elderly men. People aged over 85 tend to be more frail, and, crucially, more likely to be dependent on a well-functioning health and social care system. As a Professor of Biogerontology has recently suggested ‘…it can be argued that the oldest people are highly vulnerable and that excess deaths among them – from underfunded services – are a major cause of the stalled life expectancy increases’.16
The search for causes
Any very large change in mortality trends must be taken extremely seriously. Life expectancy is the most important social statistic that any country produces about itself and it is often an early sign of wider societal problems, as in the former USSR in the 1980s17 or in the USA more recently. American life expectancy at birth stalled between 2010 and 2014 and, in 2015, actually declined, with rising rates from causes that have been described as ‘deaths of despair’18 concentrated among the poor in states that had experienced the greatest economic and social decline.19 This has political consequences; those counties in which life expectancy stagnated or declined experienced the largest increases in Republican votes in the 2016 Presidential election.20
Some other European countries have seen slowing of improvements in life expectancy but, crucially, not all, and not to the extent seen in England and Wales. Whether comparison of the economic choices made by those countries whose life expectancy has continued to improve, such as Norway and Finland, to those who have seen stalling, such as France21 and Germany, may help understand this remains to be seen, although some caution is required given differences in recording of deaths occurring among people temporarily abroad, a particular issue for older people from some Northern European countries. For now, we are only able to hypothesise.
Our previous search for causes of these reversals in trends in England considered the possibilities of data artefact; environmental events such as war, natural disaster or unusually cold weather; influenza and failings of the health and social care system.
One argument sometimes advanced is that, in the UK, life expectancy is reaching a theoretical maximum, so some slowing in the rate of improvement is inevitable. Yet, other countries, such as Japan, show that the UK is still far from what can be achieved with existing knowledge. Moreover, the overall slowing conceals how life expectancy is actually falling in some parts of England.22 Influenza is likely to have played some role, but even if it did, questions remain as to why, as with excess winter mortality, people living in the UK seem to have been more likely to die from it than in some other European countries. Importantly, others have suggested that influenza may be overstated as a cause of otherwise unexplained premature deaths, at least in the USA,23 where reversals in life expectancy have been similarly poorly addressed.24
Those most affected by the rise in mortality and stalling, and in some cases reversing, of life expectancy, the elderly, are also the group most reliant on a well-functioning health and social care system. In the context of the relentless underfunding of the health and social care system since 2010, we pointed to evidence that suggested a possible link between these two factors, requiring urgent review. As long ago as February 2014, we wrote that ‘The 2012–2013 rise appeared to be more of a trend’ and suggested austerity as the mostly likely immediate cause.12 Subsequent research noted how the narrowing gap in life expectancy between the most and least deprived local authorities, which coincided with the government strategy to reduce inequalities that ended in 2010, began to widen between 2012 and 2015.25
There are alternative suggestions, including a possible infective agent other than influenza.26 However, the main debate is about whether it is still too early to conclude that what is observed is the beginning of a trend that should cause concern. The situation is complicated by delays in publication of detailed data and questions of how it should be interpreted.7 In July 2017, Public Health England reviewed possible causes, including population changes and influenza, including international comparisons, concluding there was not enough evidence as yet to show a change in trends.27 Yet, as noted above, the Institute and Faculty of Actuaries disagrees and has revised its projection of life expectancy downwards, reducing predicted pension liabilities by billions of pounds.8 Furthermore both the life expectancy data released by ONS in September 2017 and the continued high raw death counts (recognising the need for more detailed analysis when the necessary data on deaths by detailed age category become available), adds more weight to the argument that we have now seen enough to know that something very important has changed.
It is essential, for many reasons, that the divergent views over what the causes might be are resolved. The answer has implications for fiscal, health and social policies, among many others. Most recently, Sir Michael Marmot has called for an urgent investigation into whether spending cuts are impacting length of life, with evidence that they have already impacted on quality of life.28 Other research has found a link between cuts in payments to pensioners and mortality29 and delay in National Health Service discharges and mortality.30 Most recently, research implicated ‘spending constraints’ as contributing to 45 368 (95% CI 34 530 to 56 206) extra deaths from 2010 to 2014, compared with pre-2010 trends, predominantly in people aged over 60 years and living in care homes.31 Correlation is not proof of causality, as all epidemiologists know. However, in the absence of a clear explanation or simple research method that could confirm a causal relationship between underfunding and increased mortality, simply dismissing the possibility is not justifiable. Correlation is not always coincidence.
All this strengthens the case for inquiring into a possible relationship between underfunding and mortality. The need for answers is now even more urgent than it was last year, given the likely impact of Brexit on government finances and the threat to recruitment of health and social care staff already being experienced.32 The question then is who should do this inquiry? Researchers can, and must contribute to the analyses, but the questions raised go beyond what can be answered by demographic analyses, raising important political issues. However, researchers, whether in non-governmental organisations or universities, lack the power to require production of the necessary data to answer the key questions.
Once, questions of this nature might have been addressed by a Royal Commission, but these have gone out of favour and, anyway, they would have to be convened by ministers who show little inclination to do so in this case. The urgency of finding an answer suggests that public inquiries, such as those into the Iraq War or Bloody Sunday, are unlikely to be appropriate or speedy. The one body that does have the legitimacy to conduct such an inquiry, coupled with the necessary powers to summon witnesses and require data to be made available, is parliament, with the health committees of the Commons and the Lords providing the obvious mechanisms.
Conclusion
Concerns about life expectancy have been raised by academics at least twice in 2017, and twice the DoH’s responses have been disappointing, even attacking the researchers involved. Life expectancy in England and Wales has stalled, and in some cases reversed, yet there is no consensus as to why. There is a growing suspicion that prolonged austerity is likely to matter greatly. Opinions as to the cause range from cuts in health and social care,3 4 epidemic disease26 and statistical artefact.7 All of these must be explored. What is indisputable is what the data now clearly show. This is not temporary. An independent investigation is urgently needed, requiring time, resource and authority to be carried out. If ministers are not prepared to ask the appropriate questions, someone else must.
Footnotes
Contributors All authors contributed equally.
Competing interests DD, DH and MM sit on the Public Health England mortality group.
Patient consent Not required.
Provenance and peer review Commissioned; externally peer reviewed.
Data sharing statement All data used are in the public domain.