Article Text

Abstract
Background Taxing soft-drinks may reduce their purchase, but assessing the impact on health demands wider consideration on alternative beverage choices. Effects on alcoholic drinks are of particular concern, as many contain similar or greater amounts of sugar than soft-drinks and have additional health harms. Changes in consumption of alcoholic drinks may reinforce or negate the intended effect of price changes for soft-drinks.
Methods A partial demand model, adapted from the Almost Ideal Demand System, was applied to Kantar Worldpanel data from 31 919 households from January 2012 to December 2013, covering drink purchases for home consumption, providing ~6 million purchases aggregated into 11 groups, including three levels of soft-drink, three of other non-alcoholic drinks and five of alcoholic drinks.
Results An increase in the price of high-sugar drinks leads to an increase in the purchase of lager, an increase in the price of medium-sugar drinks reduces purchases of alcoholic drinks, while an increase in the price of diet/low-sugar drinks increases purchases of beer, cider and wines. Overall, the effects of price rises are greatest in the low-income group.
Conclusion Increasing the price of soft-drinks may change purchase patterns for alcohol. Increasing the price of medium-sugar drinks has the potential to have a multiplier-effect beneficial to health through reducing alcohol purchases, with the converse for increases in the price of diet-drinks. Although the reasons for such associations cannot be explained from this analysis, requiring further study, the design of fiscal interventions should now consider these wider potential outcomes.
- Alcohol
- SSB
- Economics
- elasticity
- Tax
This is an Open Access article distributed in accordance with the Creative Commons Attribution Non Commercial (CC BY-NC 4.0) license, which permits others to distribute, remix, adapt, build upon this work non-commercially, and license their derivative works on different terms, provided the original work is properly cited and the use is non-commercial. See: http://creativecommons.org/licenses/by-nc/4.0/
Statistics from Altmetric.com
Introduction
With the global prevalence of obesity and associated health risks rising,1 2 health-related taxes have become an established policy option intended to reduce energy intake. Many of these have focused on sugar-sweetened beverages (SSBs), due to their consistent association with energy intake, weight gain, and risk of cardiovascular disease and type two diabetes.3 Hungary, Finland, France, Belgium, Portugal, Mexico, Chile, Thailand, Saudi Arabia and United Arab Emirates are among the countries that have recently applied taxes on SSBs at least partly due to population health concerns.4 In the USA, at least five local jurisdictions currently have a health-related tax on sugary drinks, while cities of Seattle and San Francisco propose to implement one in 2018.4 There are similar plans across a number of other countries such as India, the Philippines, Indonesia, Israel and South Africa.5 The UK government has confirmed an industry levy to incentivise producers to reformulate their products or, if not, to increase the price of SSBs.6
A number of studies have modelled the potential impact of food-related taxes on health outcomes.7 8 While economic theory predicts an inverse relationship between the price of SSBs and the quantity purchased, and hence consumed, people allocate their budget between many different foods and beverages based on their relative prices, making it imperative to consider the inter-relationships between the subject of the tax (SSB) and other drinks and foods.9 The net effect of a price increase of SSB on energy intake is thus ambiguous. For instance, when the price of an SSB increases, consumers may shift their consumption towards other energy-containing beverages, such as juices, milk-based or alcoholic drinks. If so, daily energy intake might be unaffected, or even increased. Alternatively, they may shift consumption towards diet drinks or water, leading to a net reduction in energy intake. Further, the effect of price increases is likely to be heterogenous, as price responsiveness will vary across income groups,10–12 and consumption intensity, with high consumers of SSBs being potentially less sensitive to price changes.10 13 14
Research suggests that increasing the price of SSBs generates a small, but significant, reduction in their purchase (broadly, a 10% price rise reduces purchase by 6%–8%), with a more pronounced effect in poorer households, and that substitution towards other soft-drink categories only minimally offsets the energy reductions achieved through decreases in SSBs.12 15–23 However, little is known of the potential effects on consumption of alcoholic beverages. Beer and wine provide on average 43 and 85 kcals per 100 mL, respectively, in comparison to 40 kcal in 100 mL of Cola drink. Adults in the UK on average consume 106 kcals per head per day from alcoholic drinks, compared with 98 kcal from SSB.24 The two studies that have considered both alcohol and SSBs have found no significant associations,15 22 but this could be due to modelling alcoholic and non-alcoholic drinks separately, where consumers first allocate their expenditure between broad food and beverage categories (ie, between ‘non-alcoholic drinks’ and ‘alcoholic drinks’) and then in a second step between more disaggregate groups within these broad categories (eg, among different types of ‘non-alcoholic drinks’). This restricts the ability to examine relationships between alcohol and non-alcohol-based drinks directly.
Overall, our understanding of how public policies to increase the price of SSBs may affect the consumption of alcoholic drinks, and hence total energy intake, remains very limited. The research presented here is the first to provide a direct analysis of the relationship between price increases for SSBs and alcohol purchases, across different income groups.
Methods
To estimate the relationship between a change in price of SSBs, and associated purchase of SSBs, other non-alcoholic and alcoholic beverages, we used a partial demand model, adapted from the Almost Ideal Demand System (AIDS) to household expenditure data from January 2012 to December 2013, provided by Kantar Worldpanel. Kantar Worldpanel includes information on household expenditures from a sample of GB households (~32 000), representative of the population with respect to household size, number of children, social class, geographical region and age group, on food and drink purchases for home consumption made in a variety of outlets, including major retailers, supermarkets, butchers, greengrocers, and corner shops. The dataset consists of individual transactions (entered by the household using scanners for barcodes, or manual entry where there is no bar code), providing detailed information on the day of purchase, outlet, amount spent, and volume purchased. In addition, Kantar Worldpanel annually collects socio-demographic information for each household, such as household size and composition, income group, social class, tenure and geographical location (postcode district), as well as age, gender, ethnicity and highest educational classification of the main shopper. Analysis is at the level of the household, not each individual within that household (ie, we can observe what the household purchased in terms of beverages, but not which individual – such as child or adult – consumed them).
The full dataset consists of 31 919 households, of which 80% appear in both years (25,535), providing ~6 million beverage purchases disaggregated at the brand and package level, which were aggregated into 11 distinct beverage groups for this study: (i) high-sugar drinks, containing more than 8 g sugar/100 mL (assuming a dilution rate of 1:4 as used by the British Soft Drinks Association for concentrated SSBs); (ii) medium-sugar drinks, with 5–8 g sugar/100 mL; (iii) diet/low-sugar drinks, with less than 5 g sugar/100 mL; (iv) fruit juices; (v) milk-based drinks (excluding pure milk); (vi) water; (vii) beer; (viii) lager; (ix) cider; (x) wines; and (xi) spirits. Note that the high-, medium-, and low-sugar drinks are grouped to match the structure of the proposed levy on sugary drinks producers in the UK which will be enacted in April 2018.6 As many beverages are storable and not purchased very frequently, data was aggregated at 4 week intervals for each household, providing a total of 575 965 household-month observations. Even at this level of aggregation, a substantial amount of zero expenditure months remain, as most households do not buy beverages from each category of drinks every month, and some households never buy certain categories during the whole sample period (ranging from 15% for fruit juices to over 50% for cider). A two-step procedure was followed to take account of this censoring of the dependent variable in the estimation strategy. The AIDS approach was adapted for the panel data context to allow control for unobserved household heterogeneity via a fixed effects specification. The full specification, including the procedures for handling censoring, endogeneity of prices and total expenditure, and estimation of price elasticities is provided in online supplementary appendix 1.
Supplemental material
Results
Table 1 presents the socio-demographic profile of the sample. A comparison of Kantar Worldpanel with representative household data from the Living Cost and Food survey (LCF) has found the sociodemographic and regional profiles of the samples to match well, although our sample has a slightly higher share of (i) low-income households, (ii) households that own a computer and/or a car, and (iii) households in the South and Southeast of England.25
Demographic characteristics of study sample
Table 2 presents average expenditure, volume and expenditure shares across all households and split into three income groups. The critical aspect for analysis here is the expenditure share, where there is a clear social gradient with respect to beverage expenditure. The low-income group spend 48% of total drink expenditure on the three soft-drink groups, compared with 44% and 39% for medium- and high-income groups respectively. The reverse is seen for juice drinks, with 12%, 13% and 16% spent respectively by low-, medium- and high-income groups. In terms of alcohol, spirits are purchased more by low-income households (9% vs 8% and 7%), whereas the reverse is the case for wines (where high-income group spends 22%, compared with 19% for the medium-income group and 15% for the low-income group). Most other categories have equivalent expenditure shares across the income groups.
Mean expenditure, expenditure shares and prices
The full results of the unconditional, uncompensated own- and cross price elasticities are presented in online supplementary appendix 2. In sum, we found that own-price elasticities for non-alcoholic drinks are lower than for alcoholic beverages (that is, alcoholic drinks are more sensitive to price change), and that elasticities for all three SSB groups are inelastic (ie, smaller than 1), which means that there is a less than proportionate decrease in purchase following a price rise. This also compares with relatively inelastic (ie, insensitive) reactions to changes in the price of alcoholic drinks (except for lager for low- and medium-income groups, and cider and wine for the high-income group).
Supplemental material
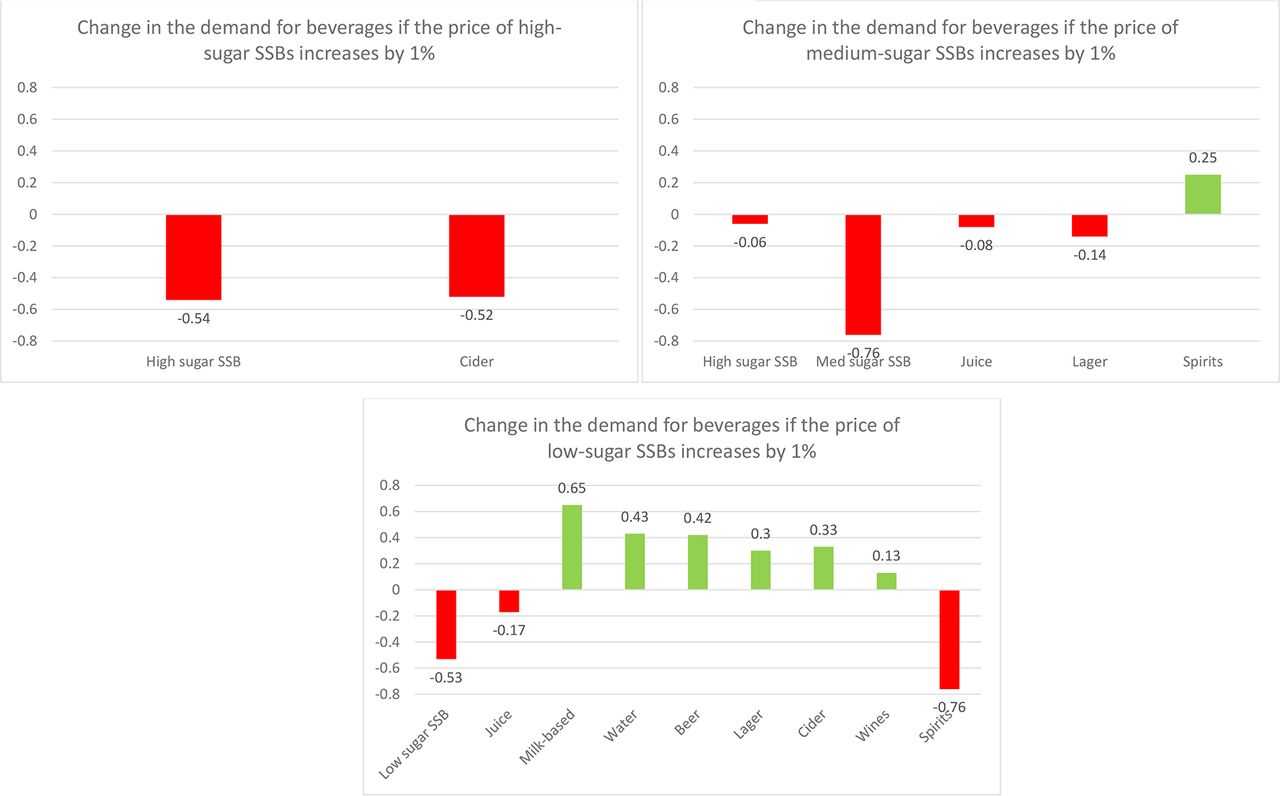
Of more interest, is the impact on alcohol purchases when the price of SSBs increases. Figures 1–4 present the (statically significant, P<0.05) impacts on alcohol beverage purchase from a change in price of (high- and medium-sugar) SSBs for the total sample (figure 1) and then for each income group (figures 2–4).

Change in the demand if price of SSBs increases (full sample, N=575 965). High-sugar SSBs include >8g of sugar per 100mL; medium-sugar SSBs include 5–8g of sugar/100mL and low-sugar SSBs have <5g of sugar/100mL.

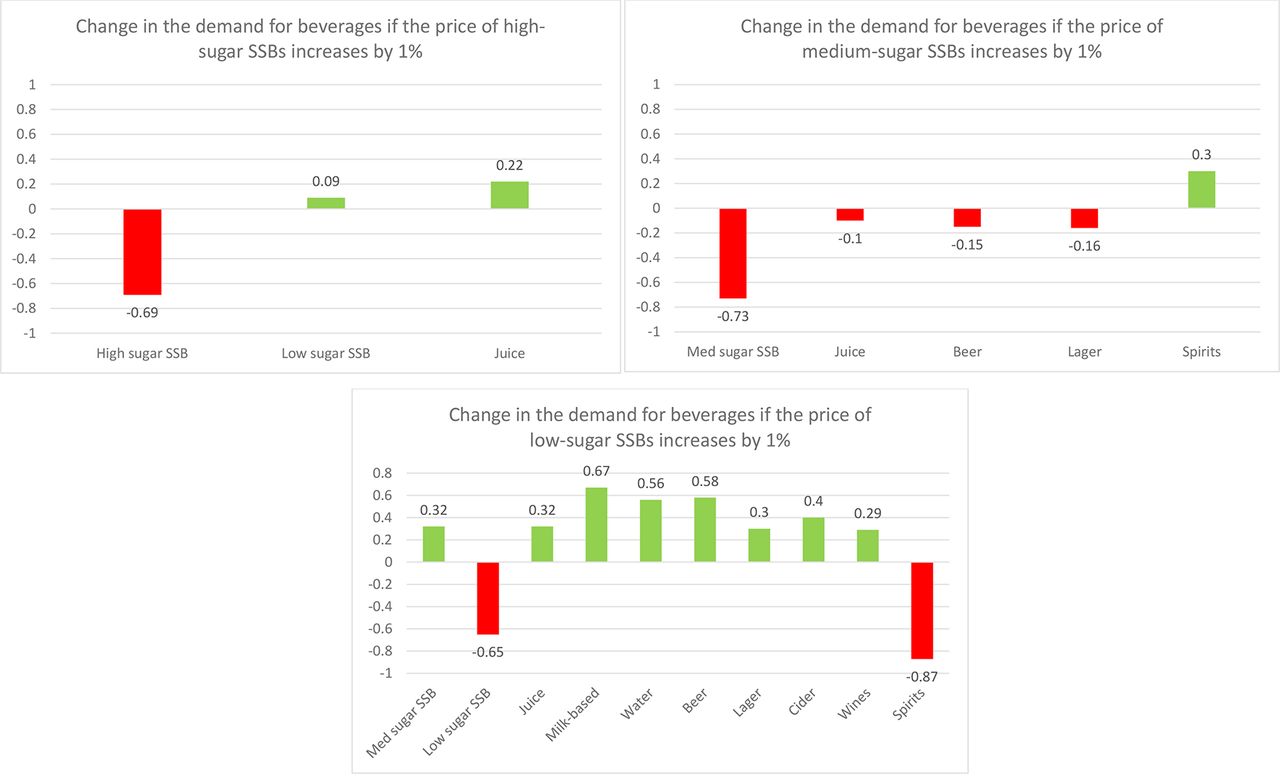
Change in the demand if price of SSBs increases (low-income sample; N=198 464). High-sugar SSBs include >8g of sugar per 100mL; medium-sugar SSBs include 5–8g of sugar/100mL and low-sugar SSBs have <5g of sugar/100mL.

Change in the demand if price of SSBs increases (mid-income sample; N=287 966). High-sugar SSBs include >8g of sugar per 100mL; medium-sugar SSBs include 5–8g of sugar/100mL and low-sugar SSBs have <5g of sugar/100mL.
Change in the demand if price of SSBs increases (high-income sample; N=89 535). High-sugar SSBs include >8g of sugar per 100mL; medium-sugar SSBs include 5–8g of sugar/100mL and low-sugar SSBs have <5g of sugar/100mL.
In aggregate across all income groups (figure 1) there are clear differences by category of SSB. Increases in the price of high-sugar SSBs are associated with increased purchases of diet drinks, juice and lager (ie, they act as substitutes), whereas they decrease purchases of medium-sugar SSBs and spirits (ie, they act as complements). Increases in the price of medium-sugar SSBs impacts across a wider range (high-sugar SSBs, juice, water, beer, lager, wines and spirits), although all categories affected witness reduced purchasing (ie, a consistent complementary relationship of ~0·1% for a 1% price increase). Increases in the price of diet/low sugar SSBs increases the purchases for all other categories (with the exception of the two other SSB categories), ranging from 0·1% for juice to 0·7% for milk-based drinks and spirits per 1% price increase.
Although many of the associations at the aggregate level are replicated across income groups, the effect of increasing the price of SSBs on purchases of other beverages shows some variance by income group, particularly for the high-income versus the low- and medium-income groups. In the high-income group, increases in the price of high-sugar SSBs decreases the purchase of cider (0·5% for 1% price increase), while in the middle-income group it reduces the purchases of spirits (0.2% for 1% price increase) but no decrease is evident in alcohol purchases in the low-income group. For medium-income groups there is also an increase in lager purchase if the price of high-sugar SSB increases. For an increase in the price of medium-sugar drinks, a common pattern is seen of complementary purchases, predominantly with juice and lager, across all income groups; although of different magnitudes.
Discussion
The own-price elasticities we found for SSB fall within the range reported in existing literature,7 and while the own-price elasticities for alcohol are higher than those found in meta-analyses,26–28 they are in line with recent studies for the UK.29 Overall this suggests some convergent validity of the current results, suggesting that price may be a more effective intervention for reducing alcoholic than non-alcoholic drinks.
In terms of cross-price elasticities, a price increase for SSB is likely to have a differential effect according to the sugar-content level of the SSB and across income groups. This mixed picture indicates the complexity of estimating the impact of a single price increase. Increasing the price of high-sugar SSBs leads to an increase in the purchase of lager, which could negate some of the beneficial impact of the reduction in purchase of SSBs. In contrast, a price increase for medium -sugar SSBs has the most significant impact as it produces a complementary reduction in several other beverages, many of which will enhance the impact on reductions in dietary sugar and energy intake. With respect to alcohol, this relationship is important as it suggest that a price rise could have small knock-on effects on beer, lager and wine purchases and thus multiply the health benefits from reduced SSB consumption by simultaneously reducing alcohol consumption. This suggests that it is important to consider the threshold of sugar content at which a price rise would be associated. The very different findings for a price increase on diet/low-sugar SSBs, which are associated with increases in alcoholic beverages (with the exception of spirits), provides a strong case for ensuring that diet drinks are excluded from price increases.
The responsiveness to price change for high- and medium-sugar drinks is slightly higher in low-income groups, especially relative to high-income groups and there are several significant impacts on expenditure shares for other beverages, including alcoholic purchases, which encompass a wider selection of alcoholic products. With one exception, these relationships are all complementary, indicating a reduction in alcohol purchase as the price of SSB increases, thus conferring potentially greater health benefits to those on lower incomes. However, most of this effect is driven by changes in price to the medium-sugar drinks.
The marked difference between those soft-drinks containing medium versus high levels of sugar is worth noting. Most policy, enacted or proposed, and research to date, has only distinguished between no or low-sugar beverages and ‘sugar-sweetened’ beverages, and so produced a binary relationship. The analysis presented here however indicates that collapsing SSBs into no-sugar versus sugar drinks may lose important nuances, and significantly that a price increase only on high-sugar content beverages will have a far lower cumulative effect than price increases which also include medium sugar drinks. Together with the likely adverse impact on alcohol purchases from increasing the price of diet/low-sugar beverages, policy may be more effective through a more nuanced consideration of price options across a range of beverages as in the soft drink industry levy proposed for the UK.
There are, of course, limitations to the analysis presented here. The data, although large, representative and detailed, may be subject to under-recording; and issues present in all types of survey data. For instance, while Kantar Worldpanel by design only collects data on purchases that are brought into the home and matches scanned data with scanned receipts to ensure accuracy, a comparison of Kantar Worldpanel data with the Living Cost and Food survey has shown that the former to have lower levels of recorded alcohol expenditure.25 Insofar as the under-recording of alcohol is higher than that of non-alcoholic drinks this might bias the estimated demand relationships. Regardless of the models used, estimating demand requires a number of assumptions (see online supplementary appendix 1), which may have influenced the estimates. We prioritised an approach that allowed controlling for unobservable household heterogeneity, including in the preferences towards different types of drinks, while also adjusting for non-purchase and endogeneity issues. In addition we identify the statistical significance of the estimates based on bootstrapped standard errors to overcome issues of remaining heterogeneity in the data as well bias arising from dealing with censoring. Overall, own-price elasticities are estimated with greater robustness as an a priori expectation of an inverse relationship with price exists and own prices have a noticeable impact on purchases. However, the estimation of substitution or complementarity effects across products are harder to capture, as these are generally much smaller and the direction cannot be assumed a priori for most beverages.30
Perhaps more critically, although this analysis can highlight significant relationships between beverages purchased, it cannot explain why these relationships exist. Why, for example, would an increase in price of high-sugar drinks appear to cause some mid-income households to reduce expenditure on them, but also increase their purchase of lager? It may be that it narrows the relative price difference to make lager appear more ‘affordable’, through changing the households’ cost-benefit calculations of SSB versus lager, but this sort of behavioural explanation requires further, primary, research. It may be easier to explain some of the complementary relationships – that for instance purchase of beer or wine falls as the price of SSB increases as there is less money available overall, or because for some drinks they are mixed, but again we cannot really understand the possible explanations without further primary research. Nonetheless, the presence of this range of significant substitute and complementary relationships between SSB and other alcoholic and non-alcoholic beverages suggests an urgent need for follow-up work based on with primary research to understand the reasons for the relationships.
In conclusion, increasing the price of SSBs has the potential to both decrease and increase the purchase of alcohol across all income groups. An increase in the price of high-sugar drinks may cause a significant increase in purchase of lager for the middle-income group and decrease in cider for the high-income group. An increase in the price of medium-sugar drinks tends to reduce purchase of beer, and lager across all income groups, generating a ‘healthy multiplier’ effect for the price increase. An increase in the price of diet/low-sugar drinks, however, generates increased purchase of all categories of alcohol with the exception of spirits. On balance, a policy to increase the price of SSB needs to consider the sugar-content level at which a price increase would be imposed to have most effect. Conversely, any policy that increases the price of diet/low-sugar drinks could produce substitution patterns to alcoholic drinks that is likely to be undesirable. This is important for proposed industry levies, such as that proposed for the UK, as industry is free to determine how to recoup the levy from consumers with an option to increase the price of all drinks, including diet drinks. If so, this could reduce the beneficial effects from a rise in the price of medium-sugar drinks and add negative effects from diet drink price increases through the increased purchase of alcohol. Although not definitive, the relationships found in this analysis are sufficiently robust to suggest that policies – and research – concerning the price of SSBs need to consider the effects beyond the SSBs targeted and support the need for further primary research on the behaviour patterns associated with alcoholic and non-alcoholic beverage choices.
What is already known on this subject
The WHO promotes taxation on tobacco, alcohol, and unhealthy foods, and particularly sugar-sweetened beverages (SSB) as a central government tool to reduce their consumption and prevent non-communicable diseases. Alcohol has been highly taxed for decades in many countries and there is by now a large body of literature on the price responsiveness for alcoholic drinks. With increasing interest in fiscal measures on unhealthy food and drink, research on the demand for SSB has grown over the past three decades. But, the demand interrelationships between them are unknown; important as both contribute to energy intake and come with their own set of health risks.
What this study adds
This is the first study to analyse the demand for non-alcoholic and alcoholic beverages in the same analysis, based on data from a representative sample of ~32 000 GB households for 2012–2013 providing ~6 million individual beverage purchases for at-home consumption, which are aggregated into 11 beverage groups. The study highlights the complexity of estimating the impact of a single price increase, for example, for SSBs. Increasing the price of SSBS has the potential to both decrease and increase the purchase of alcohol, suggesting more nuanced price options across a range of beverages may be more effective than a single tax on high-sugar beverages.
Acknowledgments
We would also like to thank our peer-reviewers whose thoughtful comments greatly enhanced the paper.
References
Supplementary materials
Press release
Files in this Data Supplement:
Footnotes
Contributors All authors contributed to the conceptual development of the research, review of analysis and interpretation of results. The analytical work was conducted primarily by DQ and LC, with supervision from RS.
Funding This study was funded by the UK Department of Health Policy Research Programme (107/0001-Policy Research Unit in Behaviour and Health). LC is funded by an MRC fellowship grant MR/L012324/1. The views expressed in this article are those of the authors and not necessarily those of the UK Department of Health. The UK Department of Health had no role in the writing of the manuscript but approved the decision to submit the manuscript for publication.
Competing interests None declared.
Provenance and peer review Not commissioned; externally peer reviewed.
Correction notice This article has been corrected since it was published Online First. Any references to ’Kantar WorldPanel' or ’KWP' have been corrected to ’Kantar Worldpanel'.