Article Text

Abstract
Perinatal morbidity scores are tools that score or weight different adverse events according to their relative severity. Perinatal morbidity scores are appealing for maternal–infant health researchers because they provide a way to capture a broad range of adverse events to mother and newborn while recognising that some events are considered more serious than others. However, they have proved difficult to implement as a primary outcome in applied research studies because of challenges in testing if the scores are significantly different between two or more study groups. We outline these challenges and describe a solution, based on Poisson regression, that allows differences in perinatal morbidity scores to be formally evaluated. The approach is illustrated using an existing maternal-neonatal scoring tool, the Adverse Outcome Index, to evaluate the safety of labour and delivery before and after the closure of obstetrical services in small rural communities. Applying the proposed Poisson regression to the case study showed a protective risk ratio for adverse outcome following closures as compared with the original analysis, where no difference was found. This approach opens the door for considerably broader use of perinatal morbidity scoring tools as a primary outcome in applied population and clinical maternal-infant health research studies.
- pregnancy
- perinatal epidemiology
- morbidity measure
- epidemiological methods
This is an Open Access article distributed in accordance with the Creative Commons Attribution Non Commercial (CC BY-NC 4.0) license, which permits others to distribute, remix, adapt, build upon this work non-commercially, and license their derivative works on different terms, provided the original work is properly cited and the use is non-commercial. See: http://creativecommons.org/licenses/by-nc/4.0/
Statistics from Altmetric.com
Introduction
Perinatal morbidity scoring tools are tools that score or weight adverse perinatal events according to their severity.1–5 The morbidity scores are an appealing choice for a primary outcome in research evaluating the risks and benefits of new perinatal interventions or exposures. Because maternity patients are mostly young, healthy women, serious adverse events (such as maternal mortality) are extremely rare. The morbidity scoring ensures that these serious events are not treated as interchangeable with considerably less serious events that must often included in a composite study outcome to ensure sufficient statistical precision.6–8 Further, by producing a numeric outcome score for each pregnancy, the scoring tools provide a strategy for combining the health outcomes of both mother and infant into a single endpoint.
Although calculating a perinatal morbidity score for each study participant is relatively straightforward, difficulties arise when researchers wish to test if perinatal morbidity scores are significantly different between two or more intervention or exposure groups. These difficulties impede the use of perinatal morbidity scores as the primary outcome of applied research studies. The objective of this report was to outline of why perinatal morbidity scores can be difficult to analyse using standard statistical approaches, summarise the limitations of previous strategies used to analyse morbidity scores and present the use of a simple count-based (Poisson) regression approach to overcome these limitations. We apply the approach to data from our recent study evaluating the safety of labour and delivery following the closure of planned obstetrical services in 21 rural hospitals in British Columbia, Canada.9
Overview of why perinatal morbidity scores can be problematic for standard statistical tests
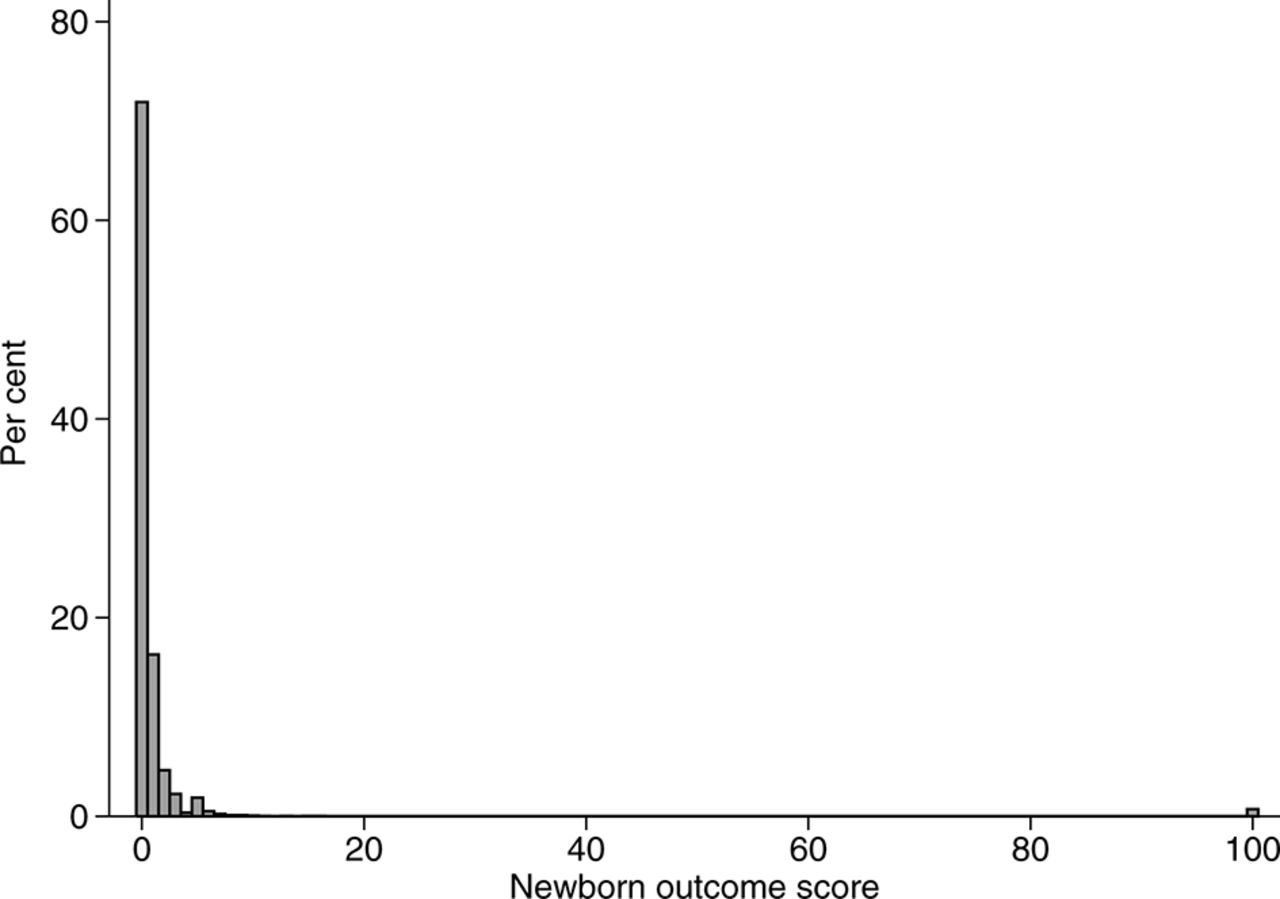
The statistical distributions of perinatal morbidity scores are not compatible with common analytical approaches, which leads to challenges when testing for differences between two or more study groups. Figure 1 illustrates a typical distribution of a perinatal morbidity score. In this example, over half the pregnancies are assigned a score of zero (because most pregnancies are healthy and deliver without complications) and the distribution has a long, irregular tail (because serious events, although rare, are assigned considerably higher scores than milder adverse events). The non-Gaussian distribution means that differences in scores between study groups should not be tested using a Student’s t-test or linear regression, and log or other standard data transformations do not achieve normality. A non-parametric test comparing medians (such as the Wilcoxon’s rank sum test) is also problematic because the median score in both groups will usually be zero, ignoring important differences in the distributions of the tails. The scored variable could be collapsed into a small number of categories for statistical analyses (or even a binary variable indicating the occurrence of one or more of the adverse events). However, doing so would lead to a loss of the detailed, continuous variable that was initially generated by the scoring tool, as well as the relatively greater difference in severity associated with the most serious outcomes.
Distribution of newborn outcome scores in a cohort of 11 066 infants published by Novicoff et al.2
Examples of strategies that have previously been used to analyse perinatal morbidity scores
The detailed numerical scores initially generated by scoring tools have often not been used to their full capacity in previous research. For example, the DIGITAT trial was a randomised trial comparing expectant monitoring versus iatrogenic early delivery in pregnancies with suspected fetal growth restriction.7 As a secondary analysis, the researchers used the Morbidity Assessment Index for Newborns (MAIN), a validated outcome scale designed for ranking neonatal morbidity beyond 28 weeks’ gestation.4 10 Although the MAIN scale is a continuous variable derived from points to 47 possible birth complications, the score was collapsed into four categories (severe, moderate, mild and no morbidity) for statistical analysis, losing much of the score’s detailed information.
The Adverse Outcome Index, an expert-opinion based scoring system that includes 10 adverse maternal and neonatal outcomes,1 was used as the primary outcome of a randomised trial evaluating the impact of labour and delivery room teamwork training.11 The outcomes ranged in severity from third/fourth degree perinatal tear (assigned five points per event) to maternal mortality (750 points). However, the trial’s primary analysis used a dichotomised version of the index (ie, a composite outcome indicating the occurrence of any of the 10 adverse events), which meant that maternal mortality was treated as interchangeable with a third or fourth degree tears.
In a large randomised trial of expectant monitoring versus labour induction in post-term pregnancies, researchers created a detailed index of perinatal mortality and neonatal morbidity (scores ranging from 0 to 10 160).12 Analysis of the score as a continuous variable using a rank sum test found a significant difference in the median morbidity score between groups that was dismissed as being of ‘probably of no clinical importance’ (pg 1590)12 because it essentially only compared differences in very mild morbidity (ie, the median scores) between the two groups, not differences in serious events of clinical interest on the extremes.12
Using a count-based regression approach to compare morbidity scores
We propose that an alternative way to compare perinatal morbidity scores between groups is through a count-based framework such as Poisson regression. The general idea behind the approach is that the points assigned to each component of the morbidity score are converted into count format data (where the outcome variable reflects the number of times an event occurred, such as the number of goals in a football match). More severe adverse events are ‘counted’ a greater number of times to reflect their increased severity. Severity-weighted rate ratios are then estimated using a Poisson regression model with CIs calculated through bootstrapping (resampling) techniques. The approach can be implemented through the following steps.
Step 1. Rescale the existing scoring system
The perinatal morbidity scores are first converted such that the adverse event with the lowest assigned score is assigned a value of 1 point, and all other adverse events are expressed multiplicatively in relation to the least severe event. The first two columns of table 1 show this conversion for the previously discussed Adverse Outcome Index.1 In this scoring system, the least severe event is a third-degree or fourth-degree perineal tear, which has a score of 5, while the most severe is a maternal death, which has a score of 750. To scale this scoring system, one would divide all scores by 5. The third-degree or fourth-degree tear then has a value of 1 point (5/5), while maternal death has a value of 150 points (750/5).
Safety of labour and delivery following the closure of local planned obstetrical services in 21 communities in British Columbia, Canada, modified from data published in Hutcheon et al.9
Table 2 shows a sample dataset of six pregnancies that uses the Adverse Outcome Index scores that have been converted for use in the subsequent regression model. The variable ‘outcome’ is a binary indicator of pregnancies that had any one of the adverse events that make up the index. For those women who had an adverse outcome (ie, Study IDs 003, 005, and 006), the variable ‘severity points’ reflects the rescaled Adverse Outcome Index scores, with more severe events (uterine rupture, intensive care unit admission) expressed as multiples of the least severe event (third-degree or fourth-degree tear). In the event of multiple adverse events (eg, Study ID 006), points are summed.
Example dataset for severity-weighted Poisson regression
Step 2. Use Poisson regression to incorporate information on relative severity of events
A weighted rate ratio associated with one or more independent variables is then estimated using Poisson regression. In this model, the outcome of interest is the count of severity points in a given pregnancy (analogous to, eg, the count of chronic obstructive pulmonary disease exacerbations in a given patient-year). For the dataset in table 1, the model would be specified in Stata as: poisson severitypoints X1×2×3…, irr vce(robust), where X1–X3 are the independent variables of interest (exposure group and any confounders), and robust SEs are specified to correct for overdispersion (ie, increased heterogeneity, indicated by a variance substantially greater than the mean). In the event of highly overdispersed data, the negative binomial model could be used as an alternative to Poisson. If absolute rather than relative measures of association are desired, an offset for the number of births (=1 for each row) should be included (the offset will cancel out when relative measures of association such as a rate ratio are calculated). Although a zero-inflated model is often used when data contain a large number of zeros,13 we opted against its use in this context as our zeros reflect the rarity of adverse events rather than a different underlying process creating the zero values.
Rather than using the CIs produced by the Poisson model, CIs are calculated through bootstrapping (SAS, R and Stata code provided in the online supplementary appendix 1).14 This is done because although the model ‘counts’ more severe events a greater number of times, each adverse event is still only a single occurrence. The inference on a single stillbirth worth 80 points (in the rescaled Adverse Outcome Index) is much less stable than that on 80 women with third-degree or fourth-degree tears worth one point each, even though their contribution to the weighted rate ratio point estimate would be the same. The variance estimates produced by the Poisson model will result in artificially narrow CIs, and CIs should be instead estimated using bootstrapping.
Worked example: evaluating the safety of labour and delivery following closure of local obstetrical services
Methods
This approach was used to evaluate how the closure of planned obstetrical services in small hospitals in British Columbia, Canada, affected the labour and delivery outcomes of women residing in affected communities.9 Ethical approval was granted by the University of British Columbia/BC Children’s and Women’s Hospital Research Ethics Board. For illustrative purposes, we simplify the analysis to a comparison of outcomes of women living in the hospital catchment areas after versus before the closure of services (excluding the control communities used to further account for underlying time trends in the original publication). We chose the Adverse Outcome Index as our primary outcome because it captures the varying severity of adverse events for both mother and newborn.
Results
As shown in table 1, the risk of experiencing one or more components of the Adverse Outcome Index was 6.0% postclosure and 6.5% preclosure, a difference that was not statistically significant (incidence rate ratio 0.92 (95% CI 0.81 to 1.06)). Although the number of individual adverse events that occurred after versus before hospital closure was similar, the adverse outcomes that occurred before the closures included a greater number of serious events (perinatal death and neonatal intensive care unit admission, which count for 80 and 7 severity points, respectively). Thus, when the perinatal morbidity scores are compared using our Poisson regression approach, the results suggest a reduction in adverse outcomes following the closure (weighted rate ratio of 0.58 (95% CI 0.36 to 0.89)).
For illustrative purposes, the approach has been demonstrated using univariable analysis; however, adjustment for factors such as calendar time, multiple birth, obesity or maternal socioeconomic status is needed to further remove the potential effects of confounding.
Discussion of additional considerations
A count-based framework, such as Poisson regression, may be a valuable approach to compare the scores between groups from perinatal morbidity scoring tools while ensuring that more severe outcomes are ‘counted’ a greater number of times. However, the approach warrants considerations of several key issues. The clinical and public health relevance of the estimates obtained from using perinatal morbidity scores depends on the extent to which the scoring systems reflect the valuation that women and their care providers place on each component. Although there will likely be disagreement on the relative weight or score assigned to a given outcome, we (and others15) argue that use of morbidity scores is nevertheless likely better than the common current approach of using an equally weighted composite outcome (which almost certainly does not reflect women’s and care providers’ valuation of components). Rather, the impact of different scores could be explored through sensitivity analyses.
Alternative approaches have been proposed to account for event severity in non-perinatal scoring tools.16–19 However, these are less suitable for perinatal scores because the smaller differences in severity between outcomes (eg, stroke vs mortality) in other medical populations produce scores that are more likely to follow a normal distribution, allowing differences between groups to be established using standard statistical tests. Further, their focus on time-to-event data is often not relevant for perinatal research question16–18 and may be more difficult to implement by applied researchers.19
Finally, the interpretation of a severity-weighted rate ratio is less intuitive than an equally weighted risk ratio, as it requires an understanding of the scoring system being used. Calculating the equally weighted rate ratio as a companion to the severity-weighted rate ratio will help interpretability, as it shows the extent to which the equally weighted rate ratio changes in magnitude and/or direction after accounting for relative severity of events.
What is already known on this subject
Perinatal morbidity scoring tools provide a valuable approach to account for differences in the relative severity of adverse maternal or neonatal adverse events.
However, perinatal morbidity scoring tools produce statistical distributions that are challenging to analyse using standard approaches, limiting their use in applied perinatal research.
What this study add
This study outlines how a count-based framework, such as Poisson regression, can be used to compare morbidity scores between groups while ensuring that more severe outcomes are ‘counted’ a greater number of times.
The approach can be easily implemented using standard statistical analysis packages and is intuitive to researchers without advanced statistical training.
References
Footnotes
Contributors JAH and RWP conceived the study concept, LBM advised on the application of the approach to observational data. JAH conducted analyses and wrote the first manuscript draft. All authors revised the manuscript critically for important intellectual content and have approved the final version.
Funding JAH is the recipient of New Investigator Awards from the Canadian Institutes of Health Research and the Michael Smith Foundation for Health Research. RWP holds a Chercheur-National award from the Fonds de la Recherche du Québec-Santé.
Competing interests None declared.
Ethics approval University of British Columbia/BC Children’s and Women’s Research Ethics Board.
Provenance and peer review Not commissioned; externally peer reviewed.