Article Text

Abstract
Background It is unclear whether the increase in life expectancy (LE) globally is coupled with a postponement of morbidity and disability. Evidence on trends and determinants of disability-free life expectancies (DFLEs) are available in high-income countries but less in low and middle-income countries (LMICs). This study examines the levels of and inequalities in LE, disability and DFLE between men and women across different age groups aged 50 years and over in six countries with developing economies.
Methods This study utilised the cross-sectional data (n=32 724) from the WHO Study on global AGEing and adult health (SAGE) in China, Ghana, India, Mexico, the Russian Federation and South Africa in 2007–2010. Disability was measured with the activity of daily living (ADL) instrument. The DFLE was estimated using the Sullivan method based on the standard period life table and ADL-disability proportions.
Results The disability prevalence ranged from 13% in China to 54% in India. The prevalence of disability was highest and occurred at younger age in both sexes in India. Women were more disadvantaged with higher prevalence of disability across all age groups, and the situation was worst among older women in Mexico and the Russian Federation. Though women had higher LE, their proportion of remaining LE free from disability was lower than men.
Conclusions There are inequalities in the levels of disability and DFLE among men and women in different age groups among people aged over 50 years in these six countries. Countermeasures to decrease intercountry and gender gaps in DFLE, including improvements in health promotion and healthcare distribution, with a gender equity focus, are needed.
- Health inequalities
- HEALTH EXPECTANCY
- DISABILITY
This is an Open Access article distributed in accordance with the Creative Commons Attribution Non Commercial (CC BY-NC 4.0) license, which permits others to distribute, remix, adapt, build upon this work non-commercially, and license their derivative works on different terms, provided the original work is properly cited and the use is non-commercial. See: http://creativecommons.org/licenses/by-nc/4.0/
Statistics from Altmetric.com
Introduction
Life expectancies (LEs) are increasing rapidly in low and middle income countries (LMICs), but the evidence on whether the additional years gained are coupled with a healthier life and a reduced period of morbidity (known as the ‘compression of morbidity’) is conflicting.1 The proportion of the world's population aged 65 or older is projected to double from 8% in 2010 to 16% by 2050, representing a population of about 1.5 billion people.2 By the year 2025, 70% of the world's older population will be living in LMICs. Intertwined with these demographic changes is the epidemiological transition of diseases, where the primary causes of disability, morbidity and mortality shift from communicable diseases (CDs) to chronic non-communicable diseases (NCDs). Health systems in LMICs are fundamentally unprepared for tackling the chronic disease challenges since they have been set up in a period when CDs were dominant.3 The increasing NCD burden puts older adults and elderly and their households at the risk of catastrophic health expenditures and impoverishments. In LMICs, out-of-pocket payments for healthcare services are predominant, and existing formal social protection systems cover only a small proportion of their ageing population.4 Thus, people in LMICs arrive at old age in poorer shape and with fewer reserves.
During the last decade, a large body of literature focused on trends and determinants for the unequal distribution of healthy life years (HLYs) and the disability-free life expectancy (DFLE) among older people in several European countries and North America.5 ,6 The results consistently show improvements in the overall quality of HLYs of older people in these high-income settings, though inequalities in DFLE between population subgroups remain. However, there is a paucity of evidence from studies on healthy ageing conducted in LMICs.7–12 A study based on the INDEPTH WHO-SAGE data revealed how different socioeconomic indicators such as education, marital status, living arrangement and household socioeconomic status influence health inequality observed between men and women in eight countries in Africa and Asia.7 Studies in Brazil and Mexico link inequalities in DFLE to the prevalence of NCDs.8–10 In Mexico, a nearly 10-year gap in DFLE between diabetics and non-diabetics exists.11 Another study from Brazil shows that women receive more years of personal assistance but also experience more unmet care needs compared with men.9 A study in China showed evidence for a compression of morbidity among people aged 65 and over during 1992–2002 but not among the younger age groups.12 Most of those studies, except the study by Ng et al,7 used different instruments to measure disability at individual level. The heterogeneity in disability measurement limits the availability of cross-country comparative data.
The objectives of this study are to describe the levels of and inequalities in LE, disability and DFLE between men and women across different age groups 50 years and over in six countries with developing economies. We utilise data from the WHO Study on global AGEing and adult health (WHO-SAGE), which was collected using standardised instrument in six countries, representing four different world regions. These countries are also at different stages of the demographic, economic and epidemiological transition.
Methods
Study design and participants
The current cross-sectional study is based on the first wave data of the WHO-SAGE. The WHO-SAGE is designed as a longitudinal study with the first wave data collection conducted among people aged 50 and over in China, Ghana, India, Mexico, the Russian Federation and South Africa during 2007–2010. A total of 34 138 individuals aged 50 and over participated in this first wave.
Data collection methods
In all countries, multistage cluster sampling was used to select nationally representative households. All individuals aged 50 and over in the households were invited and data were collected through face-to-face interviews conducted by trained staff. The combination of computer-assisted personal interview (CAPI) and paper and pencil was used. Details about the sampling procedure and data collection have been described elsewhere.13
Instruments
Standardised instruments, containing individual and household questionnaires, were used in all six countries. The demographic (age and sex) and basic activities of daily living (ADLs) data were derived from the individual questionnaire. We used six questions on ADL to estimate disability prevalence. The questions asked how much difficulty the respondents had in the last 30 days in (1) walking a long distance, (2) bathing or washing the whole body, (3) dressing, (4) transferring through a room, (5) eating food and (6) getting to and using the toilet. The response was recorded in five categories ranging from no difficulty, mild, moderate, severe and extreme difficulty. Responses to each of these questions were dichotomised into ‘no disability’ (no difficulty and mild difficulty—coded as 0) and ‘with disability’ (moderate, severe and extreme difficulty—coded as 1). A total score of ADL was later calculated as the sum of responses to the six questions (range 0–6). On the basis of the total ADL, individuals were defined ‘with disability’ (total score 1–6) and have ‘full function’ (total score 0).
Statistical analysis
About 4% of the respondents with missing data in any of the variables included in this study were excluded from the analysis; hence, the complete case analysis included 32 770 respondents. We calculated the DFLE for men and women in each country using the Sullivan method. The Sullivan method, established in 1971,14 is one of the most common methods used to estimate DFLE.15 DFLE is defined as the mean length of time that individuals can expect to live free of disability if current health conditions continue to apply. Two key indicators were used in the DFLE calculation, that is, the standard period life table and the age-specific prevalence of disability. The life table was estimated using age-specific and sex-specific mortality information obtained from 2010 WHO Global Burden of Disease.16
We estimated the prevalence of disability, based on the ADL scale, for each age group (50–54, 55–59, …, and 80+ years) stratified by sex. We weighted the survey data using country-specific weights to adjust for different age–sex distributions in each country. The person-years of the life table for each age group were multiplied by the age-specific prevalence of disability. The analyses resulted in the total number of remaining life years (total life expectancy, TLE), differentiated into the years lived with (life expectancy with disability, LED) and without disability (DFLE). Finally, we estimated the difference in LE and DFLE between men and women. All analyses were conducted in Stata V.13 (StataCorp, College Station, Texas, USA, 2014).
Ethical considerations
The WHO headquarters in Geneva granted access to the WHO-SAGE dataset, which is available in public domain. All participants provided informed consents prior to the study.
Results
The sample size ranged from 2140 individuals in Mexico to 12 784 individuals in China. There were more women in all countries (overall: 51.7% women, 48.3% men), except in Ghana (47.3% women) and India (48.1% women). About 53% of the respondents were aged 60 and over and 5% were 80 years and over, ranging from 4.2% in China and India to 7.5% in the Russian Federation (see online supplementary appendix 1).
Supplementary appendix
Prevalence of disability
Overall, 26.5% of respondents (21.6% men, 31.3% women) reported moderate or severe difficulty in performing any of the ADLs in the last 30 days (table 1). The disability prevalence ranged from 13.5% in China to 54.1% in India. Women consistently reported more disability compared with men in all countries (up to 1.8 times in the Russian Federation). More respondents (29% women, 19% men) reported difficulty in walking long distance compared to other domains where <5% of men and 7% of women reported difficulty. Indian men and women reported higher prevalence of disability in most domains. Some exceptions included that more Russian and Mexican women reported difficulties in bathing/washing and dressing, respectively, and more Mexican, South African and Ghanaian men had problem with dressing, moving inside the home and toileting, respectively. As expected, the prevalence of disability increased among population at older age groups as shown in table 2.
Proportion (and 95% CI) of respondents reporting overall and domain-specific disability in the WHO-SAGE study
Proportion (and 95% CI) of respondents reporting domain-specific disability by age groups in the pooled WHO-SAGE study
Figure 1 shows the prevalence of disability by sex and age group for each country. The prevalence of disability was higher among women (dashed lines, grey bars in figure 1) than men across all age groups. The prevalence was also higher among older age groups, consistently in all countries, except for men aged 85 and over in the Russian Federation and South Africa. India had the highest prevalence of disability among young age groups (55% of Indian women aged 50–54 years reported disability). The prevalence was over 80% among Indian women aged 75–79 years (vs only about 40% in their Chinese counterparts). The gender gaps in prevalence of disability were smallest in China and largest in Ghana. The gender gaps were constant across age groups in China and Ghana. On the contrary, the gender differences were wider among older people in Mexico and the Russian Federation and narrower in India and South Africa.

Prevalence of disability among men and women in each age group in the six WHO-SAGE countries. The darker bars and the solid lines represent men, the lighter bars and the dashed lines represent women. All the country-specific proportions were weighted by the country-specific weights. WHO-SAGE, WHO Study on global AGEing and adult health.
Gender differences in LE and DFLE
The highest LE at age 50 (LE-50) was observed in Mexico (men: 27 years; women: 29.1 years), while the lowest was among South African women (23.3 years) and Ghanaian, Russian and South African men (20 years) (see online supplementary appendices 2 and 3). The proportion of LE lived without disability (the grey part of the bars) indicated that Chinese were the healthiest and Indians were the least healthy (figure 2). Chinese men and women spent 87% and 81% of their remaining LE-50 without disability, respectively, compared with only 53% and 34% among Indian men and women. Ghanaian, Indian and Mexican women aged 85 and over spent <20% of their remaining LE-50 without disability. The corresponding numbers among men aged 85 and over ranged from 15% in India to 54% in China.

Life expectancy among men (left panel) and women (right panel) in each age group in the six WHO-SAGE countries. The lower bar represents years lived without disability/disability-free live expectancy (DFLE) and the upper bar represents years lived with disability/disability life expectancy (DLE). WHO-SAGE, WHO Study on global AGEing and adult health.
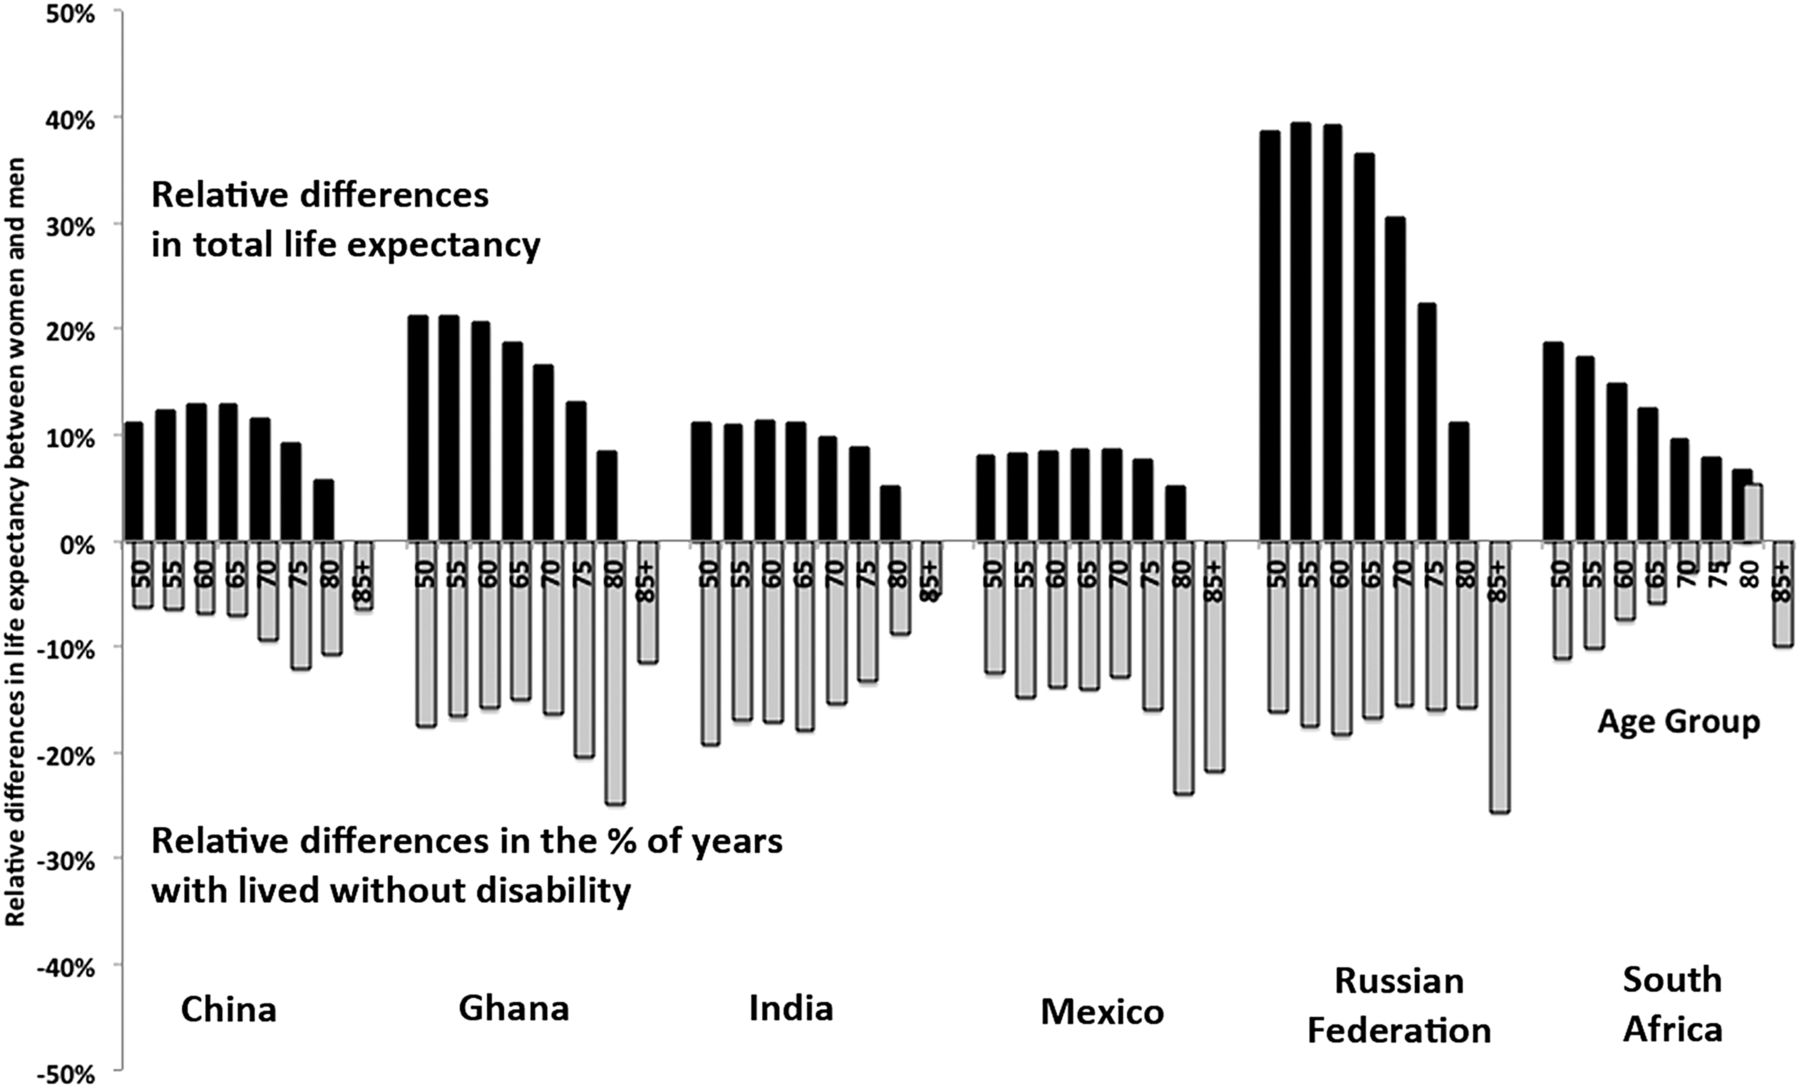
Women enjoyed a longer LE than men, with higher LE-50 compared with men (from 8% higher in Mexico to 40% in the Russian Federation). The female advantage was observed steadily across all age groups, though it declined at the older age groups (black bars in figure 3). Yet, women experienced a less healthy life than men. The proportion of women's remaining LE without disability was less compared with men (grey bars in figure 3). The gender gap in the proportion of DFLE was smallest in China and South Africa. This disadvantaged phenomenon was, however, markedly observed among women aged 85 and over in Mexico and the Russian Federation, and women aged 75–84 years in Ghana.
Relative differences between women and men in total life expectancy and disability-free life expectancy at 50 years of age in the six WHO-SAGE countries. WHO-SAGE, WHO Study on global AGEing and adult health.
Discussions
This study expands the current literature on DFLE by using recent nationally representative and comparable data from six LMICs. The main findings of the current study are: (1) the prevalence of disability was highest in both sexes in India, and it occurred at a younger age; (2) women were more disadvantaged with higher prevalence of disability across all age groups, and the situation was worst among older women in Mexico and the Russian Federation and (3) though women had higher LE, their proportion of remaining LE without disability was lower compared with men.
Intercountry differences in the level of disability
The observed country differences in the prevalence of disability in this study might reflect the differential chronic disease burdens and their risk factors. Chronic diseases tend to lead to chronic-disabling conditions.8 ,17 ,18 The proportions of total musculoskeletal disease-related years lived with disability (YLDs), one of the leading causes of disability, in the six SAGE countries range from 12% (India) to 19% (the Russian Federation). Chronic obstructive pulmonary diseases (COPDs) accounted for 9–11% of total YLDs in Ghana and South Africa. Mexico had a large burden of diabetes-related morbidity and mortality,16 which was the highest among the six SAGE countries.19 In India, where the disability was highest in our study, having multiple chronic illnesses, including hypertension, vision and hearing deficits, arthritis, depression, COPD, angina, diabetes and stroke, was significantly associated with disability among population aged 50 and over.17
Many of the NCD risk factors predict the onset of disability among older adults. Physical inactivity is predictive of shorter active LE and a longer period of disability prior to death in old age. Alcohol consumption is strongly associated with cognitive and physical disabilities.20 Smoking, on the contrary, is more strongly associated with fatal diseases and a relatively short period of disablement.21 Overweight and obesity predict functional decline and physical disability, such as osteoarthritis and chronic back pain.21 Compared to smoking and alcohol consumption, obesity is more strongly associated with an increased risk of more YLDs at age 55.22 Data from the same WHO-SAGE population show that over 70% of Chinese and 90% of South African older adults had two or more NCD risk factors, including daily tobacco use, alcohol use, physical inactivity and obesity.23
These intercountry differences could also reflect the differences in socioeconomic and contextual factors across countries. Even there are intracounty differences observed across different population groups. Studies in Britain and Canada identified strong regional variability in DFLE.24 ,25 In Canada, the highest DFLEs were found in highly populated urban areas, while the lowest DFLEs were commonly found in remote rural regions.25 In the UK, there was an increasing clustering of inequalities in DFLE in deprived areas compared with affluent areas.24 Inequalities in DFLE are also driven by socioeconomic status.24–27 Educational inequalities favouring the higher educated have been identified among European pensioners before and after the retirement and among Belgian men and women.6 ,26 Other social determinants such as illiteracy, smoking and unemployment are strongly associated with variations in DFLE in Spain.27
Gender inequality in disability and LE
Our study confirms the existence of gender inequality in disability and LE as observed elsewhere.28–31 We show that women have longer LE but proportionally less years of DFLE than men as shown in other studies.32–35 The gender inequalities in DFLE were more evident in India, Ghana, Mexico and the Russian Federation. The similar observations, putting women as the disadvantaged sex, have also been reported in 25 countries in the EU region,32 the UK,33 Japan34 and Bangladesh.35
Women had higher prevalence of non-fatal chronic conditions compared with men who are more likely to die from more fatal diseases before being disabled due to disease. The differences could be attributed to the biological and social determinants of healthy ageing.36 In many LMICs, women tend to have higher rates of sedentary behaviour, hence lower muscle strength and bone density and higher proportion of body fat. They might also have restricted access to nutritional food and healthcare facilities. Consequently, women may accumulate more disability throughout the life course. On the other hand, younger men could suffer more disability than younger women, as they were more prone to be exposed to economic and social instability, high rates of tobacco and alcohol consumption, poor nutrition and depression, as observed in the Russian Federation.37 Exclusion from access to resources that enhance human development from childhood up to old age and that enrich lives at different ages is the major basis of inequality across population groups.38
Cultural context of disability
The meaning of ageing is less biologically dependent but more socioculturally constructed. The differences in the perception and evaluation of age and ageing vary considerably across cultures,39 hence, the ageing process might not progress uniformly across populations. Eastern/Asian cultures—being based on Confucian values, ancestor worship and filial piety—employ more positive views on ageing compared to Western societies, which are thought to be more youth oriented and thus holding more negative notions towards the ageing process and elderly. Changes in functioning could therefore reflect changes in individuals’ expectations of disability and use of equipment, rather than changes in their underlying disabilities.
Strengths and limitations of the study
This study is one of the first studies with a cross-country DFLE comparison using a standardised instrument. The national representative sample in the WHO-SAGE ensures the generalisability of the findings to the population in each country. Stringent research protocol employed in the study ensured that translation of questionnaire from English to local or national language in participating countries achieved equivalence across settings.13 The large dataset with relatively low proportion of missing data ensures sufficient sample size to obtain robust statistics, especially among the oldest age group above 80 years. The use of Sullivan method, recommended for its simplicity, relative accuracy and ease of interpretation, produces comparable results across the six countries.40
Several limitations in this study warrant careful interpretation of the results. The WHO-SAGE surveyed only community-dwelling older adults and not institutionalised older adults; hence, we might have underestimated the true prevalence of disability. The prevalence of disability might also be influenced by acute short-lasting illness that could not be controlled for in the analysis. On the contrary, the more conservative definition of disability in this study might be sensitive enough in revealing its true prevalence. The data do not allow us to assess a non-returnable state assumption, whether people recovered from their disability situation or not. It is therefore not possible to examine the transitional probabilities across different functional states, and how the disability transition rates and level vary by age and sex. As with many studies which were based on self-reported questionnaire, the comparability of cross-country findings in this study might be hampered by differential health reporting related to different experiences and expectation about health by different population groups within and between countries.41 Though anchoring vignette approach has been introduced to handle these reporting differences in cross-country studies,42 ,43 the applicability of this method in some settings has been limited.44 ,45 Biological markers collected in the second wave of SAGE could shed light on the validity of these self-reported questionnaires in measuring health and disability across different population groups.46
Public health policy implications
Our study raises several policy implications concerning the importance of monitoring health trends through the DFLE indicator. Further investigations on how social determinants of health and lifestyle risk factors might influence the disability states in different countries are needed to understand the complexity of disability problems among older people. Though the health of older women is a critically important issue, the feminisation of ageing phenomenon is policy-wise a less acknowledged field. Without challenging policies related to welfare, pensions, families and migration that emanate from the interests and experiences in more developed countries, the gendering of old-age experiences we see in the present global context may not change to any great extent.47 The contextual differences in how the process of ageing is experienced need to be considered by decision-makers, when designing gender-responsive policies and programmes for ageing women. Further, ensuring universal healthcare and strengthening the health system to address the emerging burden of NCDs and the intersection of NCDs with other diseases among women using a life course perspective are among the essential steps to promote healthy ageing among women.48
Conclusions
There are significant inequalities in the levels of disability and DFLE among men and women, and these inequalities are also observed across different age groups over 50 years in the six SAGE countries. Countermeasures to decrease intercountry and between-gender differences in DFLE, including accelerating economic development and improving health promotion and healthcare distribution, with a gender equity focus, are needed.
What is already known on this subject
Life expectancy has increased unprecedentedly in low-and-middle income countries in the last few decades. Yet, adding extra years to life does not always mean that the additional years are disability free.
What this study adds
Gender differences in LE and DFLE exist across different age groups over 50 years in LMICs. Though women had a higher life expectancy, they also had worse health conditions compared with men. Therefore, policy actions aiming to reduce the burden of disability and maximise DFLE for older populations must be a priority in promoting healthy ageing. It is also vital to address the social and biological determinants of healthy ageing in LMICs applying a strong gender equity focus.
References
Footnotes
AS, JS and MV contributed equally.
Contributors AS, JS, MV and NN designed the study, conducted the statistical analysis and interpreted the data. AS, JS and MV drafted the manuscript, and NN provided critical inputs on the draft. All authors read and approved the final draft.
Funding In this study, AS and NN were supported by the project ‘Paths to Healthy and Active Ageing’ funded by the Swedish Research Council for Health, Working Life and Welfare (FORTE), Number: 2013-2056. All authors were also supported by the FORTE grant for the Umeå Centre for Global Health Research (number 2006-1512).
Competing interests None declared.
Ethics approval The WHO headquarters in Geneva granted access to the WHO-SAGE dataset, which is available in public domain. The SAGE study itself has received ethical permission from institutions in respective countries.
Provenance and peer review Not commissioned; externally peer reviewed.
Data sharing statement The WHO headquarters in Geneva granted access to the WHO-SAGE dataset, which is available in public domain.