Article Text

Abstract
Background Mortality in Scotland is higher than in the rest of west and central Europe and is improving more slowly. Relative to England and Wales, the excess is only partially explained by area deprivation. We tested the extent to which sociodemographic, behavioural, anthropometric and biological factors explain the higher mortality in Scotland compared with England.
Methods Pooled data from 18 nationally representative cohort studies comprising the Health Surveys for England (HSE) and the Scottish Health Survey (SHS). Cox regression analysis was used to quantify the excess mortality risk in Scotland relative to England with adjustment for baseline characteristics.
Results A total of 193 873 participants with a mean of 9.6 years follow-up gave rise to 21 345 deaths. The age-adjusted and sex-adjusted all-cause mortality HR for Scottish respondents compared with English respondents was 1.40 (95% CI 1.34 to 1.47), which attenuated to 1.29 (95% CI 1.23 to 1.36) with the addition of the baseline socioeconomic and behavioural characteristics. Cause-specific mortality HRs attenuated only marginally to 1.43 (95% 1.28 to 1.60) for ischaemic heart disease, 1.37 (95% CI 1.15 to 1.63) for stroke, 1.41 (95% CI 1.30 to 1.53) for all cancers, 3.43 (95% CI 1.85 to 6.36) for illicit drug-related poisoning and 4.64 (95% CI 3.55 to 6.05) for alcohol-related mortality. The excess was greatest among young adults (16–44 years) and was observed across all occupational social classes with the greatest excess in the unskilled group.
Conclusions Only a quarter of the excess mortality among Scottish respondents could be explained by the available baseline risk factors. Greater understanding is required on the lived experience of poverty, the role of social support, and the historical, environmental, cultural and political influences on health in Scotland.
- Cohort studies
- MORTALITY
- SOCIAL CLASS
- PUBLIC HEALTH
- SOCIAL EPIDEMIOLOGY
This is an Open Access article distributed in accordance with the Creative Commons Attribution Non Commercial (CC BY-NC 4.0) license, which permits others to distribute, remix, adapt, build upon this work non-commercially, and license their derivative works on different terms, provided the original work is properly cited and the use is non-commercial. See: http://creativecommons.org/licenses/by-nc/4.0/
Statistics from Altmetric.com
Introduction
The population of Scotland has experienced higher mortality rates than the rest of the UK since the 1920s, and improved more slowly than the rest of continental Europe since the 1950s.1–3 Initially, this was largely ascribed to higher mortality from cardiovascular disease (CVD), stroke and cancer. However, this pattern of cause-specific deaths changed around 1980 with a rise in rates of violent,4 drug-related and suicide deaths.5 With an accompanying increase in rates of alcohol-related deaths over subsequent decades, the mortality pattern now has parallels to that observed in eastern Europe.2 ,3 ,6
Relative to England and Wales, mortality rates in Scotland were 12% higher in 1981, increasing to 15% higher in 2001. The proportion of this excess, which could be explained by area-based socioeconomic deprivation, declined from 62% to 47% during the same period. Individual measures of socioeconomic status revealed similar findings for coronary heart disease.7 This apparently inexplicable excess mortality, over and above that explained by area deprivation, has been dubbed the ‘Scottish Effect’.8
There is therefore a need to explain why Scotland experiences higher rates of mortality than the rest of west and central Europe, why area deprivation is increasingly less able to explain the excess in comparison to England and Wales and why inequalities in mortality within Scotland are relatively higher.9–11 To date, there have been at least 17 hypotheses suggested to explain these phenomena,12 ,13 but the investigation of many of these has been limited by a lack of comparable individual data linked to health outcomes, and where these data have been available, they may not be generalisable.14 Although it is clear that some health behaviours are implicated in the higher mortality (particularly alcohol6 ,15 and illicit drugs16), the prevalence of many others are relatively similar in Scotland to other areas.17 ,18 This has raised the possibility that other factors may be an important explanation.19 Furthermore, simple explanations that include only health behaviours without some understanding of the ‘causes of the causes’ are insufficient, and so hypotheses relating to deindustrialisation, unemployment, economic and social policy20 ,21 (not least the neoliberal approach seen in the UK) have been proposed.1 ,12 ,13 ,22–25 Further research is therefore required in order to design policy and practice with the aim of alleviating the human suffering associated with the higher mortality rates.
Major population health surveys conducted from the mid-1990s in Scotland and England, whose respondents have been linked to subsequent cause-specific mortality, have created powerful, well-characterised cohort studies which draw on random population samples.26 ,27 Much of the data collected in the health surveys are directly comparable and there have now been a sufficient number of deaths to facilitate comparative pooled analyses of mortality in England and Scotland. Thus, this study aims to ascertain the extent to which any of the baseline risk factors explain the higher mortality in Scotland, beginning with social position, given the earlier finding from ecological and individual studies of an excess after adjustment for deprivation.7 ,8
Methods
Data sources
We used the data collected in a series of 18 independent studies conducted between 1995 and 2003 (the Scottish Health Surveys, SHS) and 1994–2008 (the Health Surveys for England, HSE). Consenting survey respondents have been linked to the National Health Service registries up until the first quarter of 2011 for data on cause-specific mortality (the proportion consenting in each cohort study is given in table 1 (mean 86%, range 72–96%)). These cohort studies have been described in detail elsewhere.26 ,27 Briefly, random, stratified, population-based samples of the Scottish population aged 16–64, 16–74 and ≥16 years were taken in 1995, 1998 and 2003, respectively. In England, random population samples were drawn from the population aged ≥16 years in each year from 1994 to 2008. At the interview, data were collected on occupational social class, educational attainment, health behaviours (such as diet, smoking and alcohol consumption), pre-existing morbidity, self-assessed health and the 12-item General Health Questionnaire.28 During a subsequent nurse visit, weight, height, spirometry and blood pressure were objectively measured; blood samples were taken from a subsample.
Characteristics of study participants according to individual cohort studies: follow-up of 18 cohort studies from the Health Survey for England and Scottish Health Survey (N=193 873)
The end points of interest were all-cause mortality and mortality from: CVD (International Classification of Diseases (ICD)-9 codes 390-459 and ICD-10 chapter I); ischaemic heart disease (ICD-9 codes 410-414 and ICD-10 codes I20-I25); stroke (ICD-9 codes 430-438 and ICD-10 codes I60-I69); all cancers (ICD-9 codes 140-239 and ICD-10 codes C00-D48); individual cancers; smoking-related cancers (ICD-9 codes 141-151, 155.0, 157, 160.0, 160.2-160.9, 161, 162.2-162.9, 180, 188, 189 and 205 and ICD-10 codes C01-16, C22, C25, C30.0, C31, C32, C34, C53, C64, C65, C67 and C92, in line with WHO definitions29 ,30); alcohol-related causes (ICD-9 codes 291, 303, 305.0, 425.5, 571.0, 571.1, 571.2, 571.3, 571.4, 571.5, 571.8, 571.9 and E860 and ICD-10 codes F10, G31.2, G62.1, I42.6, K29.2, K70, K73, K74.0, K74.1, K74.2, K74.6, K86.0, X45, X65 and Y15); illicit drug-related causes (ICD-9 codes 304-305 (not 305.1), 965-71, E935-41, E950.0-E950.5, E962 and E980.0-E980.5 and ICD-10 codes F11-F16, F18, F19, X40-X44, X60-X64, X85 and Y10-Y14); and external causes (ICD-9 codes 800-999 and ICD-10 codes V00-Y98; for both intentional external deaths (identified by any mention of ICD-9 codes E950-E959 and E980-E989 or ICD-10 codes X60-X84 and Y10-Y34 associated with an underlying external cause of death) and unintentional external deaths (all deaths where the underlying cause of death was external and had no mention of the ICD codes indicating an intentional motivation)).
Analyses
We examined log (−log(survival)) plots for total mortality to confirm that the proportional hazards assumption was valid. Cox proportional regression31 was then used—with calendar time in months elapsed from survey date as the time scale—to compute HRs with accompanying 95% CIs for the relation of country of residence (based on survey) with mortality experience. We also performed a sensitivity analysis using age as the timescale for the analysis rather than age-adjusted calendar time.
Having tested that gender did not modify the residence–mortality relation, these HRs were initially adjusted for age and sex. This was followed by the individual addition of occupational social class, educational attainment, smoking status, frequency of alcohol consumption, self-assessed health and long-standing illness. Finally, we adjusted for all factors simultaneously. In planned sensitivity analyses, these analyses were repeated for all-cause mortality for restricted age strata (16–45 and ≥45 years) and by occupational social class strata to investigate the suggestion of higher mortality among young adults11 ,14 ,32 ,33 and in more deprived neighbourhoods.11 ,14 ,32 ,33 For selected outcomes, we also examined the impact of controlling for height in addition to a much wider range of individual baseline survey and clinical measurement data for which there were more than 20% of data missing. These were: doctor-diagnosed CVD and hypertension; and doctor-diagnosed diabetes; portions of fruit and vegetables eaten on a day prior to the survey; antidepressant use; anxiolytic use; physical activity34; psychological distress measured by the 12-item General Health Questionnaire (GHQ-12); objectively measured body mass index; systolic blood pressure; diastolic blood pressure; forced vital capacity (FVC); forced expiratory volume in 1 s (FEV1); and peak flow rate. Where individuals had missing data, we excluded them from the relevant analyses.
Finally, to empirically assess the degree to which the linked HSE and SHS cohort studies were representative of the English and Scottish populations, we also tabulated the denominator populations and number of deaths for each 5-year age–sex stratum for each year of follow-up and created an equivalent table for the English and Scottish populations overall using routine administrative data. We then performed a negative binomial regression using R V.2.15.2 to compare the relative all-cause mortality rates between the pooled surveys and their corresponding overall populations. All other analyses used PASW Statistics V.18.0.
Results
There were 222 829 individuals in the 18 cohort studies, of whom 193 873 had sufficiently complete data to facilitate analysis (172 139 in HSE and 21 734 in SHS, web figure 1). Fifteen English cohort studies for each year between 1994 and 2008 were available, as were three Scottish cohort studies from 1995, 1998 and 2003. Over a period of time, the proportion of people consenting to participate in the survey and to mortality linkage declined, as did smoking prevalence. There were also secular rises in the socioeconomic status of study members as evidenced by the proportion in non-manual occupational social classes and those leaving school aged >16 years (table 1). Relative to study members who declined to consent to being linked to mortality records, participants who did were somewhat more likely to be healthy, be from a non-manual social class, have higher educational attainment and be less likely to smoke or have a long-term limiting illness; web table 1).
The baseline characteristics of the pooled English and pooled Scottish cohort studies are given in web table 2. The proportion of the sample in the English studies of the non-manual social class and with greater educational attainment was slightly higher than that in the Scottish studies, while the prevalence of smoking was substantially higher in Scotland compared with England (32.8% vs 25.3%). The prevalence of psychological distress at baseline in the Scottish and English studies was broadly similar (with 59%, 26%, 8% and 7% in the HSE studies and 59%, 24%, 8% and 8% in the SHS studies with GHQ-12 scores of 0, 1–3, 4–6 and 7–12, respectively).
The age-adjusted and sex-adjusted HR for mortality in the pooled Scottish studies compared with the English studies for all-cause mortality was 1.40 (95% CI 1.34 to 1.47). Additional adjustment for occupational social class, educational attainment, frequency of alcohol consumption, self-reported health or long-standing illness did little to attenuate the relationship, whereas only adding smoking to the model had an appreciable effect (HR=1.31, 95% CI 1.25 to 1.37). Adjustment for all these factors combined resulted in a raised risk of total mortality of 29% (HR 1.29, 95% CI 1.23 to 1.36) in the Scottish studies relative to the English studies (table 2).
HRs (95% CI) for all-cause mortality, and deaths from cancer: Scotland relative to England (N=193 873)
For all cancers combined, the age-adjusted and sex-adjusted HR for the Scottish studies was 1.54 (95% CI 1.42 to 1.66), which was only partially explained by smoking (HR 1.42, 95% CI 1.31 to 1.53) and not substantially by occupational social class, educational attainment, frequency of alcohol consumption, self-assessed general health or long-standing illness (multiply adjusted HR 1.41, 95% CI 1.30 to 1.53; table 2). Web table 3 shows the HRs for smoking-related cancers and a range of site-specific cancers. The multiply adjusted HR for smoking-related cancers was 1.62 (95% CI 1.45 to 1.81) and for non-smoking-related cancers 1.22 (1.09 to 1.37). Particularly high multiply adjusted HRs were observed for lung cancer (1.67, 95% CI 1.43 to 1.94), oesophageal cancer (2.23, 1.60 to 3.09), bladder cancer (1.62, 1.04 to 2.54), cancer of the central nervous system (1.74, 1.12 to 2.72), leukaemia (2.32, 1.1.45 to 3.71), multiple myeloma (1.60, 0.81 to 3.13), liver cancer (2.54, 1.37 to 4.73) and mesothelioma (2.04, 1.06 to 3.93). The multiply adjusted models explained a very small additional proportion of the excess mortality compared with the age-adjusted and sex-adjusted models for each of these specific cancers. There was no evidence of an excess mortality for prostate or pancreatic cancer, or for non-Hodgkin's lymphoma.
A similar pattern to all-cause mortality was observed for CVD, ischaemic heart disease and stroke, where the multiply adjusted HRs were 1.27 (95% CI 1.16 to 1.38), 1.43 (1.28 to 1.60) and 1.37 (1.15 to 1.63), respectively (table 3). For intentional external causes (ie, intentional self-harm, violence or events of undetermined intent), the multiply adjusted HR was 1.68 (95% CI 1.07 to 2.64), and for unintentional external causes (ie, all other accidents, assaults, medical/surgical complications, or other external causes of death) it was similar in the Scottish studies compared with the English studies (HR 0.88, 95% CI 0.62 to 1.24; table 4).
HRs (95% CI) for all-cause mortality, and deaths from cardiovascular disease, ischaemic heart disease and stroke: Scotland relative to England (N=193 873)
HRs (95% CI) for deaths from external causes, intentional and unintentional: Scotland relative to England (N=193 873)
The age-adjusted and sex-adjusted alcohol-related mortality in the Scottish studies was more than five times higher than that in the English studies (HR 5.43, 95% CI 4.20 to 7.02). This was only marginally explained by the baseline risk factors (in particular smoking), giving a multiply adjusted HR of 4.64 (95% CI 3.55 to 6.05). Similarly, the age-adjusted and sex-adjusted drug-related poisoning mortality in the Scottish studies was almost four times higher than that in the English studies (HR 3.86, 95% CI 2.15 to 6.94), which again was only marginally explained by the baseline risk factors (multiply adjusted HR 3.43, 95% CI 1.85 to 6.36; figure 1 and table 5).
HRs (95% CI) for deaths related to alcohol* or drugs†: Scotland relative to England (N=193 873)

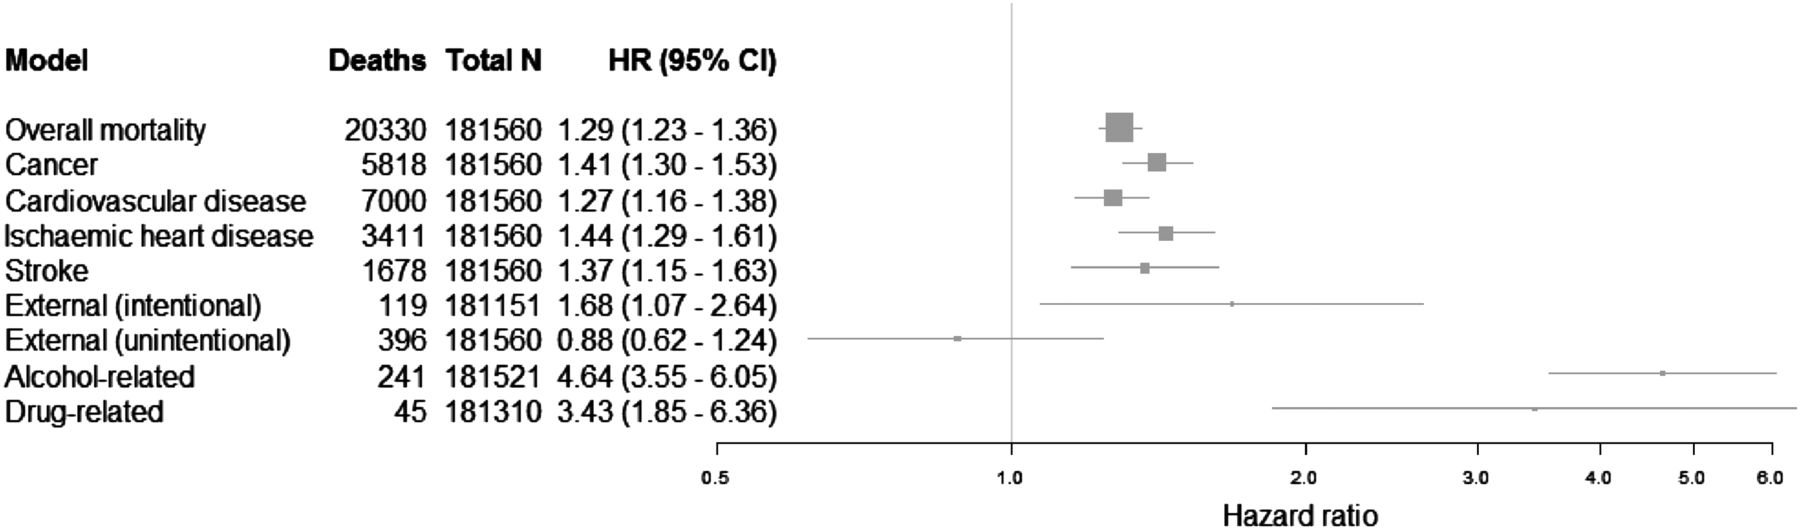
Multiply adjusted HRs for Scotland relative to England.
Web table 4 shows the all-cause HRs stratified into broad age categories to investigate whether the excess mortality in the Scottish studies was greater among young adults, as has been shown in previous studies,32 and whether this is explained by the baseline risk factors. For those aged 16–44 and 45–64 years, the age-adjusted and sex-adjusted HRs were higher than those for all ages (HR 1.68, 95% CI 1.44 to 1.97 and 1.71, 95% CI 1.59 to 1.83), which adjusted to (HR 1.54, 95% CI 1.30 to 1.81 and 1.47, 95% CI 1.37 to 1.58) with the addition of the baseline risk factors.
Web table 5 shows the HRs for residency in relation to all-cause mortality stratified by occupational social class. This shows that the excess age-standardised and sex-standardised mortality is present across all occupational social class categories except for social class I where the multiply adjusted HR was in fact imprecisely lower in the Scottish studies (0.85; 0.59 to 1.23). The multiply adjusted HRs for the Scottish studies were 1.20 (95% CI 1.08 to 1.34) in social class II, 1.32 (1.18 to 1.47) in social class IIINM, 1.31 (1.20 to 1.43) in social class IIIM, 1.27 (1.14 to 1.41) in social class IV and 1.40 (1.22 to 1.61) in social class V. The HR for the interaction between country and social class was 1.05 (p=0.12).
Web table 6 gives the subgroup analyses of the models adjusted using a wider range of baseline characteristics that were available for a smaller proportion of linked survey respondents. This shows that few of the additional baseline factors offer much additional explanatory power, with the exception of FVC, FEV1 and peak flow. Notably, neither pre-existing morbidity, blood pressure, physical activity, portions of fruit and vegetables eaten, body mass index, antidepressant use nor anxiolytic use explained any substantial proportion of the standardised excess.
Discussion
Main results
Mortality rates in the Scottish studies were 40% higher than in the English studies for all causes. The mortality rates for almost all specific causes of death were higher, although with some heterogeneity: for instance, mortality for ischaemic heart disease was 60% and stroke mortality was 42% higher in the Scottish studies. The relative differences in mortality rates were particularly high for: all cancers (54% higher); intentional external causes (85% higher); lung and oesophageal cancer (more than twice as high); for drug-related poisonings (almost four times higher) and for alcohol-related deaths (more than five times higher). Taking into account the most obvious explanatory factor, socioeconomic characteristics, explained only a small proportion of the overall observed excess, with the multiply adjusted all-cause mortality rate remaining 29% higher in the Scottish studies relative to the English studies. This reflects the relatively minor differences in risk factors between countries, the main difference being a greater proportion who smoked in the Scottish studies. Lung function did explain a larger proportion of the excess in the subgroup for whom these data were available, but this measure is by definition functional and the exposures which diminish it are unclear. In the age-stratified analysis, the relative mortality rates were observed to be highest in those aged 16–44 years (65% higher) and in those aged 45–64 years (70% higher), compared with 40% higher for all ages. Excess mortality was also observed across most occupational social class groups (with the exception of professionals). This suggests that the factors which are contributing to the excess mortality in Scotland are only partially modified by social class and there are likely to either be exposures that impact across all social groups (with a greater impact among the working class population) or that there are two layers of contributing exposures to the excess, but only one of which impacts across the whole population.
Study strengths and weaknesses
The cohort studies formed from the linked health surveys (HSE and SHS) are designed to be representative of the adult population in England and Scotland and utilise stratified random sampling methods to achieve this goal. Other examinations of explanations for the Scottish-English mortality differentials have often utilised data from cohort studies of working populations, thus affecting the generalisability of any findings.14 It is most likely that almost all deaths will have been captured in the death registries, making the estimated mortality rates internally valid.26 ,27 The cohort studies also provide premorbid, individual risk factor data not available for routine data, which allows a wider range of potential explanatory factors to be tested with adjustment for confounding.
Despite the survey sample frame being representative of the adult non-institutionalised population, the declining response rates to the baseline surveys and subsequent linkage, the non-coverage of some institutional populations in the sample frame and the consequent potential for non-representativeness are real.35 Both HSE and SHS normally present their results after inverse probability weighting to adjust for non-response bias. We have not weighted our data because: such weighting factors are available for the most recent years only; there are inherent difficulties of using different weights for different years; and because responders are intrinsically different from non-responders and simply up-weighting the responders’ data does not adequately adjust for non-response.36 ,37 Previous comparisons of HSE and SHS data found that weighting did not change the overall results (Rich Mitchell, personal communication). We did not have comparable measures of area deprivation in the data set and using only individual measures of socioeconomic status may have left some residual confounding.38 We assumed no loss to follow-up in the analyses, which could have biased the results if experienced differentially between HSE and SHS. Although unlikely, it is possible that differential measurement bias (eg, in previous smoking) might have underestimated the impact of some of the explanatory variables in the model. A mediation analysis approach may have facilitated a more detailed consideration of the role of confounding, direct and indirect causes, but was beyond the scope of this paper.
We used the standard approach to Cox modelling of using time since baseline and treating age as a confounder (which is important given the differences in the baseline ages of the cohorts). Web table 7 provides a sensitivity analysis using age as the timescale in the models rather than age-adjusted calendar time. This inflates the HRs in the Scottish population across all causes of death, but the patterning is similar. The age ranges in the cohorts differ slightly and we have chosen to adjust for age rather than restrict those included in the analysis to preserve the sample size. However, to expose the differences across the age range, we have stratified the samples in web table 4, which shows larger HRs for younger adults (which fits with the known higher excess in this age group).2
Preliminary analyses of the age-standardised all-cause mortality rates in the linked SHS compared with the rates derived from routine deaths data suggest that the rates may be underestimated by 33% for men and 20% for women.37 The all-cause mortality rates in the linked HSE and SHS studies here were 31% and 21% lower than in the English and Scottish populations, respectively. Routine data suggest that alcohol-related deaths are approximately twice as high in the Scottish population as in England and Wales,39 yet the age-adjusted and sex-adjusted HR in the Scottish studies compared with the English studies was over five. These all suggest that the healthy respondent effect may be more acute for the English studies. Furthermore, the Scottish data are for a slightly earlier period. Both of these factors will have inflated the HRs comparing the Scottish with the English studies.
Comparison with the existing literature and implications
The excess age-standardised and sex-standardised mortality in the Scottish studies in this study is 40%, more than double that seen using routine data for all ages around 2001 when the difference was 15%.8 Just under half of the excess in 2001 could be explained by area deprivation, but very little of the excess in this study could be explained by individual occupational social class or educational attainment. A recent review of the potential explanations for the excess mortality in Scotland suggested that behavioural factors were unlikely by themselves to explain the differences, and this is confirmed by these analyses—with only smoking explaining a substantial proportion (about a quarter) of the excess. This analysis also concurs with the finding of a greater excess mortality among young adults, and that the excess is seen across most of the socioeconomic spectrum, but is skewed towards the more deprived groups.20 ,21 ,32 ,40 ,41
Self-rated health in Scotland has been shown to be worse than in England and Wales and worse in Greater Glasgow as compared with a range of other European metropolitan areas. Unlike in this study, in those analyses, the excess in Scotland could entirely be accounted for by differences in economic activity, but the excess in Glasgow could not be explained by social class and educational attainment.42 ,43 The value of self-rated health as an outcome measure in investigating the mortality phenomena in Scotland is therefore unclear, particularly since there are socioeconomic, demographic and cultural factors which may lead to artefactual differences between population groups.44 ,45
Further work is therefore required to explore factors which are not routinely collected in health surveys or administrative data, which might explain the excess mortality in Scotland. This includes more sensitive measures of the lived experience of poverty, the role of social support within communities, greater understanding of the impact of historical46 ,47 and cultural influences and the differential impact of local and national politics on health outcomes.12 ,13 Further work is also required to examine why psychological distress appears to be more toxic to health in Scotland than in England.48
What is already known on this subject
Mortality in Scotland is higher than in the rest of west and central Europe and is improving more slowly. Relative to England and Wales, the excess is only partially explained by area deprivation.
What this study adds
Mortality was 40% higher in Scottish cohort members than in English cohort members, and only around a quarter was explicable by socioeconomic, behavioural, anthropological or biological factors.
References
Supplementary materials
Supplementary Data
This web only file has been produced by the BMJ Publishing Group from an electronic file supplied by the author(s) and has not been edited for content.
Files in this Data Supplement:
- Data supplement 1 - Online supplement
Footnotes
Contributors GDB originally conceived the study. The research questions and analysis plan were devised by TCR, DW, GM and GDB. ES acquired, cleaned and prepared the data set. TCR performed the analysis with support from JL. GM drafted the manuscript. All authors provided substantial critical input to improve the manuscript and all authors approved the final draft.
Funding The Health Survey for England is part of a programme of surveys commissioned by The UK National Health Service Information Centre for Health and Social Care. It has been carried out since 1994 by the Joint Health Surveys Unit of the National Centre for Social Research (NatCen) and the Department of Epidemiology and Public Health at the University College London Medical School. The Scottish Health Survey is funded by the Scottish Government. Funding from the BBSRC, EPSRC, ESRC and MRC is gratefully acknowledged.
Competing interests TCR is supported by Alzheimer Scotland and he is employed in the NHS by the Scottish Dementia Clinical Research Network, which is funded by the Chief Scientist Office (part of the Scottish Government Health Directorates). He is a member of the Alzheimer Scotland Dementia Research Centre funded by Alzheimer Scotland. TCR and GDB are members of the University of Edinburgh Centre for Cognitive Ageing and Cognitive Epidemiology, part of the cross council Lifelong Health and Wellbeing Initiative (G0700704/84698).
Provenance and peer review Not commissioned; externally peer reviewed.
Data sharing statement We do not own the data used in this study. They are available from the relevant Scottish Health Survey and Health Survey for England teams.