Article Text

Abstract
Background Glasgow, the largest city in Scotland, has high levels of deprivation and a poor-health profile compared with other parts of Europe, which cannot be fully explained by the high levels of deprivation. The ‘excess’ premature mortality in Glasgow is now largely attributable to deaths from alcohol, drugs, suicide and violence.
Methods Alcohol-related mortality in Glasgow from 1980 to 2011 was examined relative to the equally deprived UK cities of Manchester and Liverpool with the aim of identifying differences across the cities, with respect to gender, age and birth cohort, that could help explain the ‘excess’ mortality in Glasgow.
Results In the 1980s, alcohol-related mortality in Glasgow was three times higher than in Manchester and Liverpool. Alcohol-related mortality increased in all three cities over the subsequent three decades, but a sharp rise in deaths in the early 1990s was unique to Glasgow. The increase in numbers of deaths in Glasgow was greater than in Manchester and Liverpool, but there was little difference in the pattern of alcohol-related deaths, by sex or birth cohort that could explain the excess mortality in Glasgow. The recent modest decrease in alcohol-related mortality was largely experienced by all birth cohorts, with the notable exception of the younger cohort (born between 1970 and 1979): women in this cohort across all three cities experienced disproportionate increases in alcohol-related mortality.
Conclusions It is imperative that this early warning sign in young women in the UK is acted on if deaths from alcohol are to reduce in the long term.
- Alcohol
- Mortality
- Deprivation
This is an Open Access article distributed in accordance with the Creative Commons Attribution Non Commercial (CC BY-NC 3.0) license, which permits others to distribute, remix, adapt, build upon this work non-commercially, and license their derivative works on different terms, provided the original work is properly cited and the use is non-commercial. See: http://creativecommons.org/licenses/by-nc/3.0/
Statistics from Altmetric.com
Introduction
Scotland has the highest working age mortality rate in western Europe;1 improvements in the nation's health faltered in the 1950s2 when overall life expectancy in the country increased more slowly than in other comparable European countries. The excess poor health in Scotland is in part due to greater deprivation in the city, supporting the call to reduce material and social inequalities.3 However, the excess mortality in Scotland cannot be fully explained by either deprivation4 or the country's postindustrial past.5 Indeed, in the past few decades the health gap between Scotland and the rest of Great Britain—that cannot be explained by deprivation—has increased.4 The phrase ‘Scottish effect’ has been coined to describe this unexplained health gap.
This excess poor health is also evident in Glasgow.6 Health in Glasgow was compared with that in Manchester and Liverpool—two English cities with similar levels of poverty, poor health and histories of industrialisation and deindustrialisation. Premature mortality (<65 years of age) in Glasgow was 30% higher than in the other two English cities.6 Initially the excess mortality in Scotland was largely caused by deaths from chronic conditions such as cardiovascular disease and ischaemic heart disease but by the 1990s excess mortality was largely caused by deaths from alcohol, drugs, suicide and violence7: alcohol-related mortality in Glasgow was twice as high than in Liverpool and Manchester by the mid-2000s.
Trends in alcohol-related deaths for both Scotland and the UK have markedly deviated from other western European countries. Over the last 50 years, liver cirrhosis mortality has decreased dramatically in southern and (parts of) western Europe, but has increased in both Scotland and England and Wales, with a particularly sharp increase in Scottish rates in the early 1990s. By the 2000s, deaths in Scotland from chronic liver disease were the highest in western Europe.1 ,8
Alcohol-related deaths have a strong deprivation and gender gradient. In the Glasgow area alcohol-related deaths in the most deprived quintile was seven times higher than in the least deprived quintile, and were three times higher in men than in women.9 The recent increase in alcohol-related deaths in Scotland has been felt disproportionately by those living in deprived areas, by men and young adults.10 In the last 5 years alcohol-related deaths in Scotland have stabilised, albeit at levels markedly higher than their European counterparts.1 ,9 ,11 It is not fully clear how these trends in alcohol deaths are being experienced across urban populations and if differential trends can explain the higher levels seen in Glasgow relative to Manchester or Liverpool.
The following analysis explores the trends in alcohol-related deaths from the 1980s to 2011 in Glasgow relative to Liverpool and Manchester, specifically exploring influences of age, period effectsi and birth cohort.ii
Methods
Data sources
Scottish population and death data were obtained from the National Records of Scotland. Death data by local authority were available from 1979, and population data from 1981. Population and death data for Liverpool and Manchester were obtained from the Office for National Statistics (ONS).
Definitions
Current local authority boundaries were used to define cities. Seven birth cohorts were included in the analysis, those born in decades 1910–1919; 1920–1929, 1930–1939; 1940–1949; 1950–1959, 1960–1969 and 1970–1979.
Alcohol-related deaths were defined using the ONS definition (International Classification of Diseases (ICD)-10 codes: F10 (mental and behavioural disorders due to use of alcohol), G31.2 (degeneration of nervous system due to alcohol), G62.1 (alcoholic polyneuropathy), I42.6 (alcoholic cardiomyopathy), K29.2 (alcoholic gastritis), K70 (alcoholic liver disease), K73 (chronic hepatitis, not elsewhere classified), K74 excluding K74.3–K74.5 (fibrosis and cirrhosis of liver, excluding biliary cirrhosis), K86.0 (alcohol-induced chronic pancreatitis), X45 (accidental poisoning by and exposure to alcohol), X65 (intentional self-poisoning by and exposure to alcohol) and Y15 (poisoning by and exposure to alcohol, undetermined intent). ICD-9 codes: Alcohol-related deaths are defined using the ICD-9 codes: 291 (alcoholic psychoses), 303 (alcohol dependence syndrome), 305.0 (non-dependent abuse of alcohol), 425.5 (alcoholic cardiomyopathy), 571.0 (alcoholic fatty liver), 571.1 (acute alcoholic hepatitis), 571.2 (alcoholic cirrhosis of liver), 571.3 (alcoholic liver damage, unspecified), 571.4 (chronic hepatitis), 571.5 (cirrhosis of liver without mention of alcohol), 571.8 (other chronic non-alcoholic liver disease), 571.9 (unspecified chronic liver disease without mention of alcohol) and E860 (accidental poisoning by alcohol).
To examine if there were differences in the types of alcohol-related deaths across cohorts, the cause of death was further grouped into the following categories: mental health and behavioural 291, 303, 305.0, F10; alcoholic liver disease or other liver damage 571.0–571.5, 571.8, 571.8, K70, K73, K74 (excluding K74.3–K74.5); damage to organ other than liver 425.5, G31.2, G62.1, I42.6, K29.2, K86.0; poisoning E860, X45, X65, Y15.
Analysis
Death rates were standardised to the European Standard Population. Five years of death data were used to generate mortality rates with 5-year rolling averages presented. To calculate mortality rates for the birth cohorts, the birth cohort-specific population at the time of death was used as a denominator (ie, to calculate the mortality rate for the year 1999 for the 1960–1969 birth cohort the denominator was calculated as the number of people in the population in 1999 who were born between 1960 and 1969) and the cohort-specific number of alcohol-related deaths used as the numerator (ie, the total number of alcohol-related deaths in 1999 in those born between 1960 and 1969). Birth cohort analysis was presented as crude rates. Analysis was performed using SPSS (V.18).
Results
City-level trends
At the beginning of the observation period, in the early 1980s, rates in Glasgow were three times higher than in Manchester and Liverpool. Across the subsequent three decades alcohol-related mortality increased in all three cities. The increase in Glasgow was larger, in absolute terms, than in Liverpool or Manchester; at its peak the annual number of deaths in Glasgow had increased by 39/100 000,iii while for both Manchester and Liverpool the increase was 19/100 000.iv However, in relative terms the increase across the cities was comparable.
A marked increase in alcohol-related deaths, beginning in 1993, was seen in Glasgow, and to a lesser extent in other parts of Scotland (data not shown). This ‘stepped’ increase is in contrast with the picture in both Manchester and Liverpool where the increase was largely linear across the three decades (figure1).
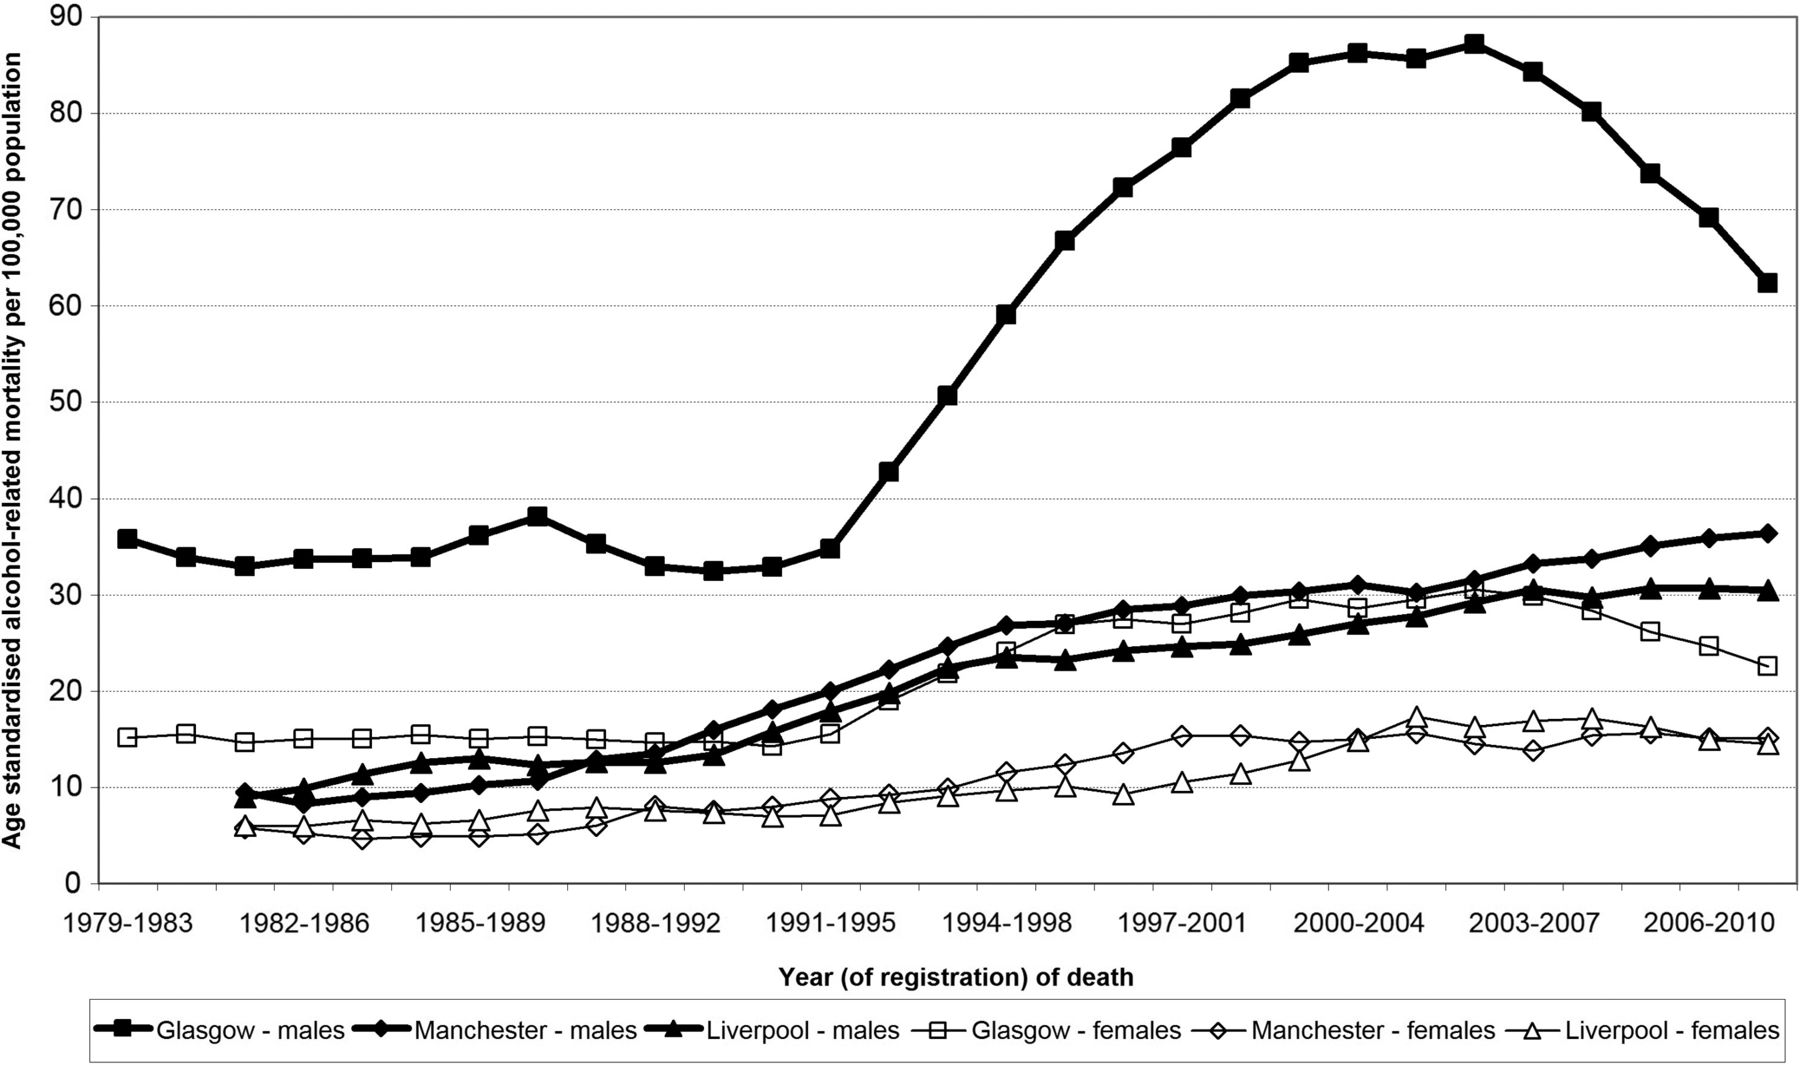
Age standardised alcohol-related mortality, by city and sex (1979–2011).
In all three cities, however, the alcohol-related death rate stabilised in the early 2000s, with some decrease seen in the late 2000s. In Glasgow this fall was greater, in absolute and relative terms, than in the other two cities.
Trends by sex
Although the rates of alcohol-related deaths were approximately two to three times higher in men compared with women in all three cities, within cities the pace and timing of the increase in deaths was similar across the sexes (figure 1), that is, at the city-level there was no evidence that the trends in alcohol-related deaths in women have lagged behind those for men.
Trends by age
Current male alcohol-related deaths (2007–2011) have similar age profiles in the three cities, with the highest burden of alcohol-related deaths seen in men in their 40s and 50s (figure 2). Comparing the current age profile with that in the early 1980s it is clear that there has been little change in the age profile between the two time points in Glasgow but there was a significant change in Liverpool and Manchester. The age patterning of alcohol-related mortality in women reflected that seen in men for all three cities.
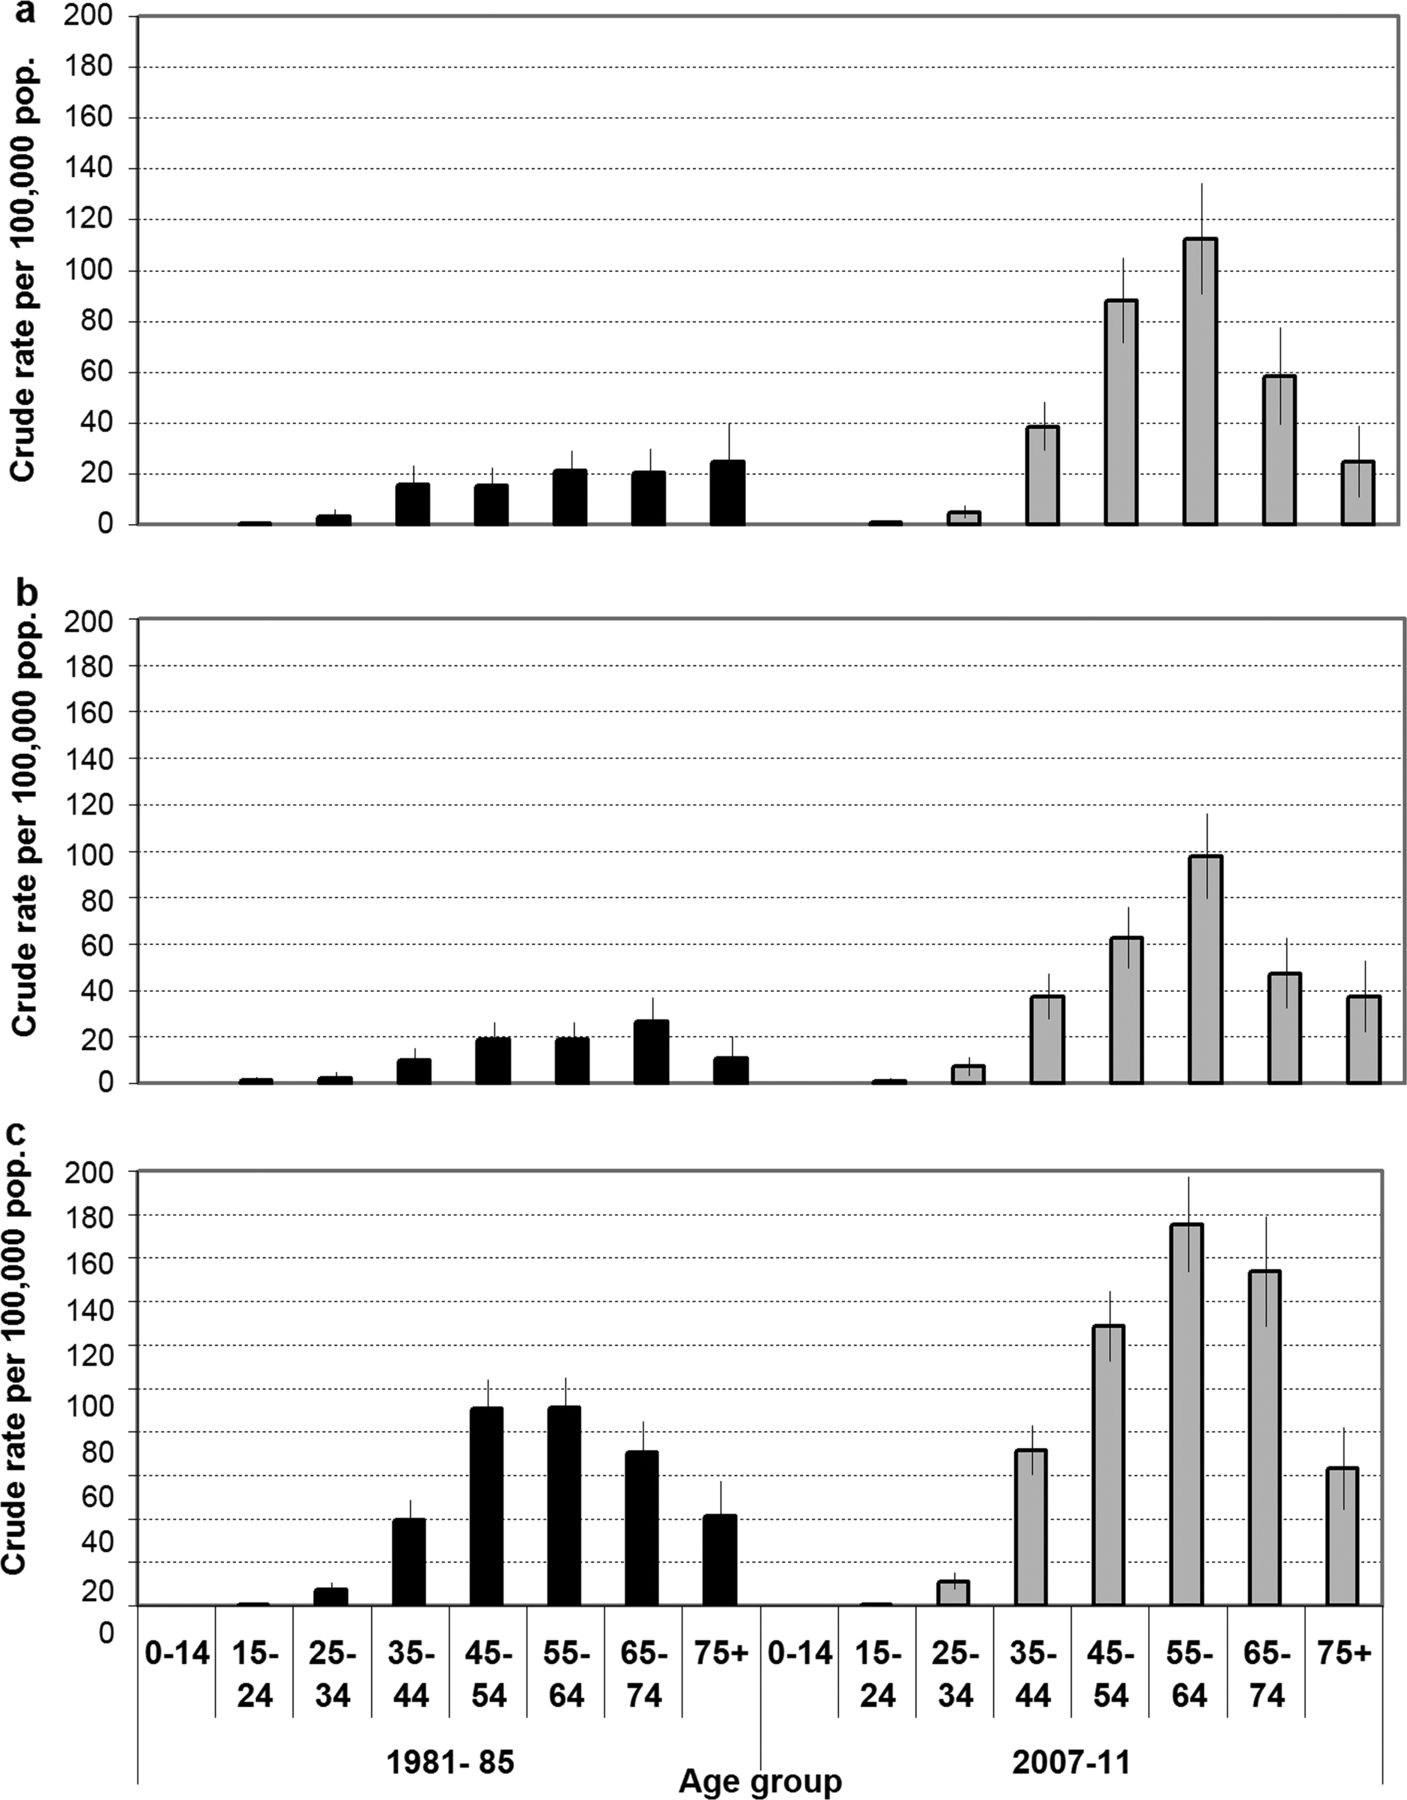
Crude male alcohol-related mortality/100 000 population by city at two time periods (1981–1985 and 2007–2011) for Manchester (A) Liverpool (B) and Glasgow (C).
Birth cohort analysis
Characteristics unique to a cohort of individuals (ie, born around the same time)—such as their early years environment, cultural messages around the time of their introduction to alcohol and so on—will also be associated with alcohol-related mortality. Following alcohol-related mortality within birth cohorts across time allows the influence of cohort-specific factors to be explored.
The oldest cohort examined was born in the 1910s and the youngest cohort was born in the 1970s. Each birth cohort will necessarily have a different age profile over the observation period. For example, the oldest birth cohort (born between 1910 and 1919) was 69 years old at the beginning and 92 years old at the end of the observation period; the cohort born in the 1940s was 39 years old at the beginning and 64 years old at the end of the observation time.
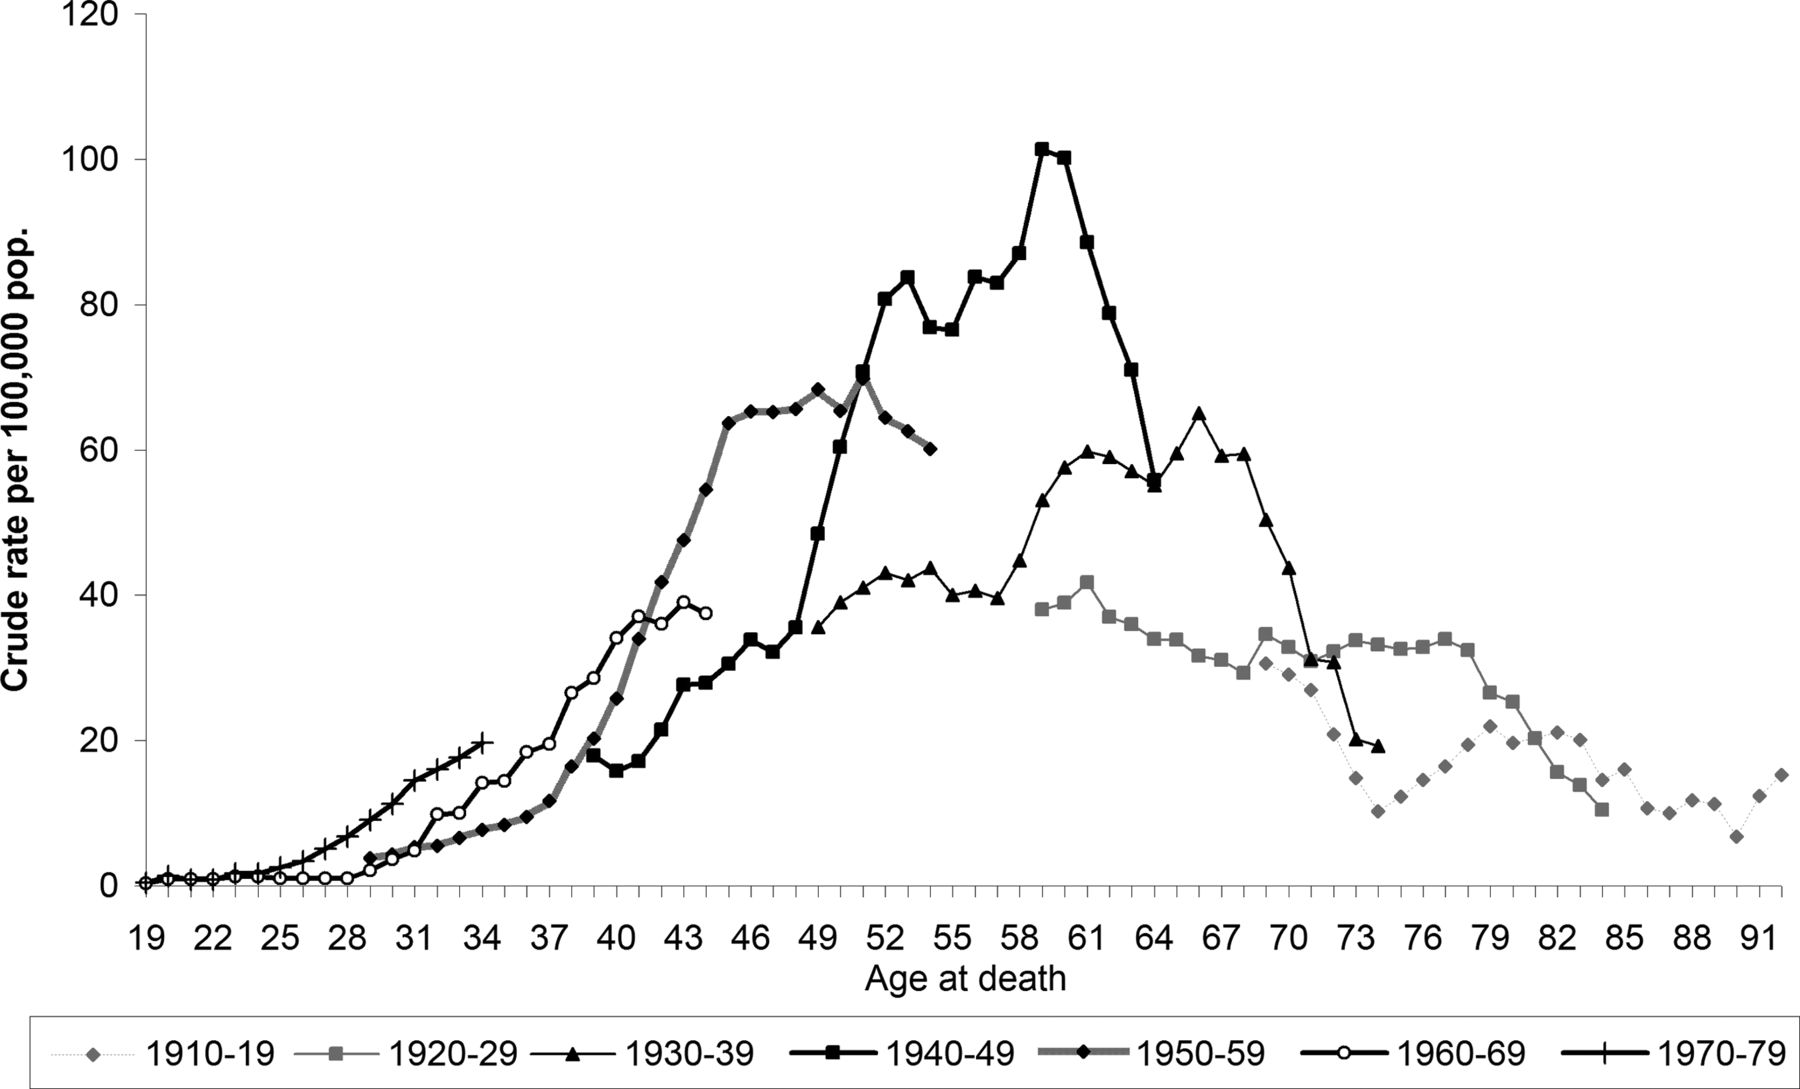
Taking first the cohort analysis for Glasgow males, the alcohol-related mortality in the calendar period 1982–2011 is shown for seven different birth cohorts (figure 3). The alcohol-related death rates for a 12-year period (1979/1983v to 1991/1995), for each birth cohort, are shown (figure 3A). The first data point for each cohort shows the cohort-specific death rate in the 1979–1983 calendar period. The data in this figure extends to 1991–1995 period, prior to when the early 1990s period effect—the steep rise in mortality in Glasgow—becomes evident.

Alcohol-related mortality (crude rate/100 000), from periods 1979–1983 to 1991–1995 (A), 1979–1983 to 2002–2007 (B), 1979–1983 to 2007–2011 (C) in Glasgow city, men. Arrows represent the 1992–1996 (B) and 2002–2007 (C) calendar periods.
The death rate for each of the seven birth cohorts was largely tracking that of the previous generation (figure 3A). For example, if the data for the 1940s birth cohort (square symbols) were extrapolated to show the predicted death rate for this cohort as it aged beyond 48 years of age these data suggest that this cohort would follow the alcohol-related death rate of the cohort before it (the 1930s birth cohort—triangle symbols). Taking the data from across all the seven birth cohorts the alcohol-related death rate began to rise in those aged 30–40 years of age, reaching a plateau in those 50 and 60 years of age, before falling in those over 65 years of age. This age patterning of alcohol-related deaths is typical of that seen in figure 2 and elsewhere.13–15
The sharp increase in alcohol-related deaths in Glasgow from 1993 is evident when additional data are included in the birth cohort analysis. Figure 3B includes the data shown in figure 3A (solid symbols), but now also includes the deaths rates for a further 10 years (open symbols), up to the 2001–2005 period. The arrows identify the 1992–1996 calendar period for each cohort, where a rise in alcohol-related death rates was seen in all cohorts, with the exception of the youngest cohort (those born between 1970 and 1979). The steepness of the increase varied across the cohorts; the 1940s and 1950s birth cohorts showed the steepest rise. These cohorts were in their 40s and 50s during 1992–1996 period. In the youngest four cohorts the alcohol-related death rates continued to rise throughout this period, while in the oldest three cohorts the rate began to fall towards the end of this period.
Figure 3C includes the data shown in figure 3B (solid symbols), but now also includes the death rates for a further 6 years (open symbols), up to the 2007–2011 period. The arrows indicate the 2002–2007 calendar period, when city-level falls in alcohol-related deaths were observed. In all but the youngest cohort a fall in alcohol-related deaths is seen during this period.
Although alcohol-related deaths were significantly lower in women compared with men in Glasgow, birth cohort analysis of alcohol deaths in women (figure 4) largely reflected that seen in men—there was no evidence of a lag in female alcohol-related deaths. A notable difference was observed in the youngest cohort, that is, women born in the 1970s. Unlike in men, women in this youngest cohort were suffering alcohol-related deaths in notable numbers at a much younger age than in the previous cohort. The effect is that the gap between women and men in this youngest age group is closing. The disproportional increase in alcohol-related deaths in these young women occurred in the late 1990s and early 2000s, that is, representing a separate phenomenon to the early 1990s rise in Glasgow.

Alcohol-related mortality (crude rate/100 000): Glasgow city, women (1979–2011).
Birth cohort analyses for Liverpool and Manchester produced broadly similar trends to those seen for Glasgow (figure 5), although there were some city-cohort specific differences. The birth cohort analysis confirms results of city-level analyses, where in Liverpool and Manchester there is no obvious early 1990s period effect with the rates instead increasing in a more linear fashion. The solid vertical arrows indicate the 1992–1996 calendar period—when alcohol-related deaths in Glasgow began to rise sharply—and it can be seen that the rates in both Liverpool and Manchester began to depart from the trajectory indicated by the previous birth cohort before this calendar period. It is worth mentioning a few important cohort-specific trends: in Manchester, deaths in both the 1950–1959 and the 1940–1949 birth cohorts continued to rise, with no evidence of these cohorts experiencing the plateau in the death rate seen in most other cohorts.

Alcohol-related mortality (crude rate/100 000): men 1982–2011 in Manchester (A) and Liverpool (B). Arrows represent the 1992–1996 calendar period, when the sharp rise in alcohol-related deaths occurred in Glasgow.
As in Glasgow, alcohol-related deaths in the youngest cohort of females in Manchester and Liverpool increased faster, in relative terms, compared with men (female data not shown)—that is, although the absolute number of deaths was greater in men than women, the alcohol-related deaths in women in Liverpool and Manchester increased at a faster rate such that the gap between men and women has narrowed.
Cause of death
Across all cohorts the majority of alcohol-related deaths in Glasgow were classified as liver-related (71%), a further 26% were categorised as mental health or behavioural and a small number were classified as involving other organs (2%) or alcohol poisoning (<1%). The distribution of causes varied by age and sex; alcohol-related deaths in older individuals and among women were moderately more likely to be liver related than mental health related.
However, once age was accounted for the pattering of cause of death was similar across the cohorts. The disproportionate increase in alcohol-related deaths in women from the 1970 to 1979 birth cohort was still observed when birth cohort analysis was limited to the alcohol-related deaths that were liver-related (data not shown).
Discussion
With the aim of exploring alcohol-related mortality that is not explained by deprivation these analyses compared trends in Glasgow with the equally deprived UK cities of Liverpool and Manchester. Around the middle of the last century alcohol-related deaths in Scotland began to rise above that in England,13 reflecting underlying differences in the two countries. It is not known exactly when the alcohol-related death rate in Glasgow began to depart from that in Manchester and Liverpool, but by the early 1980s it was already significantly higher than in the other two cities. As with the national picture there would have been factors particular to Glasgow driving the increase in alcohol-related deaths. However, aside from the early 1990s period effect in Glasgow, the findings from this work fail to show an obvious difference in the patterning of alcohol-related deaths in the previous three decades between the cities that would go some way to explain the excess alcohol-related mortality in Glasgow relative to Liverpool or Manchester. Although alcohol-related deaths are lower in women compared with men, female trends in all three cities largely mirrored those seen for males (an important exception is discussed later), with no evidence that death rates in women is lagging behind men, as was seen with smoking-related deaths.1 Birth cohort analysis showed broadly similar effects across all three cities. One interpretation of this relative similarity in recent decades in the three cities is that the differences highlighted in figure 1 are largely a matter of scale and that the observed difference in level of deaths across these cities reflects baseline differences in vulnerability or susceptibility that have their origins half a century before.
The marked period effect in Glasgow in the early 1990s—where alcohol-related deaths tripled in a decade—was absent in both Manchester and Liverpool; although there is evidence of a less dramatic early 1990s period effect at the national level in England and Wales.1 ,16 Regions in the UK which experienced the greatest increases in alcohol-related deaths include the Glasgow, the North East and North West (which includes Liverpool and Manchester) of England, Belfast (in Northern Ireland) and South Wales. These are all areas with considerable deprivation and share a postindustrial past. Although other postindustrial regions in Europe experienced poor health as a result of the postindustrial decline, increasing alcohol-related deaths was not consistently seen across these regions17 suggesting increased alcohol-related harm is not necessarily a by-product of industrial decline.
The negative impact of increased affordability and availability of alcohol on alcohol-related mortality is well evidenced.1 ,18 ,19 The UK-wide increase in alcohol consumption (driven by increases in wine consumption11), is linked to increases in alcohol availability and affordability,20 ,21 together with the promotion of alcoholic drinks by the alcohol industry22 and promotion of the night time economy by successive governments.23 However, there is no obvious single cause of the early 1990s sharp increase in Glasgow. The Scottish Licensing Act of 1976 extended the permitted hours of sale of alcohol in Scotland, 10 years before England and Wales permitted similar licensing hours (1987). In addition, the number of licensed premises in Scotland increased dramatically in the 1980s and 1990s.24 Alcohol sales data show that Scotland consumes significantly more spirits than England and Wales, although the levels of spirits consumed has been largely static in both countries over the last three decades.11 Some suggest that the ways in which alcohol is consumed has changed—for example, more heavy episodic drinking. Although with no robust and detailed population level consumption data available on how people are drinking, other than those based on self-reported survey data which is known to be unreliable,25 it is difficult to explore the influence of drinking patterns on alcohol-related harm.
Alcohol-related mortality fell in all three cities in the late 2000s, with larger falls—in absolute and relative terms—in Glasgow. However, birth cohort analysis showed that this city-wide fall in alcohol-related mortality was not universally experienced across all age groups. In the youngest cohort, born in the 1970s, alcohol-related mortality increased across all three cities during this time. This was particularly notable for women, where the relative increase was greater than in men. Young adults in Scotland appear to be particularly vulnerable; trends in all-cause mortality among 15-year-olds to 44-year-olds has been on the rise or flat since the early 1990s and deaths from alcohol, drugs and suicide, which predominantly occur in young adults, have also either been on the increase or flat.1 The similarity of trends in alcohol-related deaths in young women in Glasgow, Manchester and Liverpool raises real concerns for the long-term health of this cohort in both England and Scotland. Specific to Manchester is the alarming trends seen in the 1940s and 1950s birth cohorts, where alcohol-related mortality shows no sign of stabilising. Further work is required to determine what factors unique to Manchester that are driving these city-specific trends. For example, Manchester has significantly higher levels of population movement in and out of the city than either Liverpool or Glasgow, and a younger population.vi
The general decrease in alcohol-related deaths seen from the mid-2000s also lacks an obvious explanation, although several legislative measures came into force in the late 2000s. Devolution in 1998 enabled separate alcohol policies to develop between Scotland and the rest of the UK, although several areas remain under the control of Westminster (ie, non-devolved), such as alcohol advertising and taxation. The Licensing (Scotland) Act 2005 which came into force in 2009 allows more control of the number of licensed premises, restricted irresponsible promotions and up-selling (a sales technique whereby a customer is encouraged to buy more than they initially intended). A modest fall in the number of licensed premises in Scotland has been seen between 2006 and 2011. In the late 2000s the sale of alcohol to those under 18 years of age was tightened (Test Purchasing Scheme, 2007). However, during the last few decades trading hours have generally been extended in Scotland with the most recent relaxation in trading hours coming into effect as recently as 2005 (UK Licensing Act, 2003). Longer trading hours are known to lead to increased consumption.19 It is not clear if or how these changes are related to the recent falls in alcohol-related mortality. Significant falls in alcohol-related deaths without obvious explanations have also been seen in other countries.14
The shifting landscape of the excess mortality in Scotland—originally from cardiovascular disease and ischaemic heart disease and now to alcohol, drugs, suicide and violence—points to deep-rooted societal level factors driving the excess poor health in Scotland; the recent rise in alcohol-related deaths is likely to be a symptom of these wider societal-level influences.3 ,26 Tackling the alcohol-specific causes of the poor health in Glasgow, although important, alone is unlikely to improve the health of those in Glasgow.
In conclusion, there are two main points to reiterate. First, the broad similarities between the three comparison cities in trends in alcohol-related mortality across the sexes and birth cohorts suggest common factors are driving current trends in alcohol-related deaths in Scotland and England. Therefore, the difference in absolute numbers of deaths in Glasgow compared with Liverpool and Manchester reflects historical rather than contemporary differences. What does this mean for strategies to reduce alcohol-related deaths in Glasgow? The challenge for Glasgow is to not only mitigate against the current factors that are driving increased alcohol deaths UK-wide, such as alcohol affordability and availability, but also to tackle the deep-rooted influences that likely have their origins half a century before. For example, the introduction of minimum unit pricing is required to tackle the proximal influences of alcohol affordability but additional responses are required to tackle the deeper-rooted cultural influences at play.
The second important finding is the increase in alcohol-related deaths in the younger cohort, particularly in women. It is imperative that this early warning sign is acted upon. Given this increase in the younger cohort is seen in all three cities it is hard to dismiss this as a city-specific phenomenon. Failure to have a policy response to this new trend may result in the effects of this increase being played out for decades to come.
What is already known on the subject
-
Glasgow has a high alcohol-related mortality rate, only a portion of which is explained by the high levels of deprivation in the city.
-
Alcohol-related mortality in Glasgow, as in the rest of the UK, has been increasing over the previous three decades, with modest reductions seen in recent years.
What this study adds
-
Patterns of alcohol-related deaths in Glasgow and equally deprived Manchester and Liverpool show few major differences that could explain the current excess alcohol-related mortality in Glasgow.
-
Recent decreases in alcohol-related deaths have been experienced across the population, with the exception of young women where worrying increases in alcohol-related deaths are seen.
-
Historical rather than current factors are suggested as driving the excess mortality in Glasgow–policy responses to excess alcohol-related mortality need to address the deep-rooted societal factors as well as the more contemporary factors such as increased alcohol availability and affordability.
References
Supplementary materials
Press release
Press release
Files in this Data Supplement:
- Press release - Press release
Footnotes
-
Contributors DS conceived the study, planned and conducted the analysis and reported the work. BW and DW contributed to the planning, the analysis and the reporting of the work and provided data. All authors read and approved the final manuscript.
-
Competing interests None.
-
Provenance and peer review Not commissioned; externally peer reviewed.
-
Data sharing statement The mortality data on which these analysis are based are available publicly. The authors are happy to share the manipulated dataset.
-
↵i Period effects are changes in alcohol deaths that occur in a certain calendar period. They result from population-wide changes, such as changes in alcohol availability or affordability.
-
↵ii Cohort effects, or generational effects, reflect different alcohol-related death rates by year of birth. This might result from a population-wide influence at a particular period in time having a different influence on the different generations. For example, increased alcohol affordability might disproportionately affect the younger cohorts. Alternatively, the accumulation of the many different circumstances surrounding a particular cohort as it matures might result in a cohort being particularly at risk.12
-
↵iii In Glasgow the annual rate rose from 24/100 000 in 1981 to 64/100 000 in 2008.
-
↵iv The annual rate in Manchester rose from 8/100 000 in 1981 to 27/100 000 in 2008, and in Liverpool rose from 6/100 000 in 1981 to 26/100 000 in 2007.
-
↵v 5 years of data are used to show 5 year rolling averages.
-
↵vi Migrants usually having better health than those that remain; international immigrants from ethnic minorities will likely have lower alcohol consumption levels than the static local population; national immigrants to the city on the other hand, especially those moving in for employment, are likely to be younger and have higher alcohol consumption levels that the local general population.