Article Text

Abstract
Background In this study, the authors investigate gender-specific effects of childhood socio-economic position (SEP) on adiposity and blood pressure at three time points in adulthood.
Methods Mixed models were used to assess the association of childhood SEP with body mass index (BMI), waist circumference, systolic blood pressure (SBP) and diastolic blood pressure (DBP) at ages 36, 43 and 53 years in a British birth cohort.
Results The adverse effect of lower childhood SEP on adiposity increased between ages 36 and 53 years in women (BMI: trend test: p=0.03) and remained stable in men, but the opposite was seen for SBP, where inequalities increased in men (p=0.01). Childhood SEP inequalities in DBP were stable with age in both men and women. Educational attainment mediated some but not all of the effects of childhood SEP on adiposity and SBP, and their rate of change; adult social class was a less important mediator.
Conclusion Childhood SEP is important for adult adiposity and blood pressure across midlife, especially for BMI in women and for blood pressure in men. Thus, pathways to adult health differ for men and women, and public health policies aimed at reducing social inequalities need to start early in life and take account of gender.
- Childhood social class
- education
- adult social class
- adiposity
- blood pressure
- body mass index (BMI)
- waist circumference
- gender differences
- trajectories
- life-course
- gender inequalities
- longitudinal studies
- social class
This is an open-access article distributed under the terms of the Creative Commons Attribution Non-commercial License, which permits use, distribution, and reproduction in any medium, provided the original work is properly cited, the use is non commercial and is otherwise in compliance with the license. See: http://creativecommons.org/licenses/by-nc/2.0/ and http://creativecommons.org/licenses/by-nc/2.0/legalcode.
Statistics from Altmetric.com
- Childhood social class
- education
- adult social class
- adiposity
- blood pressure
- body mass index (BMI)
- waist circumference
- gender differences
- trajectories
- life-course
- gender inequalities
- longitudinal studies
- social class
Introduction
Associations between low childhood socio-economic position (SEP) and an increased risk of adult cardiovascular disease (CVD) and premature mortality have been consistently reported in the literature.1 ,2 Possible factors acting in childhood and infancy which may contribute to this association include birth weight, undernutrition and poor growth.3 ,4 It is also likely that childhood SEP can affect cognitive development and educational level,5 which in turn might influence adult health-related behaviour and CVD risk. Previous studies have reported associations between childhood SEP and the CVD risk factors high blood pressure4 ,6–8 and obesity,7–16 but the strength of these associations is somewhat inconsistent across studies, depending on the age and gender of the respondents.15 ,17 ,18 There is some evidence from cohort studies that the effects of childhood SEP on adiposity are more pronounced in women,16 ,19–22 and one potential explanation is gender differences in the SEP patterning of early growth and thereby adult CVD risk.
Only a few prospective studies have compared the association of childhood SEP with CVD risk factors at more than one point in adulthood,4 ,12–15 ,23 ,24 showing that the effect of childhood SEP increases with age. For example, one study reported that lower childhood SEP was associated with increased blood pressure from age 36 to 53 years, mostly because of increased BMI levels.4 However, in most studies, genders were collapsed4 ,12 and limited to young adulthood,13–15 ,23 and relied on self reports.24 It thus remains unclear if the effects of childhood SEP change across adult life similarly for men and women, which could have important implications for tailoring prevention and health promotion.
Using the MRC National Survey of Health and Development (NSHD), a large cohort of men and women followed from their birth in March 1946 until age 53 years, we investigate gender differences in adiposity and blood pressure from age 36 to 53 years. Second, we investigate the effect of childhood SEP on CVD risk factors at three adult ages, then whether these associations change over time differently in men and women, and finally whether any affects are mediated by adult SEP or education.
Methods
Data
The NSHD is a prospective birth cohort study of 2547 women and 2815 men, a socially stratified sample of all births that took place in England, Scotland and Wales during a week in March 1946.25 The current study uses CVD risk factor measurements made at age 36, 43 and 53 years. The analyses included 1845 men and 1822 women who had data recorded for at least one of these ages. Of the remaining 1695 participants, 345 had died, and 1350 had emigrated, were untraced or had previously refused to participate in the study.
Adiposity and blood pressure measures
Weight (kg), height (cm) and waist circumference (WC) (cm) were measured by trained personnel using standard procedures. WC, a measure of visceral fat, was taken at the midpoint between the costal margin and the iliac crest, and measured twice in 1982 and 1989. The mean value of the two measurements was used. If the second measurement was missing (56 in 1982 and 186 in 1989) the first was used. Body mass index (BMI) was used as a measure of adiposity and defined as weight/height2. Systolic blood pressure (SBP) and diastolic blood pressure (DBP) (mm Hg) at 36 and 43 years were measured using the Hawksley random zero sphygmomanometer, and at 53 years with the validated Omron HEM-705 (Omron Corp., Tokyo) automated digital oscillometric sphygmomanometer. The second blood pressure reading was used, except in cases when only the first was available. A constant of 10 mm Hg for SBP and 5 mm Hg for DBP was added to the blood pressure measures of those on antihypertensive medication.26 ,27
Socio-economic position
Childhood SEP was based on father's occupational class when study members were 4 years old, and defined by the UK General's Standard Occupation Classification (I and II (the most advantaged) (22%), III non-manual (18%), III manual (32%), IV and V (the least advantaged) (28%)). Adult SEP was based on the head of the household's occupation (for women the spouse's social class was used, unless it was missing, and then the woman's own social class was used) at age 36, 43 and 53 years and classified into the same groups (I and II (45%, 53% and 39% at 36, 43 and 53 years respectively among men; 40%, 51% and 48% among women), II non-manual (men: 10%, 9%, 31%; women: 16%, 12%, 14%), III manual (men: 32%, 28%, and 13%; women: 27%, 26%, 22%) and IV and V (men: 13%, 10%, 17%; women: 17%, 11%, 15%)). If the SEP at age 36 years was missing, then SEP at 43 years was imputed (N=340), and if this was missing too, then SEP at age 53 was used (N=84). Similarly, for age 43 years, 359 were imputed from SEP at 36 years and 84 from SEP at 53. For 53 years, 489 were imputed from SEP at 43 years and 248 from age 36. To investigate the impact of this imputation on the results, a sensitivity analysis was performed on the subgroup of the cohort for whom imputation of adult SEP was unnecessary, and results were similar (not shown). Highest education achieved by age 26 years (advanced degree level (university degree and equivalents) (men 13%; women 5%), advanced secondary qualifications (A-level) (men 26%; women 21%), ordinary secondary level (men 20%; women 29%), no formal qualifications (men 42%; women 45%)) was considered as a possible mediator. Those included with complete data on mediators (n=3410) did not differ for gender, childhood SEP, SBP, DBP or BMI from others seen at 36, 43 or 53 years (n=257). However, those excluded had a larger WC at age 36 and 43 years (p<0.01 and p<0.04).
Statistical methods
Crude mean values for the outcomes at each age were calculated separately by gender and childhood SEP. To test for gender differences, first, least-squares regression was used to test for gender differences in each outcome at each age. Then mixed models with random intercepts and slopes were used; an interaction term (age by gender) was added to test for differences in linear slopes between the genders. Inclusion of both random intercept and slope improved the fit of the models. Differences in outcome across the childhood SEP groups at each age were estimated with regression.
To further investigate the impact of childhood SEP on adiposity and blood pressure, the Slope Index of Inequality was used. This involved modelling the SEP measures as ridit scores (percentage of population with higher SEP than the midpoint of the category) whereby the regression coefficients can be interpreted as the absolute difference in outcome (eg, SBP) between the hypothetical individual at the top of the SEP hierarchy with that at the bottom. This index summarises absolute childhood SEP inequalities across all the social classes,28 and it accounts for the changing socio-economic distribution over time and the different distributions in genders. Also, it provides a single estimate of the association across the whole of the SEP distribution, and therefore clarifies presentation. Initially, for each age separately, the Slope Index of Inequality was modelled by least-squares regression, successively adjusting for education and adult SEP. To investigate changes with age, CVD risk factors were then modelled using mixed models, with the ridit score, gender and age as covariates. We then tested whether the effect of childhood SEP increased or decreased differently with age in men and women by including both sexes in the model and adding the three-way interaction (ridit score by age by gender) in addition to all the two-way interaction terms (ridit by age, ridit by gender and age by gender). The final model was adjusted for both education and adult SEP. In adjusted analyses, we restricted the sample to those with complete data on SEP in childhood, adulthood and education. Similar analyses were carried out for education and adult SEP. STATA 10.0 was used for all analyses.
Results
At 36 years, men had a higher mean BMI, WC and blood pressure (BP) than women, but by 53 years, gender differences in BMI had disappeared (table 1). Women had larger increases in BMI than men between 36 and 53 years (2.3 kg/m2 per 10 years in women vs 1.5 kg/m2 per 10 years in men; p value for gender difference <0.001) and WC (5.5 cm per 10 years in women vs 4.9 cm per 10 years in men; p value for gender difference=0.005). Men had higher mean SBP and DBP levels at 36, 43 and 53 years. In contrast to adiposity, SBP increased significantly faster in men than in women (11.0 mm Hg per 10 years in men vs 9.8 mm Hg per 10 years in women; p value gender difference=0.006). A similar gender difference was observed for DBP (5.6 mm Hg per 10 years in men vs 4.3 mm Hg per 10 years in women; p value gender difference <0.001).
Adiposity and blood pressure in men and women (mean and SD), estimate of change with age and test for gender differences
Lower childhood SEP was associated with higher BMI, WC and BP in both men and women at all ages (test for trend across classes p≤0.05 in all cases (except DBP in women at age 36; p=0.25) (table 2). Female BMI and WC at all ages were more influenced by childhood SEP than male BMI and WC (table 3). The effect of childhood SEP on BP was similar for men and women at the younger ages, but at 53 years inequalities were larger in men, although only for DBP was the gender difference significant (p value for gender difference=0.09 for SBP and p=0.03 for DBP). For adiposity, childhood SEP inequalities widened in women and were stable in men (p value for SEP×age×gender interaction=0.05 for BMI and p=0.07 for WC). For SBP, childhood SEP inequalities widened in men, while in women they remained unchanged. However, these SEP differences in trajectories did not differ significantly between men and women for either SBP or DBP.
Adiposity and blood pressure profile (mean (SD)) by childhood socio-economic position, age and gender
Childhood socio-economic position inequalities (Slope Index of Inequality, SII (95% CI)) in adiposity and blood pressure by age and gender
Lower education was associated with a higher BMI, WC and SBP in both men and women at all ages, except for SBP in women at 36 years (table 4). DBP was generally not associated with education, except at 53 years in men. Inequalities in adiposity increased in women but not in men, and the rates of change were different between genders (p value for ridit score by age×gender interaction=0.06 for BMI and 0.02 for WC). Educational inequalities in BP increased with age, although only for DBP in men was the change significant (p=0.03). Lower adult SEP was associated with higher female BMI, WC and SBP at all ages, but in men this association was only evident at 36 years for BMI, at 43 years for WC, and 36 and 43 years for SBP. In men, the SEP inequalities in adiposity narrowed, but there was no evidence of gender differences (p value for SEP by age by gender interaction=0.5 for BMI and 0.2 for WC). SBP and DBP showed no trend with age and no gender differences in changes in SEP with age.
Adult socio-economic position and education inequalities (Slope Index of Inequality, SII (95% CI)) in adiposity and blood pressure by age and gender
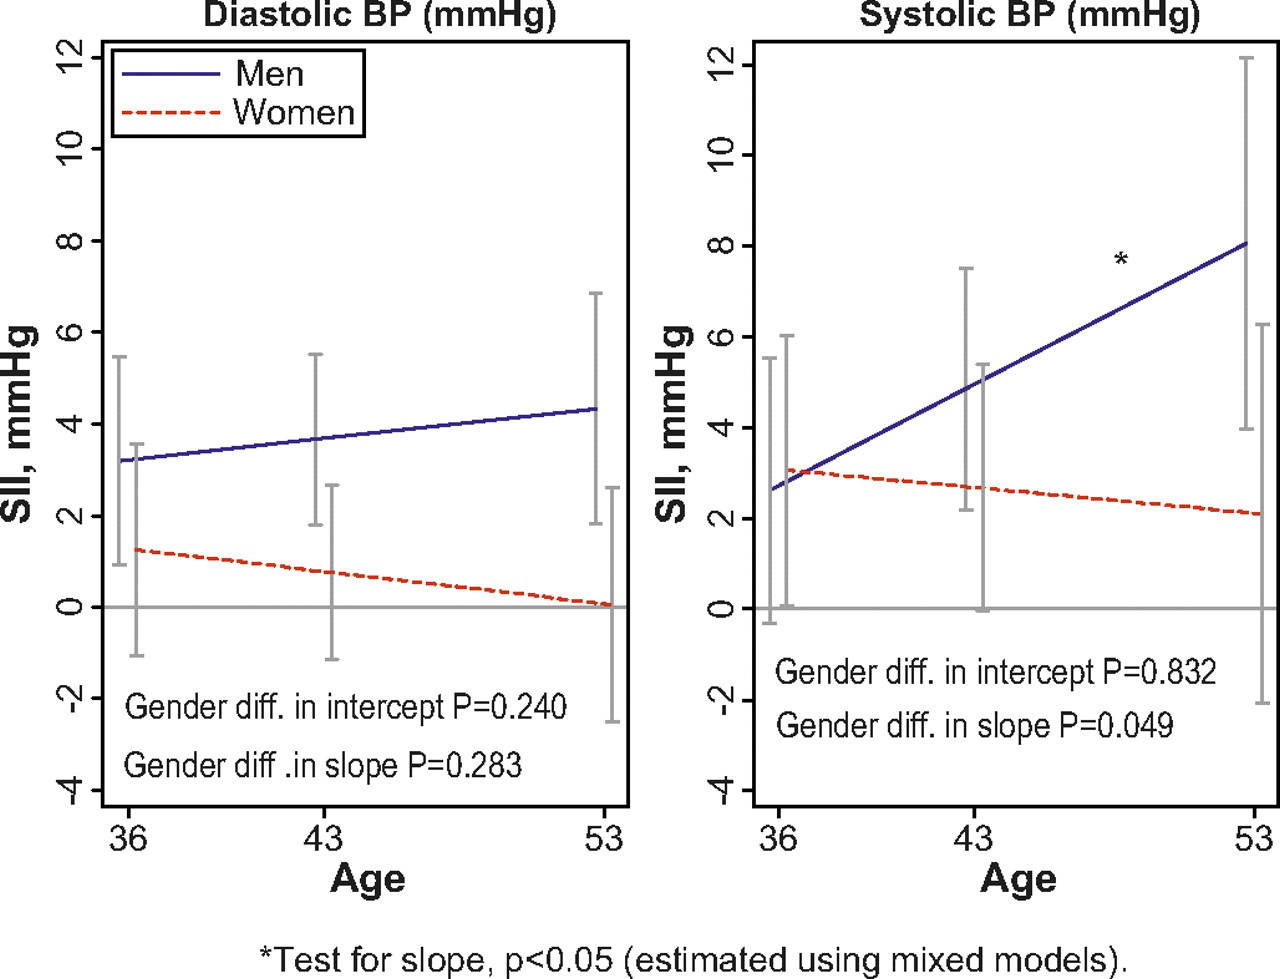
The mediating effects of education and adult SEP on the childhood SEP inequalities in the BMI, WC and SBP trajectories for men and BMI trajectories for women were modest (table 5). Adjusting for education reduced the positive childhood SEP slope for WC, especially in women, and steepened the negative slope for DBP. The widening rates of change in BMI in women and in SBP in men were both significant after adjustment for both education and adult SEP, while the other slopes did not reach conventional levels of significance. A graphical presentation of the fully adjusted childhood SEP inequalities by age slopes is given figures 1, 2.
Change (per 10-year) in childhood socio-economic position inequalities (Slope Index of Inequality, SII (95% CI)) in adult adiposity and blood pressure (negative numbers indicate reduced childhood socio-economic position inequalities with increasing age, and positive numbers indicate increased socio-economic position inequalities with increasing age)

Childhood SEP inequalities (Slope Index of Inequality, SII) in adiposity (Waist circumference and BMI) from age 36 to 53 years by gender. Adjusted for education and adult SEP. Error bars are 95% CIs.
Childhood SEP inequalities (Slope Index of Inequality, SII) in blood pressure (systolic and diastolic) from age 36 to 53 years by gender. Adjusted for education and adult SEP. Error bars are 95% CIs.
Discussion
Findings from this postwar British birth cohort showed that between 36 and 53 years of age, gender differences narrowed in BMI but widened in blood pressure. Low childhood SEP was associated with adult adiposity and blood pressure in men and women, and the change in these relationships between 36 and 53 years varied by gender and by outcome. The adverse effect of lower childhood SEP on adiposity increased in women and remained stable in men, but the opposite was seen for SBP, where inequalities increased in men. Educational attainment mediated some but not all of the effects of childhood SEP on adiposity and SBP in women, and their rate of change; adult social class was a less important mediator.
Our finding that childhood SEP effects on adiposity and blood pressure were similar across genders in early adulthood was reflected in a Finnish study of young adults.7 ,8 Likewise, our stable childhood SEP effects on adiposity in men and increasing effects in women are consistent with some findings in middle and older age,9 ,19–21 ,24 but not others.10 For blood pressure, the effect of childhood SEP is inconsistent across studies. A study of middle-aged Scottish men reported an unfavourable effect of low childhood SEP on DBP,6 and a similar effect on SBP was found in the study of young Finns.29 The Tecumseh Community Health Survey, The British 1958 Cohort and the Glasgow Alumni Cohort, with repeated measures of adiposity, suggest increasing absolute childhood SEP inequalities with increasing age.13–15 However, these results are not directly comparable with our study owing to the younger ages at which adiposity was measured. In agreement with our findings, childhood SEP inequalities in adiposity widened in a study of older Swedish women.11 Previous reports of the NSHD with repeated measures have shown adverse and increasing effects with age of low childhood SEP on adiposity12 and on blood pressure,4 but they did not report gender-specific results, and therefore masked the gender differences reported in this study.
In agreement with our results, several studies report that some of the childhood SEP effect is independent of adult SEP and education, especially for blood pressure,4 ,6 ,8 but also for adiposity.6 ,9 ,10 ,12 ,16 ,20 Adjustment for childhood SBP levels importantly mediated the effect of childhood SEP on adult SBP in the Finnish study,29 while childhood BMI was less important, which indicates that blood pressure levels track into adulthood from levels in childhood and adolescence.
The greater increases in adiposity in women compared with men in our study may be partly due to reproduction, as women gain weight having children,30 and also due to fewer women than men in this cohort having educational qualifications and thus benefiting less from the positive health-related effects of education.9 Also, women are more physically inactive,31–34 which could lead to greater weight gain. The greater midlife increase in blood pressure (SBP) in men compared with women has been observed before.35 The underlying mechanisms are not straightforward but may be related to sex hormones.35 Also, a faster increase in blood pressure in women may be seen at older ages, owing to the increase in adiposity, and the change in sex hormones associated with the menopause transition.36 ,37
Explanations for the associations between childhood SEP and adult adiposity and blood pressure is likely to include both social and biological pathways, as childhood SEP is strongly related both to educational level and to childhood factors such as early growth.3 ,21 ,38 ,39 The underlying mechanisms for the observed larger childhood SEP differences in adiposity among women compared with men are largely unknown, but one possible explanation is that childhood SEP is a stronger predictor of healthier exercise habits in women than in men.40 Also, the growth of girls has been found to be more influenced by childhood SEP, with girls being more susceptible to environmental influences.41 ,42 In addition, gender differences could be a result of childhood SEP affecting factors unique to women, such as those associated with reproduction, which have been associated with CVD risk.43 ,44 Also, there may be a stronger social pressure against obesity in females compared with males, and especially in higher SEP females.20 Even in youth, this stigma might be socially patterned, particularly in females.
The faster midlife blood pressure increase in men originating from low childhood SEP could be due to adult body build,3 but childhood SEP differences in male adiposity did not increase with age in our study, thus making this an unlikely explanation. Nevertheless, BMI is still higher among those with lower childhood SEP in men at all ages, so there may be a long-term effect on blood pressure.
Given that adiposity is a strong predictor of blood pressure, there is an apparent paradox of widening childhood SEP inequalities in blood pressure and stable inequalities in adiposity in men, and the reverse in women. It is possible that this may be due to a delayed effect of adiposity on blood pressure, at least in women. Also, recent increase in BMI has been shown to be more strongly related with blood pressure at age 53 years in men than in women in NSHD.45
The advantages of this study are that adiposity and blood pressure were measured three times in midlife, thus allowing us to examine changes in the effects of SEP with age, and that the prospectively collected measures of SEP reduced recall bias. We acknowledge that restriction of childhood SEP to a single measure may not capture the entire spectrum of childhood circumstances, but we chose to use only one measure to reduce issues with sample size and clarify the presentation of results. The sample is reasonably representative of the native born British population; comparisons with census data of the sample at 36 years showed that the NSHD was still representative of the national population in terms of childhood SEP.46 The complete study sample generally did not differ from those excluded, owing to missing values on mediators, and it is unlikely that these small observed differences have a large impact on our main results. As this cohort, born in 1946, experienced a different childhood environment from that in more recent cohorts, a limitation may be that the associations are not generalisable to later-born cohorts. However, a recent review concluded that the adult health effects of poor childhood SEP persist in later birth cohorts, despite less experience of deprivation.2
When analysing repeated measures, the use of multilevel models adjusts for the correlation within individuals, and by using both random intercept and slope, the model fit improved. Another advantage of mixed models is that individuals with a missing outcome at one or two of the three waves are included. Those dropping out at 53 years had a significantly worse adiposity and blood pressure profile at 36 and 43 years of age; those dropping out at age 43 were more similar than those in the study regarding outcome measures at age 36 (results not shown). However, it is argued that mixed models are quite robust to informative missing (ie, missing is dependent on earlier observations, eg, BMI at age 36 is predictive for missing at 53), and preferable to ANOVA, for example.47
A strength of our study was the ability to adjust blood pressure outcomes for antihypertensive medication (13% of study members at 36, 43 or 53 years of age). Sensitivity analyses showed lower childhood SEP effects on BP (results not shown), suggesting that failing to adjust for medication will dilute the childhood SEP effect.
Conclusions
These findings suggest gender and age differences in the effects of childhood SEP on adult adiposity and blood pressure in a British postwar birth cohort. These associations with childhood SEP were largely independent of adult SEP and education, and policies aiming at reducing social inequalities need to start early in life and take account of gender differences.
What is already known on this subject
Childhood socio-economic position (SEP) is related to adult cardiovascular disease (CVD) and adult CVD risk factors such as blood pressure and adiposity.
The strength of these relationships between childhood SEP and blood pressure and adiposity is inconsistent across studies and gender.
It remains unclear if the effects of childhood SEP change across adult life, and whether similar patterns of association are observed for men and women.
What this study adds
This is one of only a few prospective studies to compare the associations of childhood SEP and gender with CVD risk factors at multiple points in adulthood.
Between 36 and 53 years of age, the adverse effect of lower childhood SEP on adiposity increased in women and remained stable in men. The opposite was seen for systolic blood pressure, where inequalities increased in men.
Educational attainment mediated some but not all of the effects of childhood SEP on adiposity and systolic blood pressure and their rate of change; adult social class was a less important mediator.
References
Footnotes
Funding The manuscript is funded by MRC Unit for Lifelong Health and Ageing in UK and supported in part by the Intramural Research Program, National Institute on Aging, NIH in USA, and the Research Council of Norway.
Competing interests None.
Ethics approval Ethics approval was provided by the Multicentre Research Ethics Committee (MREC) approval.
Provenance and peer review Not commissioned; externally peer reviewed.