Article Text

Abstract
Background Socioeconomic differentials in adult height are frequently observed, but the age at which these inequalities emerge and the patterns they follow through childhood are unknown.
Subjects and Methods Using data from the Avon Longitudinal Study of Parents and Children (ALSPAC), height trajectories from birth to 10 years (N=12366) were modelled. Individual trajectories were estimated using mixed-effects models. Differences in trajectories by socioeconomic position (SEP) were investigated.
Results There was a clear gradient in birth length across categories of maternal education; average birth length in boys was 0.41 cm lower in the lowest maternal education category compared with the highest, which is 0.9% of the average birth length for the highest SEP category (equivalent results for girls 0.65 cm, 1.3%). Socioeconomic differences in childhood growth were small, and only resulted in minimal widening of the height inequality with increasing age. By the age of 10 years, the mean difference between children in the lowest and highest maternal education categories was 1.4 cm for boys and 1.7 cm for girls; similar proportionate differences to those seen at birth (1.0% for boys and 1.2% for girls). Patterns were the same when father's education or household occupational social class were used to measure SEP.
Conclusions The socioeconomic differential in height during childhood in this cohort of children born in the UK in the 1990s arises largely through inequalities in birth length, with small increases in the inequality from differences in growth in later childhood.
- ALSPAC
- growth
- growth in infancy
- height
- inequalities SI
- inequality
- socioeconomic
This is an open-access article distributed under the terms of the Creative Commons Attribution Non-commercial License, which permits use, distribution, and reproduction in any medium, provided the original work is properly cited, the use is non commercial and is otherwise in compliance with the license. See: http://creativecommons.org/licenses/by-nc/2.0/ and http://creativecommons.org/licenses/by-nc/2.0/legalcode.
Statistics from Altmetric.com
Socioeconomic inequalities in height are consistently observed within and across many different settings, with disadvantaged groups tending to be shorter in adulthood.1–3 Although height is strongly heritable,4 the degree to which an individual reaches their genetically determined height potential depends on the extent to which they encounter environmental ‘insults’ such as poor nutrition or ill health.5 Achieved adult height is therefore a marker of early life conditions as well as genetic potential. For this reason, height and secular trends in height, has been used by economic historians, development economists, biological and health researchers and others as an indicator of early living standards6–8 Furthermore, shorter adult height is associated with an increased risk of various adverse health outcomes in adulthood, particularly cardiovascular disease,9–11 cardiorespiratory disease10–12 and type II diabetes.13 It is possible that much of the observed association between height and health outcomes is driven by the effects of adverse early life socioeconomic circumstances on shorter attained height, although associations often remain after adjustment for childhood deprivation.14
In most European countries, height has been increasing on average by 10–30 mm per decade during the 20th century,15 with this increase being attributed to improvements in health, environment and other socioeconomic conditions in childhood. As average height has increased in developed countries, socioeconomic differentials in height have decreased in some studies,16 but remained the same in others.1
Shorter height in lower socioeconomic groups is likely to be due to a multitude of factors that affect both birth length and growth in infancy and childhood. The age at which socioeconomic differentials appear, and the patterns such differentials follow through childhood, however, are unclear. We explore this by modelling individual growth trajectories from birth to 10 years in a cohort of children born in the UK in the 1990s, and examining the socioeconomic patterning of these trajectories.
Methods
Study population and ethics
The Avon Longitudinal Study of Parents and Children (ALSPAC) is a prospective cohort study investigating the health and development of children in the south-west of England,17 the full details of which, including details of representativeness of the sample, are available on the study website (http://www.bristol.ac.uk/alspac). Pregnant women resident in one of three Bristol-based health districts with an expected date of delivery between 1 April 1991 and 31 December 1992 were invited to take part in the study. Of these women, 14 541 were recruited. From these pregnancies, there were 14 062 live born children, 13 988 of whom were alive at 1 year. Follow-up has included parent and child-completed questionnaires, links to routine data and clinic attendance. A random subsample of children from the last 6 months of recruitment (‘Children in Focus’ group—approximately 10% of the total cohort) were invited to clinics between the ages of 4 months and 5 years; all children were invited to clinics from the age of 7 years onwards. Ethics approval for the study was obtained from the ALSPAC Law and Ethics Committee and the Local Research Ethics Committees.
Measurements
A questionnaire at 32 weeks' gestation asked mothers to report their educational attainment, which was categorised as below O-level (Ordinary Level; exams taken in different subjects usually at age 15–16 years at the completion of legally required school attendance, equivalent to the present UK General Certificate of Secondary Education), O-level only, A-level (Advanced Level; exams taken in different subjects usually at age 18 years), or university degree or above. We also examined socioeconomic differentials with head of household occupational social class and father's education (categorised as above), but since results and conclusions were the same as those presented here for mother's education these are not presented or discussed further.
Length/height data for the children are available from several sources. Birth length (crown–heel) was measured for almost the whole cohort by ALSPAC staff who visited newborns soon after birth (median 1 day, range 1–14 days), using a Harpenden neonatometer (Holtain Ltd,Crosswell, Crymych, UK). From birth to 5 years, measurements are also available for the majority of the cohort from health visitor records, which form part of standard childcare in the UK. In this cohort we had up to four measurements taken on average at 2, 10, 21 and 48 months of age, which we have demonstrated in previous work to have good accuracy.18 For a random 10% of the cohort, we also have measurements from Children in Focus clinics, held between the ages of 4 months and 5 years. At these clinics, crown–heel length for children aged 4–25 months was measured using a Harpenden neonatometer (Holtain Ltd), and from 25 months onwards standing height was measured using a Leicester height measure (Seca, Hamburg, Germany). From age 7 years upwards, all children were invited to annual clinics, at which standing height was measured (without shoes) to the last complete millimetre using the Harpenden stadiometer (Holtain Ltd). Across all ages, parent-reported child heights are also available from questionnaires.
Statistical analysis
Implausible measurements (>4 SD from the mean for gender and age-specific category) were re-coded as missing (101 measurements from 96 individuals, approximately 0.1% of all available measurements). All other available measures were used in analyses. To account for the likely reduced accuracy of parent-reported measurements,19 a binary indicator of measurement source (research clinic or health records versus parent reports from questionnaires) was included in all models.
We estimated individual growth trajectories using a linear spline mixed-effects model (two levels measurement occasion and individual), fitted using the statistical package MLwiN version 2.10 (http://www.cmm.bristol.ac.uk/MLwiN/index.shtml). Such models allow for the change in scale and variance of height over time and use all available data from all eligible children under a missing at random assumption. They also allow for individual variation in growth trajectories, as random effects allow each individual to have different intercepts and slopes. Models for growth between birth and 10 years were constructed separately for boys and girls, for all individuals with data on maternal education and at least two length/height measurements (N=12 366). The methodology identified spline points that defined periods of approximately linear growth based on the data. The modelling approach confirmed that there were three spline points (four periods of linear growth) between birth and 10 years: 0–3 months, 3–10 months, 10–29 months, 29–120 months for boys, and 0–2 months, 2–11 months, 11–32 months and 32–120 months for girls. Five coefficients thus describe average growth in the cohort—birth length (ie, the baseline measurement) and mean linear growth for the four periods described above. Full details of the statistical methodology are presented in the supplementary material, available online only.
Socioeconomic inequality in the growth trajectories was estimated by fitting interaction terms in the random effects model between maternal education and the constant term (representing birth length) and each of the slopes for the growth periods. The parameters for these interaction terms demonstrate whether there are differences in birth length or growth in each period between socioeconomic groups (ie, the associated p values test the null hypothesis of no difference in birth length or growth in each period by socioeconomic group). The only other covariate included in models was a binary indicator of source of height measurement (questionnaire vs measured by ALSPAC clinic staff or health visitors).
Results
Data and population
Data on growth and maternal education are available for 6380 boys and 5986 girls; 88% of the ALSPAC cohort. Approximately 30% of children included had mothers in the lowest education category, and approximately 13% were in the highest category (table 1). There was a median of seven measurements per child (interquartile range five to 10 measurements), with most children having at least one measurement in each growth period (table 2). The number of measurements was greater in higher socioeconomic groups, for example the median was six measures in the lowest maternal education category and eight in the highest maternal education category. At least two-thirds of height measurements after birth were measured in ALSPAC clinics or by health visitors (table 2), and are therefore likely to have good accuracy. In the multilevel models, the indicator for questionnaire measurements tended to have a negative coefficient, that is parents tended to overreport their child's height. Only a small percentage of ALSPAC participants are of non-white ethnicity (5.5%); models excluding non-white children did not differ.
Characteristics of participants included in this study
Summary of measurements included in the growth model for 12 366 individuals included in models
Model fit
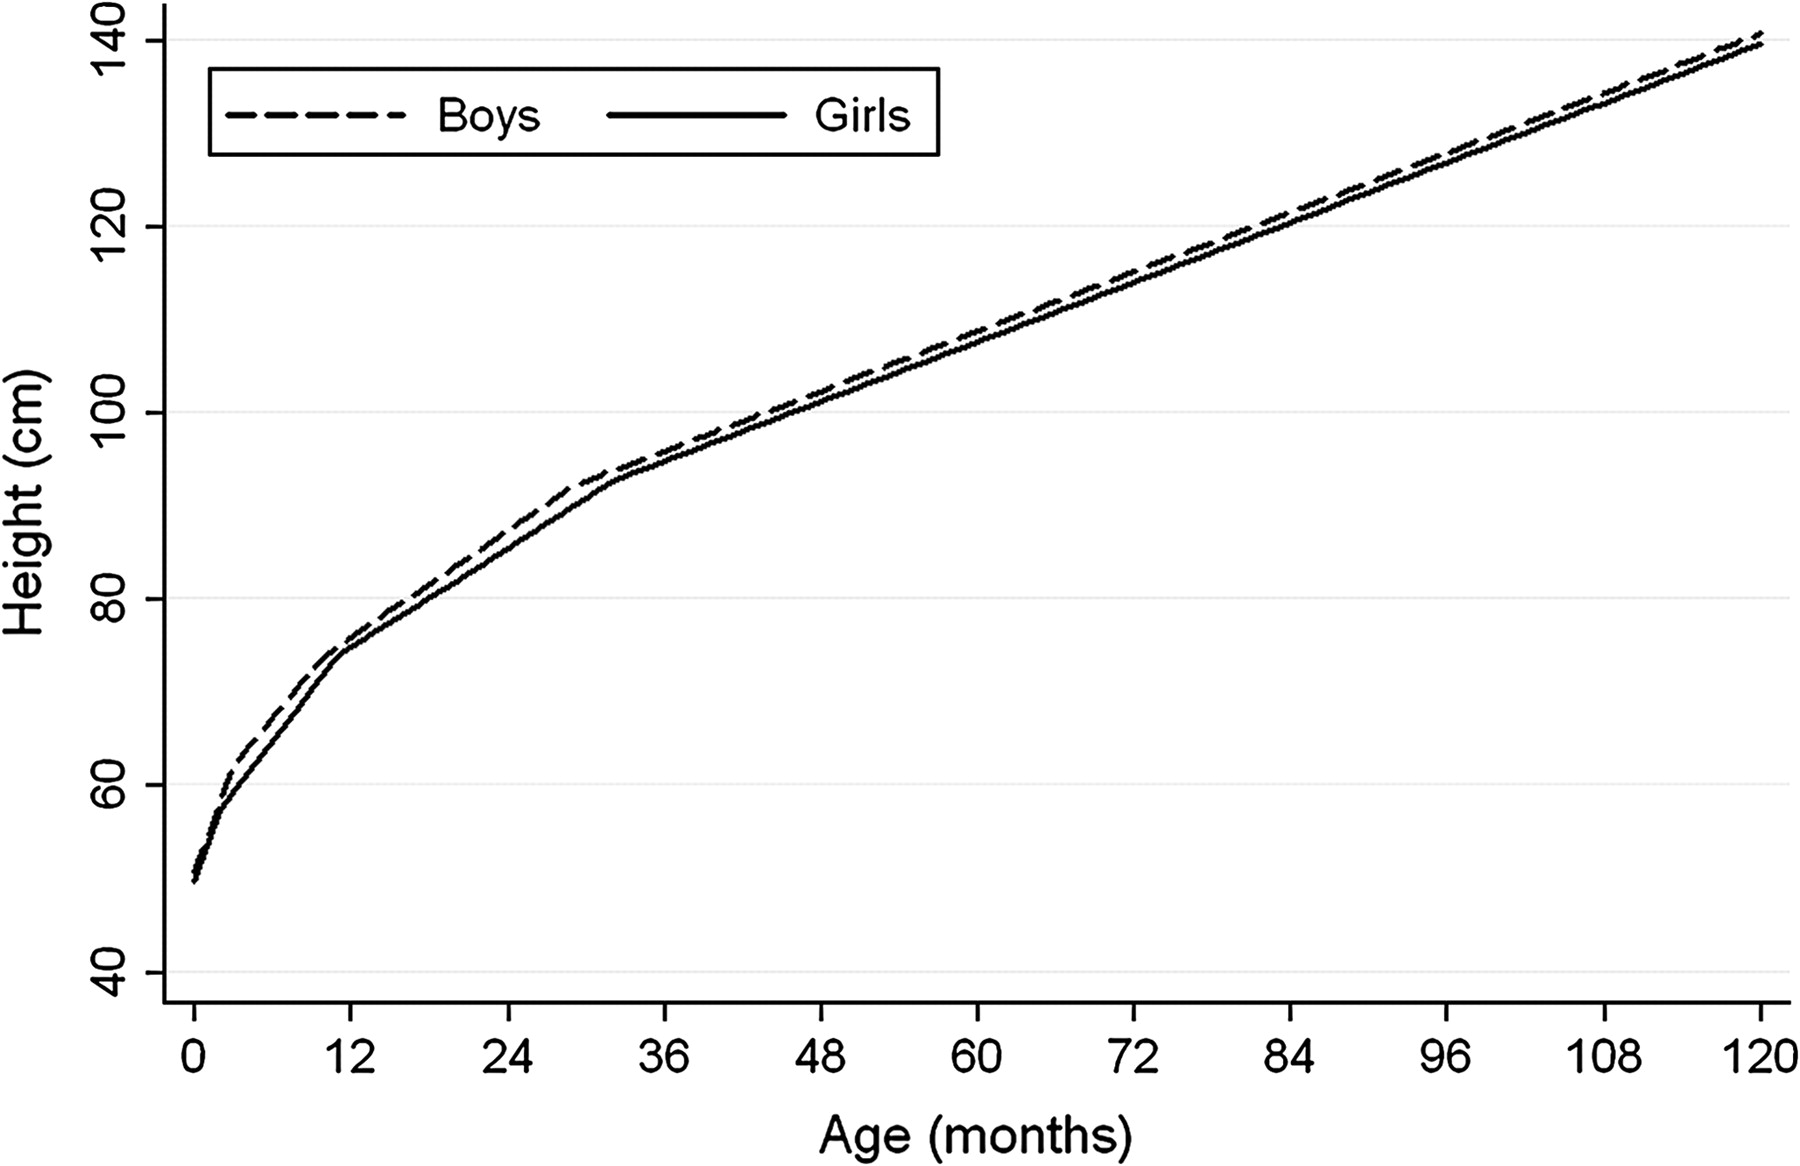
Figure 1 shows the average predicted growth trajectories across childhood from our models; Differences between actual and predicted measurements are shown in supplementary table 1 (available online only); these were very small in each period indicating good model fit. Autocorrelation was −0.14 for boys and −0.15 for girls. These values indicate weak levels of autocorrelation and given the goodness of fit of our model as demonstrated in supplementary table 1 (available online only), together with computational difficulties in incorporating autocorrelation into growth models in MLwiN, we did not account for autocorrelation in further analyses.

Average height (cm) trajectories for boys and girls predicted by the multilevel models.
Socioeconomic differentials in birth length and growth trajectories
There is a clear gradient in birth length across categories of maternal education for both boys and girls, with babies born to mothers in the lowest education categories being shortest and each sequential increase in category of maternal education being associated with an increase in average birth length (p values for interactions between birth length and maternal education 0.0003 for boys, <0.0001 for girls). For boys there is a mean difference in birth length of 0.41 cm between the lowest and highest maternal education categories; representing 0.9% of the average birth length of a son of a degree-educated mother. For girls the mean difference between the lowest and highest maternal education categories is 0.65 cm, representing 1.3% of the average birth length of a daughter of a degree-educated mother (table 3).
Predicted lengths/heights across categories of maternal education
There is statistical evidence of socioeconomic differences in growth for some, but not all, growth periods (table 4). For growth in the first few months of life, there is no statistical evidence of a difference between maternal education categories, although there is some indication that growth rates tend to be higher in the lower socioeconomic groups. For growth later in childhood growth rates tend to be higher in the higher maternal education categories, with most growth periods demonstrating a linear pattern across all four categories of maternal education. The differences in growth rates across maternal education categories are small, but result in a 1 cm widening of the absolute difference between the highest and lowest maternal education categories, while the relative socioeconomic differential in height remains similar from birth to 10 years (tables 3 and 4). Figures 2 and 3 show the curves for the highest and lowest categories of maternal education for boys and girls, respectively. These indicate the small absolute difference in height between these extreme groups with the more detailed analysis across all categories shown in tables 3 and 4.
Mean growth rates across categories of maternal education

Average predicted growth trajectories for boys in the lowest and highest maternal education categories.

Average predicted growth trajectories for girls in the lowest and highest maternal education categories.
By the age of 10 years, the mean difference between children in the lowest and highest maternal education categories is 1.4 cm (1.0% of average height for the son of degree-educated mothers) for boys and 1.7 cm (1.2% of average height for the daughter of degree-educated mothers) for girls. This means that at 10 years old, despite boys being on average taller than girls, girls in the highest maternal education category are on average 0.8 cm taller than boys in the lowest maternal education category (table 3).
Discussion
Main findings and interpretations
Even in a highly developed country such as the UK, socioeconomic differentials in infant and child height persist, with linear gradients in birth length and growth rates across four categories of maternal education. We have shown, in a cohort of children born in the UK in the early 1990s, that most of the socioeconomic inequality in height during childhood is driven by differences in birth length, with only small additional widening of height inequality due to differences in growth rates after infancy. As the scale of height increases over childhood, there is an increase in absolute inequality in height between birth and 10 years. For a scaled variable such as height, however, a more meaningful way of examining patterns of inequality over childhood is relative inequality. These data demonstrate little meaningful increase in the relative inequality in height after birth, indicating that height inequality is primarily present at birth and does not widen considerably through childhood growth.
There is considerable evidence from cross-sectional studies demonstrating the existence of height inequalities at young ages. For example, social gradients in height were demonstrated in British 2-year-olds from the Carnegie (Boyd–Orr) survey, a cross-sectional survey conducted between 1937 and 1939,20 in British 7-year-olds in the 1960s,21 and in 5–11-year-olds in England and Scotland in 1972.22 One study of 6–16-year-olds from the USA, and a further study of 10–16-year-olds from Sweden, however, found no evidence of height inequalities.23 24 Few studies have investigated the patterns of height inequality across childhood using longitudinal data. One study compared two measurements of 7569 children aged 5–10 years from England and Scotland. The children were measured in 1972 and again in 1973; the study found no change in the socioeconomic differential in height, leading the authors to conclude that height inequalities are established before the age of 5 years.25
Our findings that differences in height are due primarily to birth length rather than childhood growth may well differ in other settings, particularly low and middle-income countries and previous generations in high-income countries, where there may be important socioeconomic patterning of infant growth due to illness and nutrition.26
As, in this population at least, the socioeconomic differential in height is present at birth and does not widen much across childhood, socioeconomic inequalities in height reflect socioeconomic conditions experienced before birth. The underlying reasons for the observed socioeconomic differential in birth length are likely to be multifactorial, and may include maternal behaviours such as smoking during pregnancy, which has been shown in the ALSPAC cohort to have a dose–response relationship with offspring height at age 7.5 years.27 Furthermore, fetal and maternal genetics might result in socioeconomic differentials in birth length, because height is highly heritable28 and there is evidence for assortative mating by height29 and by socioeconomic position (SEP).30 Finally, epigenetic effects (different expression of genetic variation determined by environmental factors related to SEP) could explain our findings. Further studies are required to determine the underlying mechanisms for the associations that we have found.
There has been considerable interest in intergenerational influences on patterns of height inequality. For example, one study compared height inequality between members of the 1958 Birth Cohort and their offspring. Inequalities in height narrowed between the two generations from 2 to 3 cm at the age of 7 years in cohort members to less than 1 cm among their children (born approximately 26 years later).16 It would be interesting in further analyses to explore the role of grandparental education in the socioeconomic patterning of the growth trajectories in ALSPAC, and as the data become available to explore how socioeconomic patterning of height trajectories differs between the ALSPAC participants and their parents and offspring.
The absolute difference we observe in the ALSPAC participants is relatively small, and is smaller than the differences observed in previous generations in the UK, including the 1958 Birth Cohort.16 It is possible, therefore, that socioeconomic differentials in height will decrease further over time as living conditions improve, although a review utilising data from 10 European countries showed persisting height inequalities, with no narrowing of the height differential between educational groups in younger cohorts compared with previous generations.1 Height differences, probably at least partly through their associations with SEP, have been shown to result in disparities in many other aspects of life, with taller people experiencing, for example, increased job success and reporting greater life satisfaction.31 32
Strengths and limitations
The main strengths of this study are its uniqueness in examining longitudinal height trajectories from birth to age 10 years in a large sample size with a large number of repeat measurements. Our modelling approach has allowed us to examine trajectories of height across childhood, taking account of the different timings and numbers of measurements between children. By using a linear spline model, we have been able to simplify the trajectories, while retaining good fit between actual and predicted values.
We have not included the timing of puberty in these analyses. However, we have restricted our analyses to growth up to 10 years of age. At this age very few children will have gone through puberty. Among those with relevant data (information provided by parents using Tanner's puberty questions) the vast majority of the cohort were prepubertal at age 10 years (82% at Tanner stages 1 or 2; 96% at stages 1–3). When further data are available, it will be interesting to see whether and how height inequalities alter as the whole cohort passes through puberty.
Drop-out from any research study is likely to be socially patterned. We were able to include the vast majority of participants in our study and those included did not differ with respect to SEP from those excluded due to missing data. However, in our data we have fewer measurements of height for lower SEP children. When analyses were restricted to only participants who had at least nine measurements the findings were essentially identical to those presented here. Missing data are therefore unlikely to have caused bias.
Our study has focused on height, but previous research has suggested that leg length is the component of total height that is most socially patterned.20 We do not have serial measurements of leg length in this study and are unaware of any other studies that have such data.
To conclude, our results suggest that socioeconomic differentials in length/height in contemporary high-income populations are already present at birth, suggesting that genetic, epigenetic or intrauterine characteristics influenced by maternal behaviours may be important. There are no socioeconomic differences in growth in early infancy, but slightly faster growth in later childhood results in minimal widening of the height inequality. Further research would be valuable to explore the mechanisms that underlie the differentials we have identified.
What is already known on this subject
Despite improvements in living standards and increasing secular trends in height, socioeconomic inequalities in height persist, with individuals from more deprived backgrounds tending to be shorter. What is not known is at what age such socioeconomic inequalities in height emerge, and whether and how they change across childhood.
What this study adds
Our results suggest that socioeconomic differentials in length/height in contemporary high-income populations are present at birth, with some small widening of inequality in later childhood, suggesting that they are driven by genetic, epigenetic or maternal intrauterine characteristics.
Acknowledgments
The authors are extremely grateful to all the families who took part in this study, the midwives for their help in recruiting them and the whole ALSPAC team, which includes interviewers, computer and laboratory technicians, clerical workers, research scientists, volunteers, managers, receptionists and nurses. They also thank Paul Clarke (Centre for Market and Public Organization, University of Bristol) and Fiona Steele (Centre for Multilevel Modelling, University of Bristol) for statistical advice.
References
Supplementary materials
Web Only Data jech.2010.113068
Files in this Data Supplement:
Footnotes
Funding This work was supported by a grant from the UK Economic and Social Research Council (RES-060-23-0011). This grant provides the salary for LDH. BG is funded by a UK Medical Research Council fellowship in health of the public. DG is a National Institute of Health research senior investigator. The UK Medical Research Council; the Wellcome Trust and the University of Bristol provide core funding support for the Avon Longitudinal Study of Parents and Children. The UK Medical Research Council and the University of Bristol provide core funding for the MRC Centre of Causal Analyses in Translational Epidemiology. The views expressed in this paper are those of the authors and not necessarily those of any funding body or others whose support is acknowledged. The funders had no role in study design, data collection and analysis, decision to publish, or preparation of the manuscript.
Competing interests None.
Ethics approval Ethics approval for the study was obtained from the ALSPAC Law and Ethics Committee and the Local Research Ethics Committees.
Provenance and peer review Not commissioned; externally peer reviewed.