Article Text

Abstract
Objectives The objectives of this study were to explore the extent of the social gradient for deaths due to assault and its impact on overall inequalities in mortality and to investigate the contribution to assault mortality of knives and other sharp weapons.
Design An analysis of death records and contemporaneous population estimates was conducted.
Setting The authors investigated the social patterning of homicide in Scotland.
Participants This study included deaths between 1980 and 2005 due to assault.
Main measurements Death rates were standardised to the European standard population. Time trends were analysed and inequalities were assessed, using rate ratios and the slope index of inequality, along axes defined by individual occupational socioeconomic status and area deprivation.
Results An increase in mortality due to assault was most pronounced at ages 15–44 and was steeper among assaults involving knives. The death rate among men in routine occupations aged 20–59 was nearly 12 times that of those in higher managerial and professional occupations. Men under 65 living in the most deprived quintile of areas had a death rate due to assault 31.9 times (95% CI 13.1 to 77.9) that of those living in the least deprived quintile; for women, this ratio was 35.0 (4.8 to 256.2). Despite comprising just 3.2% of all male deaths between 15 and 44 years, assault accounted for 6.4% of the inequalities in mortality.
Conclusions Inequalities in mortality due to assault in Scotland exceed those in other countries and are greater than for other causes of death in Scotland. Reducing mortality and inequalities depends on addressing the problems of deprivation as well as targeting known contributors, such as alcohol use, the carrying of knives and gang culture.
- Deprivation
- homicide
- inequalities SI
- mortality SI
- socioeconomic
This is an open-access article distributed under the terms of the Creative Commons Attribution Non-commercial License, which permits use, distribution, and reproduction in any medium, provided the original work is properly cited, the use is non commercial and is otherwise in compliance with the license. See: http://creativecommons.org/licenses/by-nc/2.0/ and http://creativecommons.org/licenses/by-nc/2.0/legalcode.
Statistics from Altmetric.com
The homicide rate in Scotland has been increasing since 1980.1 This increase has accompanied rising death rates due to suicide (among men), chronic liver disease and mental and behavioural disorders attributed to the use of drugs and alcohol.2 3 The changes in mortality from these causes have been most noticeable among younger adults, particularly young men, for whom the effect has been so strong that all-cause death rates at these ages have begun to rise.4
Much of the previous research on the social patterning of homicide has been conducted in the USA; this has shown the victims of homicide to be more likely to be drawn from certain social groups: generally, homicide rates are higher among black,5–9 low income,5 9 poorly educated,5 6 9 unemployed5 6 9 and manual workers.8 10 Research from Finland has also noted elevated rates among unemployed and manual workers,11 and in Sweden there was an association with early life socioeconomic position.12 Area characteristics with noted associations with homicide rates include degree of urbanisation (USA),7 income inequality (USA and internationally),7 9 10 13 per capita income (USA)6 and deprivation or poverty (USA, The Netherlands and Great Britain).6 9 14 15
The effect of homicide on social inequalities in mortality may be disproportionate. The (area-based) socioeconomic gradient for homicide was shown to be steeper than for many other causes of death in The Hague and, although contributing just 1.3% and 0.7% of all male and female deaths under 65, contributed 6.4% and 3.9% of the excess mortality in the quartile of regions with the highest deprivation scores compared with the quartile with the lowest scores.14 In New York City, inequalities patterned by neighbourhood poverty (as measured by the relative index of inequality), for men and women combined, were 1.7 for all causes and 9.0 for homicide.16 Neither study reported the significance of these results. In Sweden, men with manual social class in early life had a hazard ratio of death from homicide of 2.11 compared with those with non-manual social class; for all-cause mortality, the ratio was 1.31. For women, the ratios were 1.40 and 1.18, respectively.12 This difference was significant for men but not for women. In Estonia, the rate ratio for homicide mortality comparing the lowest educated group to those with university education (2.21) was about the same as that for all-cause mortality (2.38) among men, while the homicide rate ratio for women (5.46) was higher than that for all causes (2.23), although the difference was not significant.17
Earlier research has shown the increasing importance of homicides involving the use of knives or other sharp weapons among all homicides in Scotland.1 While the male homicide rate increased by 83% between 1982 and 2002, the rate involving knives or similar increased by 164% and more than trebled for those aged 15–34. Between 1983 and 1998, inequalities in homicide in Great Britain increased as homicide rates decreased in the more affluent areas while increasing in the more deprived areas.15 Over this period, the rate ratio in the poorest decile compared with the richest increased from 4.50 to 5.68. Murders involving a knife or a broken glass/bottle showed a social gradient,15 such a method constituting 52% of all homicide deaths in the poorest decile but only about 35% in the least poor decile. Given the high proportion of deprived areas that lie within Scotland, and the West of Scotland in particular, and the high rate of homicides involving knives in Scotland (47% in Scotland between 1981 and 20031 compared with 38% in England and Wales between 1993 and 199718), it is possible that the social gradient reported reflects in part this high Scottish rate. The importance of the use of knife in assaults and homicides has led to policy changes or proposals targeting knives, including the licensing of the sale of non-domestic knives19 and a ban on the sale of all long pointed kitchen knives.20
It is against this background that we investigate the social patterning of homicide in Scotland between 1980 and 2005, both by individual socioeconomic status and by area-based measures of deprivation. We explored the extent to which inequalities in homicide have increased, the extent to which this may be attributable to homicide involving the use of knives or other sharp weapons and the contribution of homicide to all-cause mortality and to inequalities in mortality.
Methods
Data
The analyses presented in this paper are based on death records for Scotland for the years 1980–1982, 1990–1992 and 2000–2005, obtained from the General Register Office for Scotland (GROS). Information on the death certificates includes the age and sex of the deceased as well as the cause of death and a measure of individual socioeconomic status. They also contain the postcode of residence of the deceased, enabling linkage to area-based deprivation scores. The estimation of rates for population groups defined by area of residence requires denominator populations in addition to the events (deaths); for this reason, small area population estimates for these years by age and sex were also obtained from GROS.
Homicides were defined as deaths where the underlying cause was homicide and injury purposely inflicted by other persons (ICD9 E960-E969) or assault or sequelae of assault (ICD10 X85-Y09 and Y87.1). We conducted separate analyses for deaths where the cause was assault by a cutting or piercing instrument (ICD9 E966) or assault by sharp object (ICD10 X99).
The measure of individual socioeconomic status that we have used is the National Statistics Socioeconomic Classification (NS-SEC).21 NS-SEC is based on occupation and employment status but has rules to provide coverage of the whole adult population. It is constructed to measure employment relations and conditions of employment. There are several versions of the classification, and the one used here has eight classes (detailed in table 1, together with those who could not be classified).22 The proportion of the population assigned an NS-SEC from age 60 is low and so becomes unreliable to use. In addition, the completeness of NS-SEC for ages 16–19 years is also low because of delayed entry into the labour market.2 For these reasons, analyses using NS-SEC focused on the age group 20–59. Earlier results have cast doubt on the reliability of NS-SEC coding for the analysis of female mortality,2 and we therefore restricted the analysis to men. Population estimates by NS-SEC were only available from the 2001 population census (earlier censuses used the alternative social class based on occupation); we used these estimates for men aged 20–59 to standardise the male death rate by NS-SEC.
Standardised death rates per 1 000 000 population due to assault, assault involving sharp weapons and other assaults, by NS-SEC category (men, Scotland, 2000–2002)
We used two different measures of area deprivation. The Carstairs score is a census-based deprivation score derived from levels of male unemployment, social class of the head of household, overcrowding and (lack of) car ownership, and has been calculated by adding together the standardised values of the variables following the 1981, 1991 and 2001 censuses.23–25 The continuous score was used to divide areas into (population-weighted) quintiles. The income domain of the Scottish Index of Multiple Deprivation (SIMD) is based on the proportion of the population living in households in receipt of mean-tested benefits and was calculated based on the numbers claiming different allowances or benefits in 2001 and 2004.26 27 Areas were ranked, and these ranks were used to divide areas into (population-weighted) quintiles.
In 2001, the population of Scotland was 5 062 011. The Carstairs score is calculated for postcode sectors; in 2001, there were 1010 postcode sectors in Scotland (including part postcode sectors when their boundaries crossed local council areas) with a mean population of 5012 (range, 51–20 512). The SIMD uses a geographical area with lower mean population size and less variability in population size, the data zone; in 2001, there were 6505 data zones in Scotland with a mean population of 778 (range, 476–2813). To match populations to these deprivation measures, we used census populations for 1981, 1991 and 2001 by age, sex and postcode sector; census populations for 2001 by age, sex and data zone; and GROS population estimates for 2004 by age, sex and data zone. We confined the area-based analyses around the 1991 census to 1991–1992 because of difficulties matching addresses on death records and the census following changes to some postcode sectors in 1990.
Statistical methods
All death rates and 95% confidence intervals (CIs) were calculated by direct standardisation to the European standard population for men and women by age group for the selected years.28 Standardised rates were also calculated for population groups defined by NS-SEC group or quintile of area deprivation. All rates reported were per million population per year. P values indicating the significance of trends over time or across deprivation quintiles were calculated using Poisson regression. Tests for trends were not appropriate for the analysis by NS-SEC group since this classification is not hierarchical or ordered21; therefore, tests of the differences between groups were conducted instead. Rate ratios and 95% CIs were calculated to show the extent of inequality at each time by making comparisons between the populations living in each of the most and least deprived quintiles and the population living in the middle three quintiles.29 P values indicating the significance of differences in the trends over time (from 1981 to 2001) in deaths in the most or least deprived quintile (assessed using the Carstairs score), relative to the population in the middle three quintiles, were calculated using Poisson regression. Finally, we calculated the slope index of inequality across quintiles of the income domain of the SIMD by age and sex for 2000–2002, for all causes and for homicides, and used this to assess the proportion of the inequality in mortality that was attributable to homicide.30 We chose to examine the relative contribution of homicides to inequalities in all-cause mortality for the period 2000–2002 because this was the most recent period for which we were able to use populations derived from the census rather than from estimates.
Results
Based on the analysis of 1109 deaths due to assault in the 12 years covered, table 2 presents death rates by age and sex, with deaths due to assault further broken down into those due to the use of knives and other sharp objects and other assaults. Also shown are the total number of deaths by cause and sex in each 3-year period and p values indicating the significance of trends over time. Death rates under the age of 1 remained high, supporting an analysis of infanticide that is separate from other forms of homicide.11 Male rates tended to be higher between the ages of 15 and 44 than at other ages, and at these ages, the rate more than doubled between 1980–1982 and 2003–2005. Most of these deaths and most of the increase can be seen to be attributable to assaults involving sharp objects; however, the increase in all age death rate associated with other assaults also showed a significant increase. Female death rates were much lower than male rates and were not dominated by sharp objects as male rates were. All age death rate showed a significant decrease over time due to decreases at older ages.
Male and female standardised death rates per 1 000 000 population due to assault, assault involving sharp weapons and other assaults, Scotland, 1980–1982, 1990–1992, 2000–2002 and 2003–2005
Table 1 shows death rates by age and NS-SEC for men in Scotland in 2000–2002. The table also shows the number and proportion of the population in each NS-SEC category. Steep social gradients are evident, with the rate among those in routine occupations (127 per 1 000 000 population) being nearly 12 times that of those in higher managerial and professional occupations (11). The gradient was steeper for those aged 20–39 than at ages 40–59 and was also steeper for assaults involving sharp objects. Table 1 highlights the fact that the 193 473 men in routine occupations form a particularly vulnerable group, with rates being more than double those for men in semiroutine occupations. Differences between the NS-SEC groups were significant for both age groups and for assaults involving sharp objects and other assaults. High rates are also evident for the 9% of men whose occupations could not be classified (particularly at ages 20–39), but the rather low rate for the 4% who had never worked or were long-term unemployed illustrates the extent of our concerns about the coding to NS-SEC differing between death certificates and the census. The information collected on death records in Scotland is not able to distinguish those who have never worked or are long-term unemployed with any accuracy; similar findings have been reported for England and Wales.31
Table 3 examines inequalities in male and female deaths according to area-based deprivation and how these have changed over time. The measures used are rate ratios comparing the rates in each of the most deprived quintile (quintile 5) and the least deprived quintile (quintile 1) with the rates in the middle three quintiles. Changes in the rate ratios for all assaults between 1980–1982 and 2000–2002, based on the Carstairs score for postcode sectors, showed that the relative experience of those living in the most deprived quintile little changed with male rates typically 3–4 times those in the middle three quintiles and female rates 2–2.5 times. In contrast, the rate ratio for men of all ages in the least deprived quintile fell from 0.86 in 1980–1982 to 0.28 in 2000–2002 (p=0.022). Relative to the middle three quintiles, the rate ratio in the most deprived quintile for assaults involving sharp objects decreased over time (p=0.035), although in 2000–2002, the rate ratio was still 3.38 (95% CI 2.27 to 5.03). No other trends were significant. When area deprivation was assessed for data zones using the SIMD income domain in 2000–2002, there was a notable tendency for inequalities to be wider than for postcode sectors assessed using the Carstairs score in the same period, with the rate ratios assessed using the SIMD for the most deprived areas mostly higher and those for the least deprived areas tending to be lower. This is likely to be a result of the smaller area employed by the SIMD with its consequent ability to identify pockets of deprivation set in (relatively) more affluent surroundings and the consequent homogeneity afforded by a classification based on data zones.
Age-specific death rate ratios due to assault, assault involving sharp weapons and other assaults, for most and least deprived quintiles relative to the middle three quintiles (men and women, Scotland, 1980–1982, 1991–1992 and 2000–2002 based on Carstairs scores; 2000–2002 and 2003–2005 based on SIMD income domain)
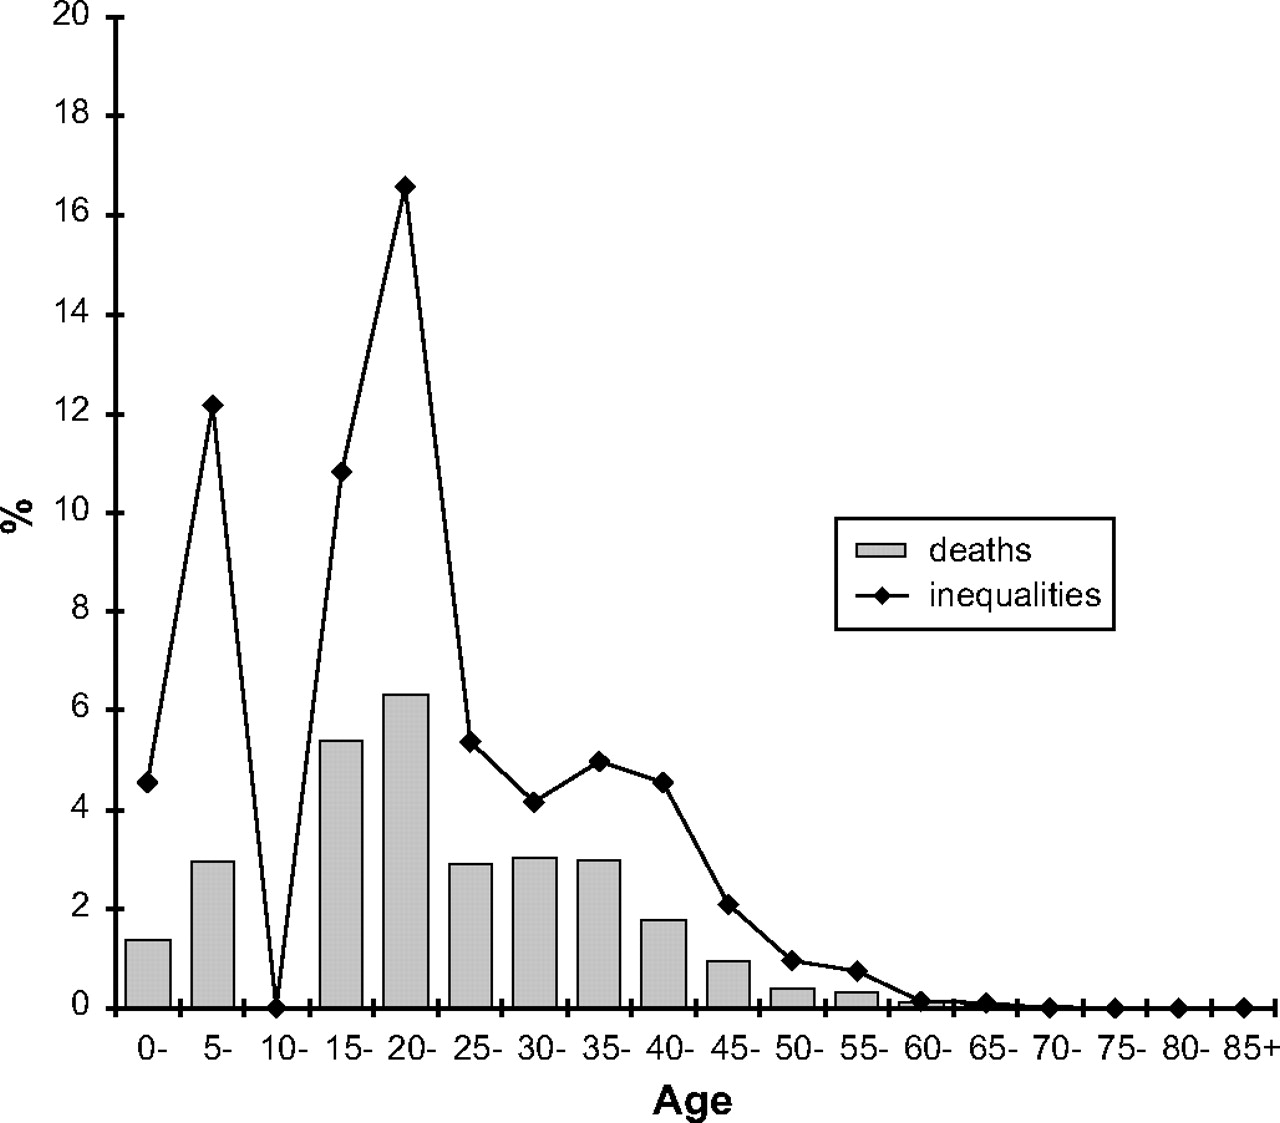
Figure 1 shows how deaths that are due to assault vary as a proportion of all deaths by age for men in 2000–2002. Although representing just 0.3% of male deaths at all ages, assault accounts for 1.0% of deaths under the age of 65 and 3.2% between the ages 15 and 44. Also shown in figure 1 is the percentage of inequalities in mortality at each age that is due to assault. The fact that the contribution to inequalities is greater than the proportion of deaths reflects the steeper social gradient that is seen for deaths due to assault than for other causes. Assault accounts for 1.1% of inequalities in male mortality at all ages, rising to 2.4% under 65 and 6.4% between the ages of 15 and 44.
Proportion of all male deaths that were due to assault (bars) and the proportion of inequalities in mortality due to assault (line), by age, Scotland 2000–2002.
Discussion
Death rates in Scotland due to assault are high; all age rates in table 2 of 32 and 8 per 1 000 000 men and women respectively in 2000–2002 compare very unfavourably with rates of 14 and 6 per 1 000 000 for high income countries in the European region in 2000.32 The steep social gradient is a notable feature of mortality due to assault in Scotland as in other countries. The extremely high death rate seen among men of working age in routine occupations (127 per 1 000 000) is comparable to the Scottish death rate for stroke among men of this age and higher than the death rate for colorectal cancer.2 Although it is not possible to make direct comparisons between tables 1 and 3, inequalities (as measured by the ratio) between the most and least deprived quintiles as measured by SIMD appear stronger than those between routine occupations and higher managerial and professional occupations. For all assaults in 2000–2002, the lowest rate ratio between the most and least deprived quintile by age group was that seen for all ages (RR=5.19/0.27=19.2); by contrast, the highest rate ratio between the extreme groups of NS-SEC was 13.5 (=150/11) for those aged 20–39. While it is possible that the results would differ if other individual and area socioeconomic factors were employed, we believe that this work suggests that contextual influences of the neighbourhood of residence might be more important than individual characteristics in determining the victims of assault. However, we have previously noted the mismatch between the coding of NS-SEC from death certificates and that from the census2 and, for this reason, are cautious about placing too much emphasis on the interpretation of the results by individual socioeconomic status. Furthermore, formal separation of the contextual and compositional effects can only be conducted in a multilevel framework.
Death rates due to assault in the most deprived areas have not deteriorated significantly over time relative to those in the middle three quintiles. The only significant increase in inequalities has been the widening of the gap between the least deprived areas and the rest of Scotland. However, the magnitude of the inequalities seen—patterned by the deprivation level of the area of residence—is extreme. Between 2000 and 2002, a man under 65 living in the most deprived quintile was 31.9 (95% CI 13.1 to 77.9) times more likely to die due to assault than one living in the most affluent quintile; for women, this ratio was 35.0 (4.8 to 256.2). The equivalent rate ratios for all-cause mortality were 3.5 (3.3 to 3.6) and 2.6 (2.5 to 2.8) for men and women, respectively. Not only do these inequalities for assault exceed those for other causes of death in Scotland, but also they far exceed the ratio reported for homicide in Great Britain15 (5.7 comparing the top and bottom deciles, 1996–2000) and that for emergency hospital admissions for assault in England33 (6.3 comparing the top and bottom quintiles in 2005–2006). The reasons for the different findings are unclear; the measures reported in these studies have some differences (eg, both refer to men and women combined and to all ages), but these could not account for the stark inequalities observed in Scotland. Earlier research has suggested that inequalities in all-cause mortality are wider in Scotland than in the rest of Great Britain; the Scottish excess mortality in 2001 ranged from 2% in the least deprived decile to 17% in the most.34 It is possible that the greater inequalities in mortality due to assault in Scotland reflect greater social inequalities and more acute deprivation. The prioritisation of the harm caused by violence in the Scottish Government's report of the ministerial task force on health inequalities35 is recognition that the small numbers of deaths have a marked impact on inequalities, particularly among young men.
Maxwell et al showed that while in a single year from April 2004 to March 2005, 4891 patients were admitted to hospital in England with an assault-related stabbing injury, there were only 139 deaths in 2004 due to assault from a sharp object.36 This figure of 35 victims requiring hospital treatment for every homicide fits in with an estimated range of 20–40 for youth violence internationally.37 The suggestion that there might be so many hospital admissions for every death means that the analysis presented in this paper probably represents no more than the tip of the iceberg in terms of the number of events. Throughout Scotland, it has been estimated that “Violence costs the Scottish economy around £3 billion each year in healthcare, law enforcement and lost productivity”.38
What are the known correlates of violent behaviour? Alcohol and drug use have been shown to contribute to homicides and to violence more generally. Shaw et al estimated that alcohol or drugs (taken by the perpetrator) contributed to 45% of a national sample of homicides in England and Wales collected over 3 years between 1996 and 1999,39 although they believed this figure to be conservative. A similar level of alcohol use was reported in several international studies of homicide.40 More generally, alcohol use has been shown to contribute to violent behaviour among adolescents,41 while in Scotland school children who used drugs were more likely to carry weapons.42 Social correlates have also been promoted; Heath43 suggested that carrying a knife is another dimension of poverty. The existence of inequalities between social groups has been recognised as an important risk factor for violence,44 and an ecological cross-national study showed a negative correlation between gross national product per capita and a country's homicide rate.45
So what can be done about the high homicide rate and the associated inequalities? Brookman and Maguire40 made a range of policy recommendations for the reduction of homicides in the categories of domestic homicide, the killing of infants, alcohol-related homicide and homicide with guns or knives. The Scottish Government is already seeking ways to reduce alcohol-related problems including violence.46 As a means of reducing knife crime, Hern et al20 advocated a ban on the sale of long pointed knives, something that could be considered in Scotland given the considerable role that knives play. For interventions to reduce youth violence to succeed, Kellermann et al47 recommended that they should take place before the age of 6 years and must either address multiple risk factors simultaneously or else should be tailored for specific target groups. Addressing the gang culture is an example of such a targeted approach.48 However, the extent of the inequalities seen for assault in Scotland, coupled with high death rates for causes associated with alcohol and drug use and mental wellbeing among the most disadvantaged groups, emphasises the need to understand and address the multiplicity of problems associated with deprivation and poverty.
Our study has demonstrated the extent of inequalities in deaths due to assault in Scotland and the role played by knives and other sharp weapons. Although we have no information on the perpetrators of the assaults from death records, we have offered a comprehensive insight into the inequalities that occur and the extent to which they are patterned by socioeconomic circumstances.
What is already known on this subject
Scotland has a high death rate due to assault compared to other countries.
Mortality from assault is known to be higher among more disadvantaged populations.
What this study adds
Social inequalities in mortality due to assault in Scotland are of far greater magnitude than those reported elsewhere.
The scale of these inequalities means that any attempt to address inequalities in mortality in Scotland—particularly among young men—must tackle the problem of assault, particularly that involving knives and other sharp weapons.
Acknowledgments
We are grateful to the General Register Office (Scotland) for the provision of data and to the referees for their helpful comments.
References
Footnotes
Funding The Social and Public Health Sciences Unit is jointly funded by the Medical Research Council (MRC) and the Chief Scientist Office (CSO) of the Scottish Government Health Directorates. This work was funded by the Chief Scientist Office as part of the “Measuring health, variations in health and the determinants of health” programme, wbs U.1300.00.001. Neither the MRC nor the CSO had any role in study design, analysis or the interpretation of the results.
Competing interests None.
Ethical approval This study was based on the analysis of anonymised mortality data and as such did not require ethical approval.
Provenance and peer review Not commissioned; externally peer reviewed.