Article Text

Abstract
Background: Thailand is undergoing a health-risk transition with overweight and obesity emerging as an important population health problem. This paper reports on a study of the transition, focusing on “lifestyle” factors such as diet (fried foods, soft drinks, Western-style fast foods) and physical activity (mild, moderate, strenuous exercise, housework/gardening and screen time).
Methods: A baseline survey was administered to 87 134 adult students from all regions of Thailand attending an open university.
Results: 54% of the cohort was female. Participants’ median age was 29 years. By self-reported Asian standards, 16% of the sample was obese (body mass index (BMI)⩾25) and 15% overweight at risk (BMI⩾23–24.9). Men were twice as likely as women to be overweight (21% vs 9%) or obese (23% vs 10%). Obesity was associated with urban residence and doing little housework or gardening and with spending more than 4 hours a day watching television or using computers. The latter occurred among 30% of the cohort, with a population attributable fraction (PAF) suggesting that it accounts for 11% of the current problem. Daily consumption of fried food was associated with obesity, and eating fried foods every second day or daily had a PAF of nearly 20%.
Conclusions: These health-related behaviours underpinning the Thai health transition are associated with increasing obesity. They are modifiable through policies addressing structural issues and with targeted health promotion activities to prevent future obesity gains. Insights into future trends in the Thai health transition can be gained as this student cohort ages.
This is an open-access article distributed under the terms of the Creative Commons Attribution Non-commercial License, which permits use, distribution, and reproduction in any medium, provided the original work is properly cited, the use is non commercial and is otherwise in compliance with the license. See: http://creativecommons.org/licenses/by-nc/2.0/ and http://creativecommons.org/licenses/by-nc/2.0/legalcode.
Statistics from Altmetric.com
Accelerating socioeconomic changes in South-East Asia in the last few decades have been accompanied by profound transformations in diet and way of life. A nutrition and health transition is under way in which high mortality, high prevalence of infectious diseases and undernutrition are replaced by lower mortality, falling birthrates and overnutrition, the last manifest in higher prevalences of overweight and obesity.1 2 Thailand is one of several South-East Asian countries in which a move from an agrarian to an industrial and postindustrial economy with an increasingly urbanised population is accompanied by rapid changes in diet, including more oil, fats and animal meat and less vegetables and fruit.3 4 Between 1969 and 2003 the estimated intake of kilocalories in Thailand increased from 2110 to 2400;5 and over two decades (1983–2003), sugar consumption among Thais more than doubled from 12.7 to 30.5 kilograms per person per year.4 Such dietary changes are considered likely to contribute to increasing heaviness among Thais, while decreasing physical activity6 7 following urbanisation and occupational changes may also play a role.
Unfavourable shifts in population weight which result from direct relationships between distal factors such as urbanisation and proximal lifestyle changes have not been explored in Thailand previously. However, the expansion in obesity has been well documented through serial cross-sectional surveys starting in 1986 (3rd National Nutrition Survey), and 5-yearly National Health Surveys (NHESs) commencing in 1991.3 Data from the second (1997) and third (2004) NHES show the age-standardised prevalence of overweight at risk increased from 16.2% to 18.2%, class I obesity (25⩽body mass index (BMI)<30) increased from 19.3 % to 22.8 % and class II obesity (BMI⩾30) from 6.3% to 7.5%,8 with growth even more marked among 40–49 year olds.4 Expansion in the Thai population’s weight is not evenly distributed with increases in men’s and women’s weight being more pronounced in Bangkok and the Central region and lowest in the North and North-Eastern regions.7 Recently (in 2004) the prevalence of overweight at risk was higher among urban (19.1%) than among rural men (17.8%) and a higher proportion of them (25%) had class I obesity compared with rural men (16.8%). In contrast, the prevalence of overweight was lower among rural (17.5%) than among urban women (18.6%) but more rural women (26.9%) were obese than urban women (25.4%).8
The implications of this emerging weight “epidemic” are troubling: cardiovascular diseases, non-insulin-dependent diabetes mellitus (NIDDM), hormone-related cancers and gall-bladder disease are all expected to surge.9 Diabetes has already increased rapidly in the region, including Thailand.10 Considerable economic and social costs associated with obesity are expected, with implications for the healthcare system;9 for example, in China and India the costs of obesity and related diseases will outstrip the costs of undernutrition in the next quarter of a century.2
To intervene it will be important to map the multilevel drivers of obesity. Little relevant information is available at the individual level for Thais. We attempt here to redress this deficit with data from a national sample of mostly mature-age students from Sukhothai Thammathirat Open University (STOU), which allowed us to examine relations among socioeconomic and lifestyle factors and body size.
METHODS
Study population
STOU is an open university that enrols over 200 000 mostly mature-aged students each year from all over Thailand. Many are rural dwellers and most have full-time jobs. The baseline questionnaire was mailed out to approximately 200 000 STOU students from April to November 2005. By February 2006 a final total of 87 134 had responded (44%). The characteristics of the STOU cohort are similar to those of the population of Thailand, except that more of the cohort resides in urban areas (51.8% vs 31.1%), more live in Bangkok and the Central region (47% vs 24%) and more are aged less than 40 years (84% vs 49%). A detailed description of the study population, the development of the questionnaire and the management of the survey has been provided by Sleigh et al.11 The 20-page questionnaire covered seven domains: (1) socioeconomic status, ethnicity and the domestic environment in the present and past, (2) occupation, income and work stresses, (3) self-reported current height (in centimetres) and weight (in kilograms), size at birth (reported to government registers by relatives), whether breast fed, and health history, insurance and health services use, (4) social networks and trust, religion, spiritual health, sense of well-being and satisfaction, (5) food sources, preferences and intake, exercise and physical activity, (6) tobacco and alcohol use, use of transport and safety risks and (7) respondent’s family health background. In this analysis, socioeconomic status (income, education, marital status, Chinese ethnicity, region and urbanisation), items indicative of dietary change (fried foods, instant foods, soft drinks, Western-style fast foods) and physical activity (exercise, mild, moderate and strenuous exercise, housework/gardening and screen time) were investigated for their association with self-reported BMI.
Ethics approval was obtained from the ANU Human Research Ethics Committee and the ethics committee of STOU.
Diet and physical activity risk factors
Respondents recorded the frequency of consuming deep fried food, soft drinks and Western-style fast foods (eg, pizza) on a five-point Likert scale ranging from never or less than once a month to once or more a day, while fruit and vegetable intakes were noted as portions eaten per day. They were asked if they have ever smoked, when they started and when they quit, similar questions about alcohol consumption, and how many hours a day they spend sleeping, watching television or playing computer games. Information on exercise was obtained through four items which asked the number of times per week the respondent engaged in strenuous, moderate and mild exercise for at least 20 minutes, or walked for at least 10 minutes. Housework frequency (eg, gardening and cleaning) was recorded based on five choices ranging from seldom or never to most days. We examined general patterns of association between major sociodemographic factors (table 1) and body mass.
BMI is our measure of obesity, calculated as weight (kg)/height2 (m2); weight and height were self-reported, with a validation study done on a small subset. Cut-points delineating overweight and obesity were set at BMI values ⩾23 and ⩾25 in accordance with studies in other Asian (Japanese) populations12 and International Obesity Taskforce (IOTF) recommendations. Weight-related disease in Asian populations occurs least when BMI is about 22 or less,13 and significantly increases with BMI⩾23.9 The IOTF proposed a more detailed classification for BMI in adult Asians, dividing the overweight group into three comorbidity risk categories: 23–24.9, overweight at risk; 25–29.9, obese at moderate risk; ⩾30, obese at severe risk.14
In this paper our analytical focus is on the extreme outcome of obesity, but the patterns of association we found were very similar for overweight in general; we provide an overview of the chief influences on obesity across broad areas related to lifestyle/modifiable factors, in the context of core sociodemographic variables. Odds ratios (ORs) were derived from logistic regression models as described in context. We have displayed variables which consistently show associations with obesity in our research and in previous studies8 by age and sex, as these had major independent effects on BMI. We have calculated population attributable fractions (PAFs = [P(exp)×(OR–1)]/[P(exp)×(OR–1)+1] for the apparently more important factors, to give an indication of their potential public health importance.15
RESULTS
The STOU cohort members in 2005 were mostly in the third or fourth decade of life, with a median age of 29 years and an age range of 15–87 years with a slight excess of women (54.3%). Half the cohort members lived in rural areas and almost all were Buddhist. Although the students dwelt in all four main regions of Thailand, a greater proportion resided in the Central region than in other areas. In all these attributes, and additionally in income (median below US$3000), the cohort represents the Thai population well,11 although with somewhat higher levels of education.
Overall, 16% of the cohort was obese (BMI⩾25) and 15% overweight at risk (BMI⩾23–24.9). There were striking differences in average BMI according to age and sex (fig 1): men had higher BMI values than women in all age groups, with an overall mean BMI for men of 22.9 (SD 3.2) compared with 20.9 (SD 3.2) for women. Twice the proportion of men compared with women were overweight at risk (21% vs 9%) or obese (23% vs 10%). For both sexes BMI increased rapidly with age, with the proportion obese or overweight tripling or more across the three age strata, with 38% of men and 22% of women over 40 being obese.

Box-and-whisker plots† of body mass index (BMI) by age and sex. †The lines through the middle of the boxes are the medians. The tops and bottoms of the boxes are the upper and lower quartiles. The whiskers are drawn at 1.5 times the interquartile ranges. Values beyond the whiskers (outliers) are not shown. The horizontal lines indicate Thai BMI cut-off levels for overweight (BMI = 23; dotted line) and obese (BMI = 25; dashed line).
Sociodemographic factors associated with obesity
In unadjusted analyses there were positive links between obesity and income, having a partner or being a persistent urban dweller (60% excess risk compared with those who always had a rural residence); an effect of Chinese heritage was somewhat weaker. Obesity declined slightly away from Bangkok and the Central region while education showed no association. Unsurprisingly, after adjusting for age and sex, all associations were much weaker, except for urbanisation which altered only slightly (table 1). When analysed by age and sex, the association between income and obesity was most pronounced among men aged over 25, while the effect of urbanisation was stronger among men and women aged less than 40 (fig 2).
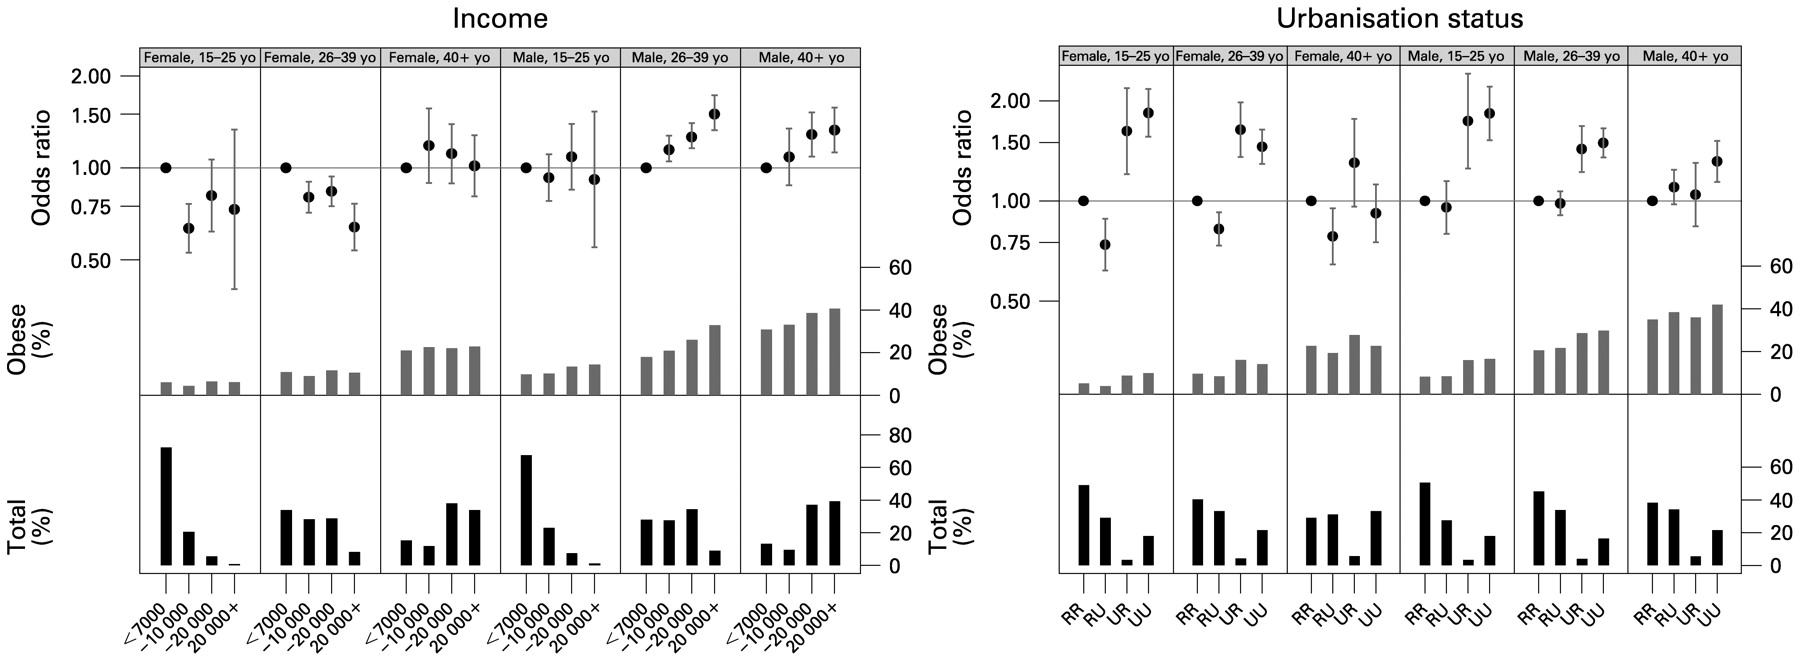
Income and urbanisation status†, by age and sex. †RR, lived in rural area when 10–12 years old and in rural area in 2005; RU, rural when 10–12 years old, urban in 2005; UR, urban when 10–12 years old, rural in 2005; UU, urban when 10–12 years old, urban in 2005. Each graph has three components: bottom bar charts show frequency distributions (% Total); bar charts in the middle row show the prevalence of obesity (% Obese); plots in the top row show ORs with 95% CI bars (OR). The ORs were derived from logistic regression models of obesity adjusted for age and sociodemographic factors, separately for each age–sex subgroup.
Health-related behaviours
Two direct activity-related variables (mild exercise–walking, moderate–strenuous exercise) showed weak associations between activity and obesity (p value for trend <0.001 for both; OR, for never versus every day, 1.1 for both (p<0.05)). Those activity-related variables amenable to better measurement (housework–gardening, television watching–using computers) both showed dose–response effects in adjusted analyses (p value for trend <0.001), with the “minimal effort” groups being 40% more likely to be obese than those most active. Patterns were quite similar across age–sex groups (fig 3), with the minor exception of young women’s frequency of exercising at least moderately.
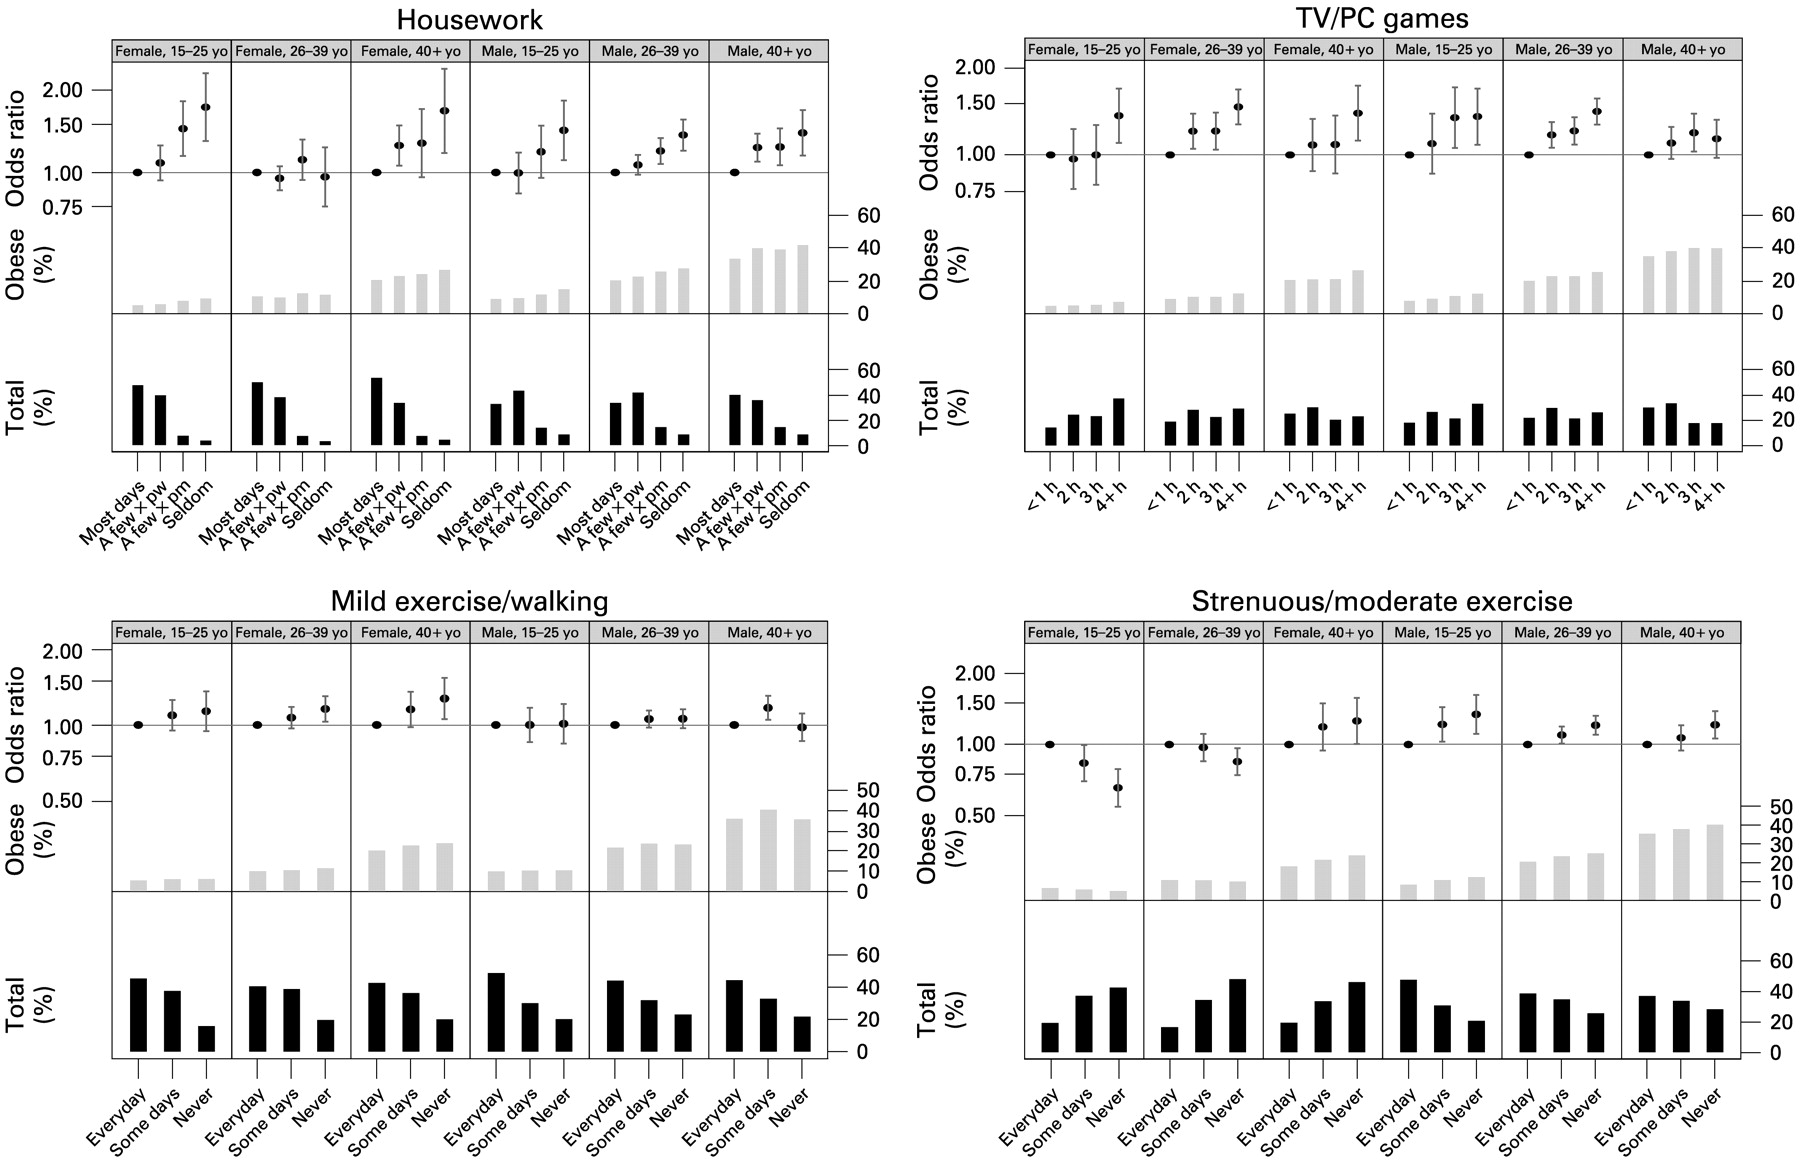
Physical activity–housework, screen viewing, mild and strenuous exercise, by age and sex. Each graph has three components: bottom bar charts show frequency distributions (% Total); bar charts in the middle row show the prevalence of obesity (% Obese); plots in the top row show ORs with 95% CI bars (Odds ratio). The ORs were derived from logistic regression models of obesity adjusted for age, sociodemographic factors and health-related behavioural factors, separately for each age–sex subgroup. The models for women did not include smoking and drinking.
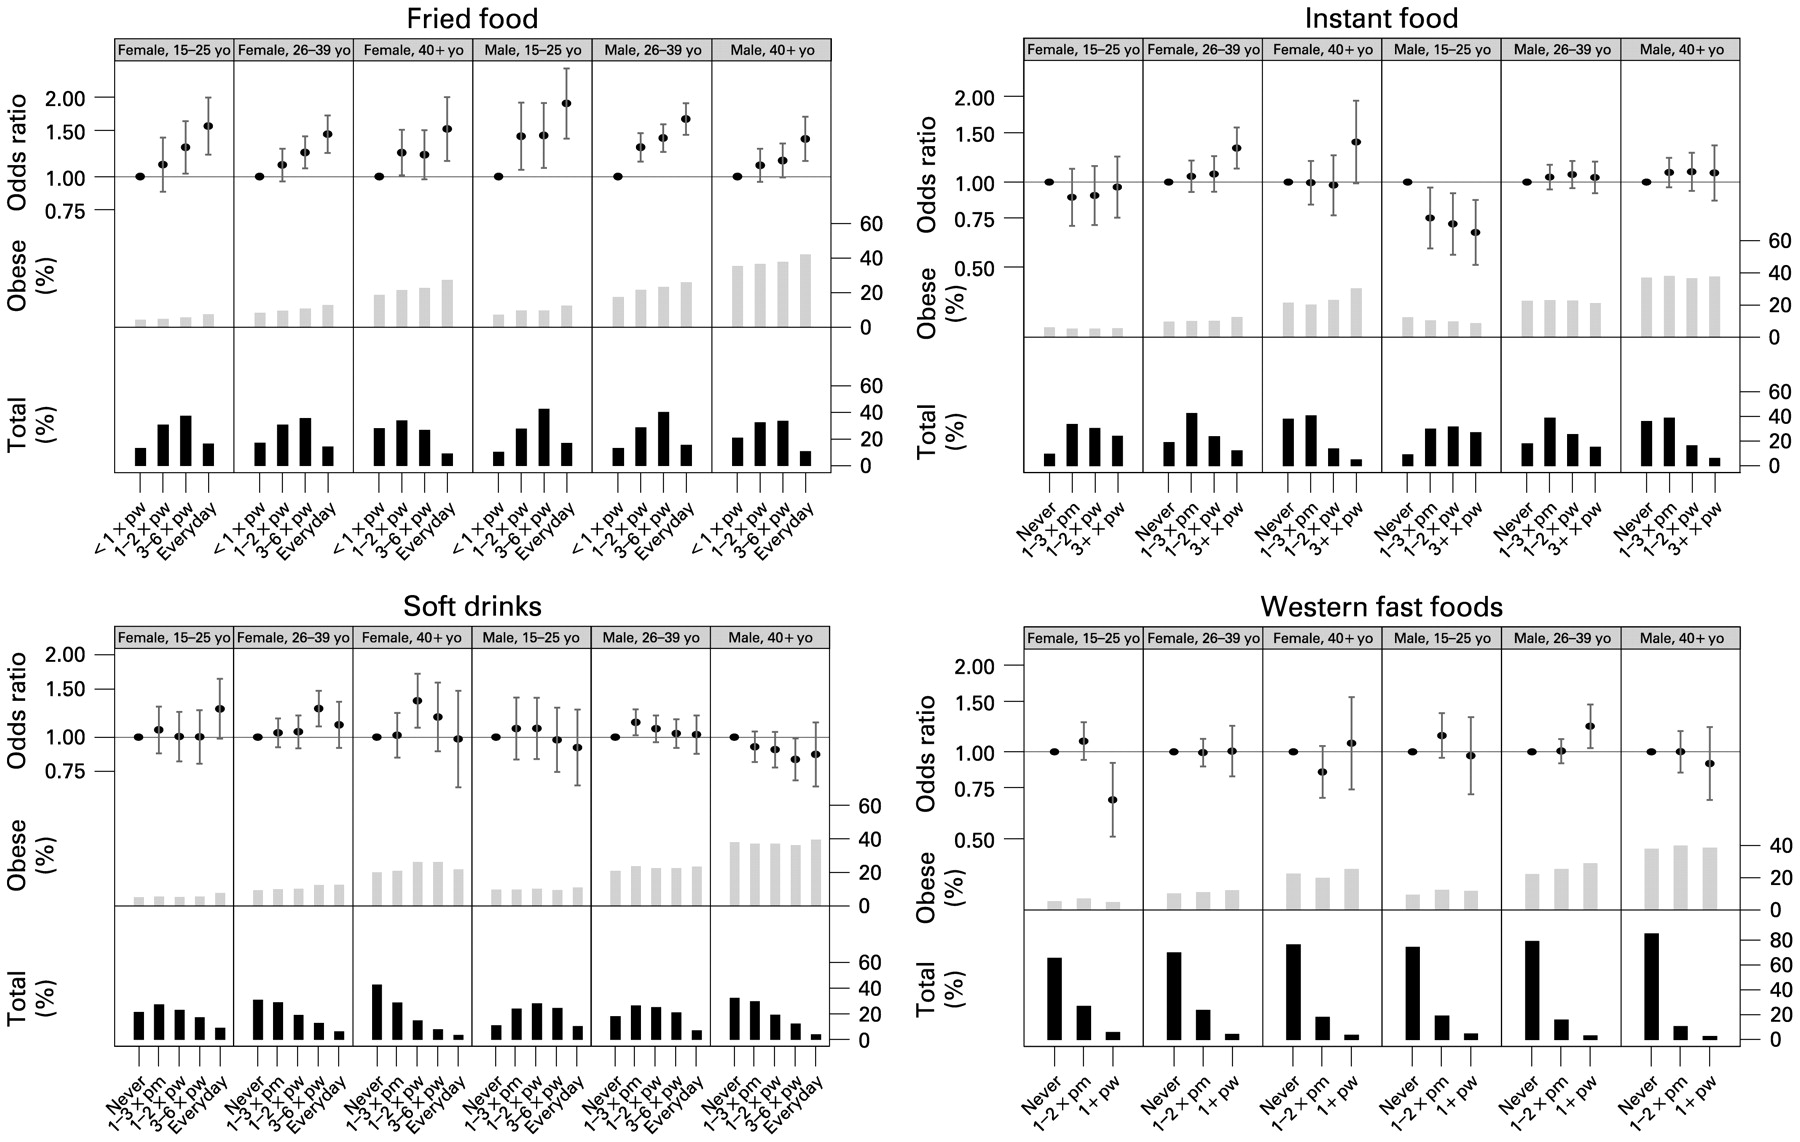
The most striking association between food choice and obesity was with the dose–response increase with frequency of eating fried foods (p value for trend <0.001, OR (95% confidence interval (CI)) every day compared with seldom 1.6 (1.5–1.7)); this was consistent across age and sex (fig 4). Weak associations were seen with Western-style fast food (p value for trend = 0.003, OR (95% CI) every day compared with seldom 1.1 (1.0–1.2)), instant food (p value for trend 0.001, OR (95% CI) three or more times a week compared with seldom 1.2 (1.0–1.3)) and soft drinks (p value for trend <0.001, OR (95% CI) every day compared with seldom 1.2 (1.0–1.3)). There was little variation in obesity prevalence according to intake of fruit and vegetables.
Diet–fried foods, instant foods, soft drinks and Western-style fast foods, by age and sex. Each graph has three components: bottom bar charts show frequency distributions (% Total); bar charts in the middle row show the prevalence of obesity (% Obese); plots in the top row show ORs with 95% CI bars (OR). ORs were derived from logistic regression models of obesity adjusted for age, sociodemographic factors and health-related behavioural factors, separately for each age–sex subgroup. The models for women did not include smoking and drinking.
Male never-smokers had slightly less obesity than others; there was no indication of any meaningful relation between drinking alcohol and body mass. Women were excluded from these analyses as so few smoked or drank.
The PAF for watching television/computer games more than 4 hours daily was 10.7%, for doing housework or gardening infrequently 2.3%, and for eating fried foods daily 8.3%. Combining the PAFs for daily and second-daily consumption of fried foods gave a PAF of 18.5%.
DISCUSSION
The results from this large national cohort indicate that overweight and obesity are already problems in Thailand, especially among urban men at older ages. They also offer some clues as to distal and proximate “drivers” of increasing weight status. Increasing obesity was linearly associated with doing little housework or gardening and with spending more than 4 hours a day watching television or using computers. The last is likely to be of greater public health importance as it is a more frequent behaviour (30% of the cohort), with a PAF suggesting it may account for around 11% of the current problem. Daily consumption of fried food was associated with obesity, and, overall, eating fried foods second-daily or more had a PAF of nearly 20%. While both factors have face validity as direct causes of weight increase, they will also in part be markers of a pattern of transitional changes. There was little indication of effect modification of these relations by age or by sex, although housework or gardening was more common among women than among men, reflecting gendered domestic roles. Participation in formal exercise had little association with obesity except among young women, who were more likely to be larger, suggesting that they may have been undertaking exercise to lose existing excess weight.
Because the data from this study are cross-sectional it is not possible to be sure that the relations observed are causal, although as diet and activity are directly relevant to energy balance they have substantial face validity as likely causes across the developing world.1 BMI was based on self-reported height and weight, which may differ from measured values but is widely used and accepted to indicate body fatness.16 A separate study of 741 STOU students comparing self-reported with measured weights and heights showed over-reporting of heights and under-reporting of weights. Using adjustment factors from this validation study, prevalences of obesity and overweight at risk in the STOU cohort sample were estimated to be slightly higher, 28% and 24%, respectively, for men, and 12%, and 11% for women.
Discrepancies in the reporting of weights and heights did not significantly alter the size of the associations between obesity and health-related factors.
Although the cohort is similar to the Thai population in its geographical distribution and sociodemographic features, it represents a younger, more urban and educated group.11 The prevalence of overweight in the cohort is very similar to the 18% found in the third NHES (2004), while obesity is much lower among STOU women (10% compared with NHES 36%) but similar among men in the two studies (23%).8 In the STOU cohort the prevalence of overweight and obesity among men is double that of women, whereas in the general population men and women were equally likely to be overweight and women were much more likely to be obese.8 Even though our cohort is a little younger and more urbanised than the general population our results point to the important associations between increasing age and urbanisation with heavier body mass. These modest differences do not seem to be a reason to preclude useful generalisation from our findings on lifestyle associations to Thailand as a whole and may indicate the likely weight distribution as Thailand’s population ages and urbanises.
The finding that obesity is associated with an increasingly sedentary lifestyle, indicated by doing little housework or gardening and by spending more than 4 hours per day on screen viewing, may reflect the transition of the Thai population from a rural, agrarian way of life requiring high levels of physical labour to an urban and more automated lifestyle. Apparently, the amount of activity performed specifically as “exercise” has little effect on obesity levels when there is a large background effect of declining levels of overall activity due to increasingly sedentary work, household duties and automated transport use. In other transitioning countries, the work patterns of low socioeconomic status populations have shifted from high energy expenditure activities such as farming, mining and forestry to less energy-demanding jobs in the service sector,2 further exacerbating the trend towards heavier populations. Developing Asian countries are following patterns established in Western countries, where reduced leisure time and fewer opportunities for recreational exercise, along with environmental factors such as mounting car use17 and urban design, all contribute to population weight increases.18
Turning to dietary behaviours, we note that the strong association between frequent fried food consumption and obesity possibly points to an important modifiable risk factor. However, we do not know what type of fat is used to fry food nor from which culinary tradition (Thai-style dishes, introduced Western foods) the fried food comes. That Western-style fast food plays less of a role in obesity levels than fried food probably reflects its recent appearance in the Thai landscape and diet. Western fast food outlets are concentrated in urban settings, whereas street vendors selling inexpensive (including fried) foods, which are frequently purchased by “plastic bag housewives” for the family meal, are common throughout Thailand.19
Soft drinks are another form of consumption implicated in growing levels of obesity among young people in the West. A very slight trend between soft (Western-style carbonated) drink consumption and increasing obesity was observed. Thai undergraduates consume most of their higher than recommended amounts of sugar in drinks, followed by bakery products and Thai sweets.20 Sugar consumption has increased over the same period that the weight of the Thai population has increased.4
While the global trend towards modernisation appears inexorable, some transitioning countries are now resisting its more health-damaging dimensions. Korea, for example, aims to discourage its population from adopting a Western diet by public campaigns promoting a traditional diet which is high in carbohydrates and vegetables and low in fats,21 thus providing a possible model for similar interventions elsewhere in Asia.
The STOU cohort can be considered to be “ahead” of the general population because it is slightly younger, more urbanised and better educated. This allows us to identify trends somewhat earlier, highlighting vulnerable groups in the general population: for example, poorer and less educated women, all men, urban residents, those adopting a modern high-fat diet and those undertaking little physical activity. The Thai government has already established programmes to promote healthy diet and activity levels with the publication and dissemination of food-based dietary guidelines that include the recommendation to “take moderate amounts of fat”. Fitness and exercise programmes are being promoted, along with advice to quit smoking and restrict alcohol consumption.22 The latest Thai National Economic and Social Development Plan is also concerned with addressing preventable lifestyle-related diseases and with the problem of “overnutrition”.23 Thailand has particularly high levels of television advertising (often aimed at children) of unhealthy foods, suggesting that advertising restrictions could assist.24 These interventions need to be supplemented by policies that consider environmental changes and urban planning for physical activity.8 Other possible population-level interventions could include slowing the shift to convenience foods, particularly those high in sugars and fats, raising awareness of increasing obesity risk among adults who spend time on screen-based activities, resisting rising levels of car reliance through investments in public transport, and adopting policies that slow the trend to urbanisation.
What is already known on this subject
Obesity levels are changing in Thailand as it undergoes a health and nutrition transition that includes profound shifts in patterns of diet and physical activity.
What this study adds
This baseline study of a large national cohort of open university students shows that obesity is escalating, particularly among wealthier, urban and older men. Lifestyle factors linked to the Thai health transition include increasing consumption of fat and use of screen-based activities (television/PC games) and decreased housework and gardening. These factors are converging to produce emerging obesity problems.
Acknowledgments
We are grateful to the 87 000 plus STOU students who participated in the study. We appreciate the valuable comments and input into the development and implementation of this study from Thai and Australian members of the research team.
REFERENCES
Footnotes
Funding: Research funds were provided by the Wellcome Trust (UK) and the National Health and Medical Research Council, Dept. of Health, Woden, Australia. STOU and ANU provided facilities and support services.
Competing interests: None.
Ethics approval: Ethics approval was obtained from the ANU Human Research Ethics Committee and the ethics committee of STOU.