Article Text

Abstract
Objective: To investigate how anti-discrimination legislation in the form of the UK Disability Discrimination Act (DDA) affected socioeconomic disparities in the employment rates of people with a limiting long-term illness (LLTI) or disability.
Design: National cross-sectional data on employment rates for people with and without an LLTI or disability were obtained from the General Household Survey (GHS) for a 14-year period (1990–2003; 12 surveys). Representative population samples were analysed. The sample size for the GHS over the study period ranged from 19 193 to 24 657 and the average response rate ranged from 72% to 82%.
Main outcome measure: Age-standardised employment rates for individuals with and without an LLTI or disability, analysed by sex and socioeconomic status.
Results: Analysis of covariance identified that the DDA had had a negative effect on employment rates for individuals with an LLTI or disability during the study period. This negative effect was found to be differential according to social class ranging from no effect in social classes I and II (−2.86%, 95% CI −8.7% to 2.99%), increasing with social class group, to a highly significant effect in social classes IV and V (−10.7%, 95% CI −6.16% to −15.24%). No differential effect was identified by sex.
Conclusions: Anti-discriminatory legislation is not an effective way of overcoming the employment consequences of ill health and disability, nor is it a useful public policy tool in terms of reducing inequalities.
- DDA, Disability Discrimination Act
- GHS, General Household Survey
- LLTI, limiting long-term illness
- RGSC, Register General’s Social Class
Statistics from Altmetric.com
- DDA, Disability Discrimination Act
- GHS, General Household Survey
- LLTI, limiting long-term illness
- RGSC, Register General’s Social Class
There is an abundant and well-established literature describing socioeconomic inequalities in health status.1–3 Inequalities in the social and economic consequences of ill health, however, is a much less prominent and developed area of research, but arguably no less important for tackling inequality.4 Furthermore, attempts to empirically examine how public policy interventions affect these consequences or their social distribution are not widespread.4,5
Ill health and disability are often associated negatively with poverty, social exclusion and, perhaps most importantly in terms of the social determinants of health, lower employment rates.3–6 For example, in the UK, like in many other countries, people with a disability or limiting long-term illness (LLTI) have a disproportionately low employment rate: currently, around 50% of people with a disability of working age (18–60/65 years) are in employment compared with 80% of those without a disability.7 Furthermore, these adverse employment consequences are not evenly distributed across socioeconomic groups. A social gradient is evident, with professional classes fairing the best.4
In the UK, and elsewhere, public policy has been used as a tool by which the employment consequences of ill health or disability can be ameliorated8—for example, active labour market policies such as subsidised employment, training programmes or vocational rehabilitation, and more recently, anti-discriminatory legislation.4,8,9,10,11 The Disability Discrimination Act (DDA) was introduced in the UK in 1995. It made it unlawful to “discriminate against disabled persons in connection with employment, the provision of goods, facilities and services, or the disposal or management of premises” (box 1).12 Similar legislation is in place in other countries such as the USA, Australia, Sweden and The Netherlands.11
Box 1 Disability Discrimination Act (1995)
-
The 1995 UK Disability Discrimination Act (DDA) made discrimination on the grounds of physical or mental disability or limiting long-term illness illegal: since the implementation of the DDA from 1996 onwards it has been unlawful to “discriminate against disabled persons in connection with employment, the provision of goods, facilities and services, or the disposal or management of premises”.12
-
Employers are required to make “reasonable adjustments” to work and premises to cater for people with a disability.
-
Originally, the employment provisions of the DDA only applied to companies with >15 employees. However, since the 2003 amendments, it applies to all employers.
-
More recent amendments such as the 2001 Special Educational Needs and Disability Act have extended the remit of disability anti-discrimination legislation to other areas with employment opportunity implications such as access to education and training.26
-
Under the DDA, disability is defined as: “a physical or mental impairment that has a substantial and long-term adverse effect on his/her ability to carry out normal day-to-day activities”.12,27
-
Physical impairment—this includes weakening or adverse change of a part of the body caused through illness, by accident or from birth, such as blindness, deafness, heart disease, the paralysis of a limb or severe disfigurement.
-
Mental impairment—this can include learning disabilities and all recognised mental illnesses.
-
Substantial—this does not have to be severe, but is more than minor or trivial.
-
Long-term adverse effect—that has lasted or is likely to last >12 months.
-
A normal day-to-day activity—that is, one that affects one of the following: mobility; manual dexterity; physical coordination; continence; ability to lift, carry or otherwise move everyday objects; speech, hearing or eyesight; memory or ability to concentrate, learn or understand; or perception of the risk of physical danger.
In a previous paper, we found that the aggregate employment rates of people with a disability or an LLTI were at their lowest after the implementation of the DDA. In addition, we found that the employment gap between people with and without a disability was most marked in the post-DDA period. In short, we concluded that the DDA had no positive effect on the employment rates of people with a disability. Our results reinforced the findings of other empirical work on the limits of the DDA,13–15 they reflected the criticisms of the DDA by academics and disability activists,16–19 and they corresponded with the broad results of international research on disability discrimination legislation.20,21
However, both UK and international research has so far only examined the aggregate-level employment effects of anti-discrimination legislation and there has been no exploration of any effect on socioeconomic inequalities in the employment consequences of LLTI or disability. Disaggregated research would not only offer a more comprehensive overview of the effects of anti-discrimination legislation, but would also enable judgements to be made about whether it is a useful policy tool for tackling inequalities. Therefore, in this paper, we expand on our previous DDA research by providing the first exploration of the effects of anti-discriminatory legislation on inequalities in the employment consequences of ill health and disability.
METHODS
Data extraction
The study comprised an analysis of routinely collected, representative national data based on the General Household Survey (GHS). The GHS is a multipurpose continuous cross-sectional survey and is carried out annually by the Social Survey Division of the Office for National Statistics. The survey collects information by interview on personal, demographic, household, health and income characteristics from households in the UK.22 This analysis utilised survey data over a 14-year period from 1990 to 2003 (the latest published data), with a sample size ranging from 19 193 to 24 657 and response rates ranging from 72% to 82%. The GHS was not conducted in 1997 and 1999 and therefore the routine data analysis pertains to 12 surveys.
To define disability for the study, questions asked about LLTI in the GHS were used (box 2) as an alternative to the DDA definition of disability, which was not available for the whole period of analysis (box 1). The utilisation of the GHS definition allowed a continuous definition of disability to be used before and after implementation of the DDA. The GHS definition was therefore not directly affected by changes to the definition of disability that the DDA may have created (for example, from 1997 the Labour Force Survey definition of disability was changed to reflect that of the DDA). We previously demonstrated that the GHS definition of disability was comparable to the DDA definition; similar age-standardised rates of disability and employment rates in the disabled were observed for the GHS and the Labour Force Survey (after 1997).11
Box 2 Questions relating to employment, disability and long-term illness in the UK General Household Survey (1990–2003)
Working
-
Did you do any paid work in the 7 days ending Sunday the (n), either as an employee or as self-employed?
Yes—1
No—2
Illness [*]
-
Do you have any long-standing illness, disability or infirmity? By long standing, I mean anything that has troubled you over a period of time or that is likely to affect you over a period of time?
Yes—1
No—2
Limited activity
-
Does this illness or disability (do any of these illnesses or disabilities) limit your activities in any way?
Yes—1
No—2
Sex
-
Are you:
Male—1
Female—2
Social class
-
Based on Registrar General’s Social Class classification from occupation before 2001 and occupational unit, employment status and size of establishment (after 2001):
I—1
II—2
IIIN—3
IIIM—4
IV—5
V—6
Data extraction included information from the GHS pertaining to disability, employment status and various demographic details including age, sex and social class (box 2). Disability was defined as “any long-standing illness or disability that has limited activity” (“disabled”). This group was compared with those without an LLTI or a disability (defined as “not disabled”). The proportion of people defined as disabled was similar over the 14 years of data collection using the GHS (rates of disability ranged from 17.5% to 20.5% from 1990 to 2003).
Employment status was defined as “working” (currently in paid employment) or “not working” (not currently in paid employment). For this analysis only individuals of working age (18–60 years in women and 18–65 years in men) were selected.
Before 2001, the GHS measured social class on the basis of occupation (formerly Register General’s Social Class (RGSC)) and grouped individuals with similar levels of occupational skill using an ordinal scale with six categories (I, II, IIIN (non-manual), IIIM (manual), IV and V). After 2001, the GHS adopted new socioeconomic groupings, as recommended by the Economic and Social Research Council, classifying people with similar social and economic status. This new socioeconomic classification was derived from occupational unit group, employment status and size of establishment, and included eight groupings: 1 (higher managerial and professional occupations), 2 (lower managerial and professional occupations), 3 (intermediate occupations), 4 (small employers and own account workers), 5 (lower supervisory and technical occupations), 6 (semiroutine occupations), 7 (routine occupations) and 8 (never worked and long-term unemployed). Using the new classification, it is possible to produce an approximated version of the previous socioeconomic classification (RGSC) and these approximations have been shown to achieve an overall continuity level of 87%.23 For the purpose of this analysis, social class has been measured using the RGSC classification for the 12 surveys of the GHS.
Data analysis
GHS data were available for 12 surveys (1990–1996, 1998 and 2000–2003). Employment rates for each survey were calculated for “disabled” and “not disabled” and standardised for age using the European Standard Population, adjusting for differences in age structure over the data collection period. Differences in employment rates between disabled and not disabled groups for each of the 12 surveys were also calculated. The analysis was then stratified by sex and social class; given the relatively small numbers of unemployed individuals with a disability in social class I and V, social class was grouped accordingly to maximise the efficiency of the analysis: 1, I/II; 2, IIIN; 3, IIIM; and 4, IV/V.
Analysis of covariance was used to estimate the effect of the DDA on employment rates for people defined as disabled. The analysis was carried out in SPSS by using the univariate general linear model function. Models included employment rate as the dependent variable and disability (1, “disabled” and 0, “not disabled”), DDA (1, “post-DDA”; years 1998–2003 and 0, “pre-DDA”; years 1990–1996) and year of survey as covariates. To estimate the effect that the DDA might have had on employment rates in people defined as disabled, an interaction term was added to each general linear model representing “disability×DDA”. All analyses were stratified by (1) sex and (2) social class. SPSS V.13 statistical software was used to carry out the analyses.
RESULTS
We reported elsewhere that, since the implementation of the DDA, the disparity in employment rates between disabled and not-disabled people has actually seemed to increase.11 In this analysis, we found no evidence that this disparity differed by sex; disabled men and women were equally likely to have a consistently lower employment rate since the implementation of the DDA than not disabled men and women. However, a differential pattern was observed by socioeconomic class.
Age-standardised employment rates for not disabled and disabled people over the 14-year period are shown by socioeconomic class group in figs 1 and 2. Employment rates for the not disabled group seem to have slightly increased for all socioeconomic classes over the 14-year period (fig 1). Although the gap between employment rates for socioeconomic classes I and II and IV and V seemed to remain constant over the period of analysis, employment rates for socioeconomic class IIIM have risen to match those of socioeconomic classes I and II after 2000.
Age-standardised employment rates from 1990 to 2003 in people defined as not disabled by social class (four groupings).

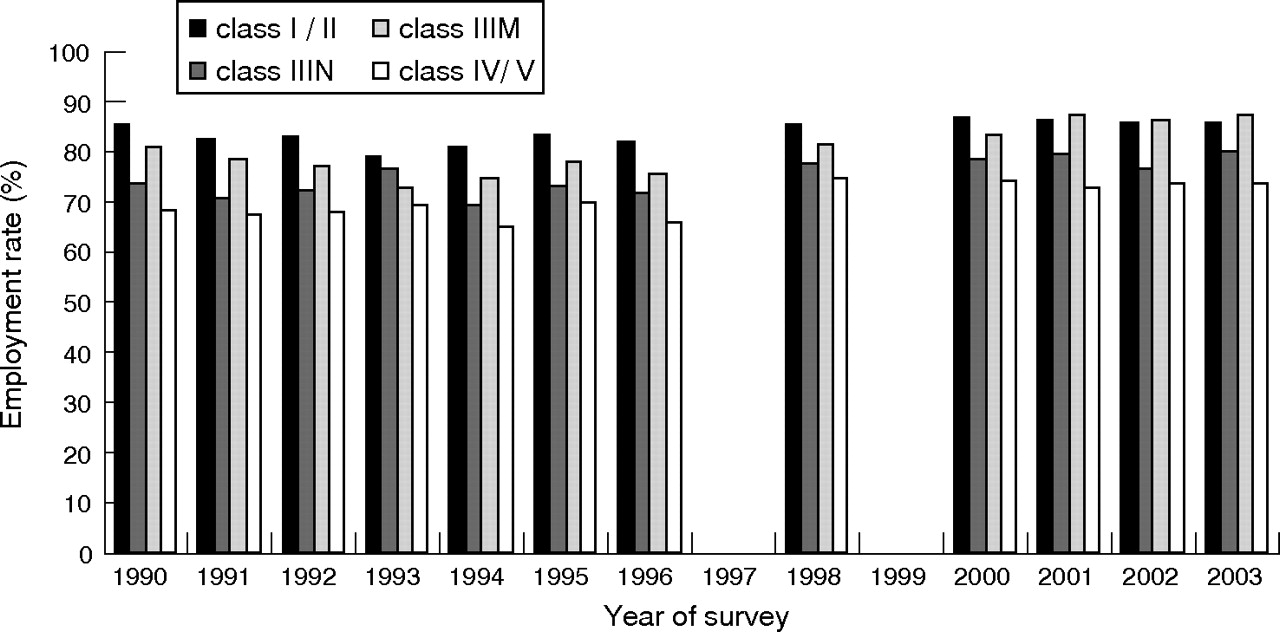
Age-standardised employment rates from 1990 to 2003 in people defined as disabled by social class (four groupings).
The disparity between employment rates for people in the highest socioeconomic class groups (I and II) compared with the lowest socioeconomic classes (IV and V) was considerably greater for the disabled than for the not disabled for all the GHSs (fig 2). Since the DDA, employment rates do not seem to have changed for socioeconomic classes I and II and have slightly increased for socioeconomic classes IIIN and IIIM. However, for socioeconomic classes IV and V, it is evident that employment rates have actually declined. This has led to a greater gap in employment rates between those in the lowest socioeconomic group than those in all other socioeconomic groups since the DDA.
Table 1 shows the results from the analyses of covariance estimating the effect of the DDA on employment rates in the disabled by socioeconomic class. The first model estimated the overall affect of the DDA on employment rates in the disabled, adjusting for year of the GHS and socioeconomic class group. People defined as disabled had a significantly lower employment rate, approximately 21% (95% CI 18.4% to 23.9%) lower, on average, than those defined as not disabled over the 14-year analysis period. A significantly negative interaction was identified between disability status and the DDA in relation to standardised employment rate. The mean employment rate decreased, on average, by a further 7% (95% CI 2.5% to 11%) after the DDA.
Analyses of covariance showing effect of (1) the Disability Discrimination Act (DDA); (2) being defined as “disabled”; and (3) the interaction between disability and the DDA on employment rate (overall and by social class)
Four additional models were created (table 1) after stratifying the analysis by the socioeconomic class groupings (I and II, IIIN, IIIM and IV and V). Although, as would be expected, disabled people had a significantly lower average employment rate than not disabled people for all socioeconomic class groups, the difference in employment rates increased in a linear fashion with decreasing socioeconomic class. For socioeconomic classes I and II, employment rates for disabled people were, on average, 14.9% (95% CI 11.1% to 18.6%) lower than for not-disabled people, increasing to 26.3% (95% CI 23.3% to 29.2%) lower employment rates in socioeconomic classes IV and V. The extent to which the DDA influenced the disparity between employment rates of disabled and not disabled individuals was strongly related to the socioeconomic class (table 1, fig 3). The interaction term including disability and DDA was not significantly associated with employment rate for socioeconomic classes I and II. However, a significant interaction was identified in socioeconomic class IIIN such that employment rates in the disabled decreased by 5.2% (95% CI 0.2% to 10.2%) after the DDA. The observed reduction in employment rates for disabled people associated with the DDA was even greater for socioeconomic class IIIM (an average reduction of 8.4%; 95% CI 2.8% to 13.9%) and was greatest for socioeconomic classes IV and V (an average reduction of 10.7%; 95% CI 6.2% to 15.2%).

Percentage change in age-standardised employment rate in individuals defined as disabled after implementation of the Disability Discrimination Act (DDA). The figure shows parameter estimates and confidence intervals for the interaction terms disability×DDA from the analyses of covariance (after adjustment for disability, DDA and year).
DISCUSSION
The results in this paper reinforce that in the UK there are large socioeconomic inequalities in the employment consequences of ill health and disability.4 People with a disability or an LLTI in socioeconomic classes I and II have consistently higher employment rates than those in other socioeconomic classes. Furthermore, the difference between the employment rates of people with a disability or an LLTI in classes I and II, and those of their not disabled peers is smaller than that between disabled and non-disabled people in other socioeconomic classes. In addition, our research suggests that public policy, in the form of the DDA, was unable to reduce these inequalities. Indeed, the data suggest that the gap between the employment rates of people with a disability or an LLTI in classes I and II and those in classes III, IV and V increased in the period after the implementation of the legislation.
The difference in the employment rates of socioeconomic classes may be a byproduct of the types of work (manual vs non-manual employment) carried out. However, although this might explain the overall inequality between classes, it does not address the increased inequity after the introduction of the DDA. We cautiously suggest the following explanations for the observed change.
Firstly, research has suggested that many employers are fearful of the possible enhanced recruitment and retention costs incurred as a result of the legislation.24 Even standardised costs may well be a disproportionately higher amount of the wage bill for lower socioeconomic occupations than for classes I and II. Furthermore, the skills of employees in socioeconomic classes I and II may be seen to outweigh the costs incurred.
Secondly, the emphasis in the legislation is very much on the individual person with a disability or an LLTI to assert their DDA employment rights in order to gain or retain employment. They are required to show that they are (1) disabled under the terms of the Act and (2) that they were discriminated against on this basis.16–18 It is highly possible that people in classes I and II are more aware and articulate about such rights. Similarly, employers of professional groups may be more aware of the DDA and its ramifications for their employment practice.
Finally, evidence suggests that awareness of the DDA is low among UK employers15,24: in a recent study carried out on behalf of the Department of Work and Pensions, only 63% of employers were aware of the DDA, 33% considered that employing a person with a disability or an LLTI was a major risk and 47% did not think that they would retain a worker who developed a disability or an LLTI.24
Regardless of the reasons, the findings of this study will add further weight to existing criticisms levied against the DDA by both academics and disability activists.16–19
Limitations
One limitation of this analysis is the reliance on self-reported health and employment status. Self-reports can be subject to some inaccuracy.25 Another issue is disability, which can be defined in different ways.6,8 We used the GHS definition relating to a long-term illness or disability (box 2), which unfortunately does not fully incorporate the more specific DDA definition (box 1). However, we previously demonstrated that the GHS definition of disability was comparable to the DDA definition.11 Furthermore, it has only been possible to examine the short-term effects of the DDA (from 1998 to 2003) on employment rates. It is possible that over the longer term, the trend identified might change. Perhaps the most important limitation though is that the study utilises a cross-sectional survey, which means that it has not been possible to track the effect of the DDA on individuals.
What is already known
-
Ill health and disability are often associated negatively with poverty, social exclusion and lower employment rates.
-
These adverse social and economic consequences are not evenly distributed across socioeconomic groups.
-
Public policy interventions could ameliorate these consequences.
What this study adds
-
This is the first study to examine the impacts of an anti-discrimination public policy intervention on inequalities in the employment consequences of ill health and disability.
-
Socioeconomic inequality in employment seemed to increase after the implementation of anti-discrimination legislation.
-
On its own, anti-discriminatory legislation does not overcome the adverse employment consequences of ill health and disability, nor are inequalities reduced.
Policy implications
-
Anti-discriminatory legislation is not an effective way of overcoming the adverse employment consequences of ill health and disability. Nor is it a particularly useful policy tool in terms of reducing inequalities.
-
If such consequences and inequalities are to be addressed in the near future, policy makers will need to strengthen and enforce existing anti-discrimination legislation, educate employers or implement other types of more targeted and active employment interventions.
CONCLUSION
This paper has examined differences in the employment consequences of disability or LLTI before and after the implementation of the DDA. We have shown that pre-existing socioeconomic class inequalities in the employment rates of people with an LLTI or a disability increased after the DDA. People with a disability or LLTI in socioeconomic classes I and II were more likely to be employed than their counterparts in classes III, IV and V both before and after the DDA. The anti-discrimination legislation was therefore not effective in the short term in closing the gap, and in fact it would seem that it has exacerbated pre-existing inequalities in the social and economic consequences of ill health and disability. Our research suggests therefore that anti-discriminatory legislation, at least in the UK context, may not be the most effective way of overcoming the social consequences of ill health and disability, nor a particularly useful policy tool in terms of reducing inequalities. It seems likely that additional legislation, or concurrent public policy interventions such as the more active labour market programmes of Sweden,4,9,10 are required if such inequalities are to be addressed in the near future.
Acknowledgments
We thank the UK Data Archive for access to data from the General Household Surveys.
REFERENCES
Footnotes
-
Competing interests: None declared.
Linked Articles
- In this issue