Article Text

Abstract
Study objectives: To investigate the strength of the relation between the amount of green space in people’s living environment and their perceived general health. This relation is analysed for different age and socioeconomic groups. Furthermore, it is analysed separately for urban and more rural areas, because the strength of the relation was expected to vary with urbanity.
Design: The study includes 250 782 people registered with 104 general practices who filled in a self administered form on sociodemographic background and perceived general health. The percentage of green space (urban green space, agricultural space, natural green space) within a one kilometre and three kilometre radius around the postal code coordinates was calculated for each household.
Methods: Multilevel logistic regression analyses were performed at three levels—that is, individual level, family level, and practice level—controlled for sociodemographic characteristics.
Main results: The percentage of green space inside a one kilometre and a three kilometre radius had a significant relation to perceived general health. The relation was generally present at all degrees of urbanity. The overall relation is somewhat stronger for lower socioeconomic groups. Elderly, youth, and secondary educated people in large cities seem to benefit more from presence of green areas in their living environment than other groups in large cities.
Conclusions: This research shows that the percentage of green space in people’s living environment has a positive association with the perceived general health of residents. Green space seems to be more than just a luxury and consequently the development of green space should be allocated a more central position in spatial planning policy.
- green space
- environment
- perceived general health
- urbanity
Statistics from Altmetric.com
Many people experience nature as an environment where they can rest and recover from daily stress. In the hectic society in which we live there is a growing need for nature as a source of relaxation and recreation.1 But the enjoyment of nature is not obvious anymore. Urban areas have recently experienced a decline in the quality and quantity of their green space.2,3 The United Nations Population Division notes that, although just under half of the world’s current population lives in urban areas, nearly two thirds of the world’s populations will live in urban areas within the next 30 years.4
Because of increasing urbanisation, combined with a spatial planning policy of densification, more people face the prospect of living in residential environments with fewer green resources. Especially people from low socioeconomic groups without resources to move to greener areas outside the cities will be affected. This may lead to environmental injustice with regard to the distribution of (access to) public green spaces.
Although notions of the beneficial effects of nearby green space have persisted throughout history,5–7 these notions have only recently been substantiated in controlled, experimental research.8 Research has focused mainly on showing the relation between exposure to green environments and wellbeing.9
There are only a few epidemiological studies on the relation between nature and health. An epidemiological study performed in the Netherlands by our group showed that residents of neighbourhoods with abundant green space tend, on average, to enjoy better general health. This positive link was found to be most apparent among the elderly, housewives, and people from lower socioeconomic groups.1,10 A Japanese longitudinal study showed that living in a neighbourhood with comparatively plentiful walkable green space correlated with a lower mortality risk.1,11
Outside these studies, little is known about the strength of the relation between nearby green space and health. This is also shown by a recent report from the Health Council of the Netherlands,1 which concludes that there are important lacunas in current knowledge about the relation between green space and health and the mechanisms underlying this relation. In this study we attempt to fill up the lacunas in current knowledge about the strength of the relation between green space and health.
The aim of this study was to investigate the strength of the relation between the amount of green space in people’s living environments and perceived general health.
The relation was analysed separately for different socioeconomic groups and different age groups, because it is hypothesised that the relation is likely to be stronger for groups that spend more time in the vicinity of their homes: youth and the elderly as compared with adults, and people with a lower socioeconomic status (SES) as compared with people with a high SES.
Furthermore, the relation was analysed for urban and more rural areas separately, because it was expected that the strength of the relation might vary with urbanity. It has long been known that health differs between urban and rural areas. These differences are often ascribed to factors such as pollution and lifestyles that covary with urbanicity and with selective migration.12,13 But these urban-rural differences in health have seldom been related to the amount of green space in the environment.
METHODS
Population
The data were derived from two different datasets that were combined for this study. The health data originate from the second Dutch national survey of general practice (DNSGP-214). The GPs and patients in this survey are representative of the Dutch population. The practice population from 104 general practices in the Netherlands filled out a one page self administered questionnaire on sociodemographic background and perceived general health (n = 480 000, response 76.5%). Each person in the Netherlands is registered with a GP.
Environmental data were derived from the National Land Cover Classification database (LGN4), which contains the dominant type of land use of each 25 × 25 metre grid cell in the whole of the Netherlands.15
The two datasets were matched on the basis of x and y coordinates of the respondent’s six character postal code. The percentage of green space within a 1 km radius as well as within a 3 km radius was calculated around these coordinates.
A selection was made on the basis of the assumption that it would take some time for a new living environment to affect a person’s health. As a consequence, we only included respondents who had been registered with their current GP for longer than 12 months, thus excluding respondents with a high chance of having moved recently, partly because they might suffer from stress related to moving.
After this selection, 250 782 respondents remained with valid values on all of the relevant variables.
Perceived general health
Perceived general health was self rated by respondents by replying to the following statement: “In general, would you say that your health is…”
They could respond by one of the following categories: very good/good/neither good nor poor/poor/very poor. The scores were dichotomised, with “neither good nor poor” (0) as the cut off point. This kind of operationalisation has shown to be valid and predictive of health indicators in numerous studies.16,17
Characteristics of respondents’ living environment
The information on the environmental characteristics was derived from the LGN4 database. The total percentage of green space in the respondents’ living environment was measured within a 1 km radius and within a 3 km radius around a respondent’s home, to see whether green space close by has a stronger or weaker effect than green space further away. The total percentage of green space includes all urban green, agricultural green, forests, and nature conservation areas.
To discover which types of natural surroundings are particularly good for people’s subjective health, we calculated the percentages of the following categories inside both a 1 km and a 3 km radius—that is, the percentage of agricultural green, the percentage of natural green (forests, peat grassland, etc), and the percentage of urban green.
Urbanity
Another environmental characteristic is urbanity. This variable consists of five categories ranging from very strongly urban (1) to non-urban (5), and was measured at municipal level. The indicator is based on the number of households per square km and is widely used in the Netherlands.18
Demographic and socioeconomic characteristics
Part of the effect of green space on health may be the result of direct or indirect selection. Direct selection takes place when people’s health influences their chances of living in a favourable environment. Indirect selection takes place when people with certain characteristics related to wellbeing (such as income) can afford to live in a favourable environment.12 Migration flows are related to such sociodemographic characteristics as age, income, and education.19 It is important when analysing the strength of the relation, to take the possibility of selection into account and to control for this.
We tried to rule out these selection effects by controlling statistically for relevant demographic and socioeconomic characteristics.
The demographic characteristics taken into account were sex (female = 1) and age (in years).
SES was measured by the highest level of completed education, the work situation, and ethnicity. In addition, SES was also measured by type of health insurance (public = 0, private = 1), because the type of health insurance can be regarded as an indicator of SES in the Dutch context.
When testing the effect of green space for different SES groups, SES was operationalised as the level of education and was divided into three categories—that is, higher education (university or higher education), secondary education, and no/primary education.
Statistical analyses
The relation between nature and health was assessed by multilevel logistic regression analyses, controlling for sociodemographic characteristics. The logistic multilevel analysis was performed with MlwiN. We included three levels—individuals, family, and practices. These three levels were included because of the structure of the data within DNSGP-2 and also because families and practices could influence the health of the person. Because we wanted to compare the effects for different subgroups we used interaction effects between the subgroup variable and the green indicator.
RESULTS
The strength of the relation between green space and health
The basic model includes all socioeconomic and demographic characteristics. In the second model urbanity is added, and one of the percentages of green space in the living environment is added in the third model (see table 1).
Regression analysis of the total sample (n = 250782) for perceived general health: parameters and standard errors
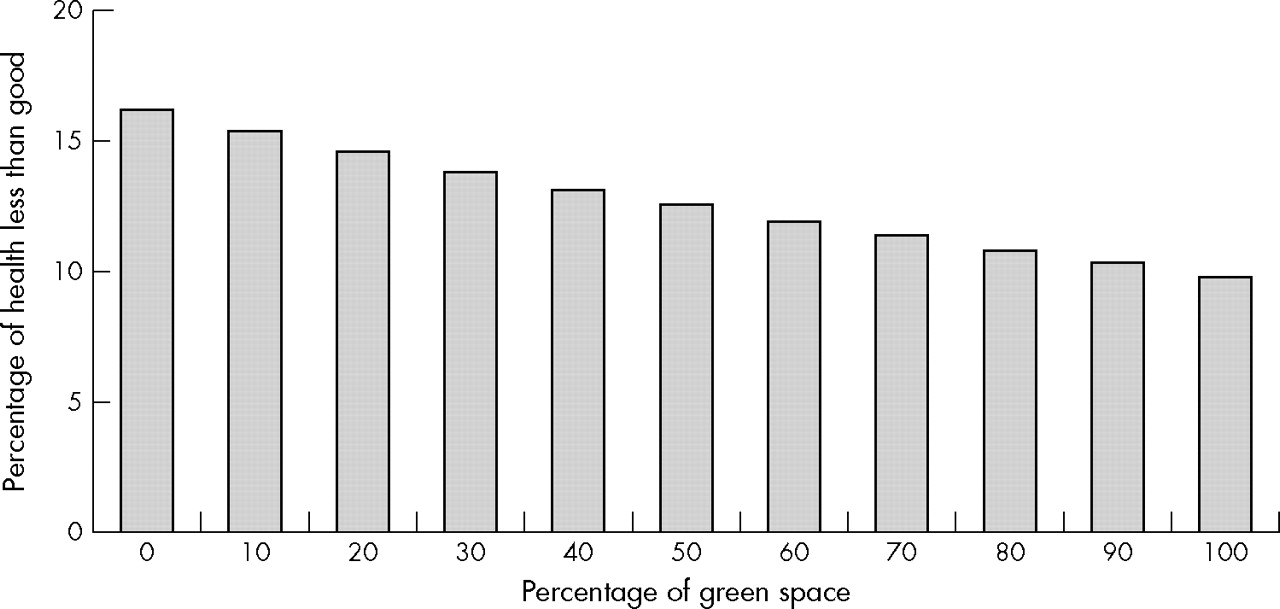
Given the other parameters in the model, perceived general health seems to be better in people living in a greener environment (see table 1, step 3a, step 3b). Figure 1 shows that the relation between green space and health is considerable. In areas where 90% of the environment around the home is green, only 10.2% of the residents feel unhealthy, as compared with areas in which 10% of the environment is green, where 15.5% of the residents feel unhealthy. The relation is equally strong for the 1 km and the 3 km radius.

Relation between amount of green space (in a 3 km radius) and self perceived health (percentage stating their health is less than good) based on the logistic multilevel model of table 1, step 3b (controlling for urbanity, sociodemographic, and socioeconomic characteristics).
We also analysed the relation between health and different types of green space (not in table). These analysis show that there seems to be a positive relation between perceived general health and both agricultural green (1 km: β = 0.004, SE = 0.000/3 km: β = 0.004, SE = 0.001) and natural green (1 km: β = 0.004, SE = 0.001/3 km: β = 0.006, SE = 0.001) in a person’s living environment. Urban green within a 3 km radius around the home seems to be negatively related to people’s health (β = −0.008, SE = 0.002), which is caused by the fact that urban green can only be found in urban areas that have a lower total amount of green space.
Urbanity, health, and green space
Table 1 (step 2) shows that urbanity makes a significant contribution to perceived general health, given respondents’ demographic and socioeconomic characteristics. The perceived general health of people living in less urban areas tends to be better.
The addition of one of the percentages of green space renders the very strongly and strongly urban areas insignificant (table 1; step 3a, 3b). This illustrates the high (negative) correlations between amount of green space and degree of urbanity. It also shows that the amount of green space is more strongly related to perceived general health than the degree of urbanity is.
This suggests that the amount of green space may have an independent effect on people’s health at all degrees of urbanity. If this were true, the health effects of green space should also occur when the different degrees of urbanity are examined separately.
Table 2 shows that the effects of green space are apparent in all degrees of urbanity, although in the very strongly urban areas only green space within a 3 km radius around the home is related to perceived general health. Where the type of green space is concerned, the amount of agricultural green is in all degrees of urbanity most consistent with perceived general health (not in table). Urban green in a 3 km radius is negatively related to people’s health in all degrees of urbanity (not in table). This is probably caused by the fact that people who have a lot of urban green space nearby, are living at the edge of their municipality (or in a small municipality) and close to stronger urban municipalities; their own municipality itself is unlikely to contain much urban green space. This is supported by the fact that the amount of urban green space is negatively related to the total amount of green space within 3 km.
Regression analysis for perceived general health by level of urbanity modelled as interaction effects and controlled for sociodemographic and socioeconomic characteristics: parameter and standard error
To further investigate the strength of the relation between green space and health, we tested the impact of a green environment on the perceived general health of people with different SES and people in different age groups.
Effect of a more natural environment on people who differ in SES
A greener environment seemed to have a significant beneficial effect in all education groups. People with a secondary education level benefit most from green space (table 3; step 1 and step 2).
Regression analysis for perceived general health by level of education (high, secondary, or no/primary) modelled as interaction effects and controlled for urbanity, sociodemographic, and socioeconomic characteristics: parameter values and standard errors
Analyses (see table 4) for the different education groups in the different degrees of urbanity show that a greener environment is only related to health in all degrees of urbanity for people with a secondary level of education. People who are highly educated only benefit from green space in strongly and moderately (only just significant within a 1 km radius) urban areas.
Regression analysis for perceived general health by level of urbanity and level of education (high, secondary, no/primary) modelled as interaction effects and controlled for sociodemographic and socioeconomic characteristics: parameter and standard error
The analyses suggest that the lower educated groups are more sensitive to the physical environmental characteristics.
Effect of a more natural environment by age
Analyses of the effects of green space in the different age groups (youth: 0–24, adults: 25–64, elderly: 65 or older) show that the health of all age groups benefit significantly from green space (see table 5). The self perceived health of all age groups is better when there is more green space.
Regression analysis for perceived general health by age (youth, adults, elderly) modelled as interaction effects and controlled for urbanity, sociodemographic and socioeconomic characteristics: parameter values and standard errors
When the effects of the amount of green space are analysed for different age groups in the different degrees of urbanity, it seems that the relation is most consistent for the elderly (see table 6). The elderly benefit from green space in all urban areas. Only the elderly and the youth seem to benefit from green space in very strongly urban areas. This relation is stronger for green space within a 1 km radius.
Regression analysis for perceived general health by level of urbanity and by age (youth, adults, elderly) modelled as interaction effects and controlled for sociodemographic and socioeconomic characteristics: parameter and standard error
In the strongly, moderately and slightly urban areas all age groups benefit from green space.
DISCUSSION
Statement of principal findings
The percentage of green space in people’s living environment showed a positive association with the perceived general health of residents. People with a greener environment within a 1 km or 3 km radius around their homes have better self perceived health than people living in a less green environment. The effects inside a 1 km or 3 km radius were equally strong, and it is only in the very strongly urban areas that the proximity of green space becomes more important. The amount of agricultural and natural green in the living environment was positively related to perceived general health. As figure 1 shows, the relation between green space and health is considerable.
We hypothesised that the relation between green space and health would be stronger for people who are assumed to spend more time in the vicinity of their homes. This study shows that this hypothesis can be corroborated; the relation between green space and health is stronger for people with a lower SES as compared with people with a high SES, and is stronger for youth and elderly compared with adults.
Our analyses show that health differences in residents of urban and rural municipalities are to a large extent explained by the amount of green space. The coefficients of urbanity are strongly reduced and no longer significant when the amount of green space is taken into account. The effect of the amount of green in urban and rural areas was not taken into account in previous research on the relation between urbanity and health. Our analyses show that green space is important in explaining the health differences between urban and rural residents. Furthermore, the analyses show that the amount of green space is more strongly related to perceived general health than urbanity.
The fact that the relation was found at all levels is an indicator of the general character of the relation. The Netherlands is a very densely populated country and this might affect the generalisation of our results to other countries. On the other hand, the fact that we found the relation at different levels of urbanity (which is measured as address density) suggests that the relation would also be found in less densely populated countries.
What is already known on this subject
Small scale psychological research has shown that exposure to green space has a positive effect on stress reduction and attention restoration. Two comparatively small epidemiological studies have shown that green space is positively correlated with self perceived health, number of symptoms experienced, and mortality risk.
What this study adds
This study uses a large recent dataset and confirms what has been found in small scale research. But it goes further, by investigating the differences between urban and rural areas. The health differences between urban and rural residents can be partly explained by the amount of green in their direct living environment. The study also emphasises the importance of green space for all age groups and lower socioeconomic groups in particular.
Strengths and weaknesses of the study
This is the first epidemiological study to use such a large dataset. The health data and the land use data were derived from different databases and there is no single source bias as a consequence.
The observed effects of green space on health could be caused by selection effects. We tried to rule out this possibility by taking the socioeconomic and demographic characteristics into account, but—given the correlational nature of the data—the effects of selection cannot be ruled out completely. The subgroup analysis by SES groups, however, makes selection mechanisms related to SES rather unlikely. The relation seen between green space and health was stronger for the less educated group and this is exactly the subgroup that is less likely to have much choice in their neighbourhood of residence. Our results may be influenced by selective migration based on people’s health; healthy people might choose to live in greener environments. However, it is impossible to control for direct selection on the dependent variable in a cross sectional study design. Most of the results found in this study correspond with the results of our earlier study, but there are a few differences. In our earlier study we did not find an effect for green space in the more urban areas. Furthermore, no significant effect was found in the young age group.9
Policy implications
This research has shown that green space is more than just a luxury, and the development of green space should therefore be allocated a more central position in spatial planning policy. Healthy planning should include a place for green space and policy makers should take the amount of green space in the living environment into account when endeavouring to improve the health situation of the elderly, the youth, and lower socioeconomic status groups, especially in urban environments.
Possible mechanisms and implications for policy makers
This research has shown that the presence of green space in people’s living environment has an important effect on health. The causes of this effect remain unknown, however. As stated above, previous research has mainly focused on showing the relation between exposure to green environments and wellbeing.9,20 The dominant theories in the field all consider stress reduction and attention restoration as a central causal mechanism.20,21
Very little is known about the (additional) positive effects of green space on wellbeing through mechanisms of increased and prolonged physical activity,22–24and improved social cohesion.25,26 Further research is needed to give more insight into the mechanisms behind the relation between green space and health.
This research has shown that green space is more than just a luxury, and the development of green space should therefore be allocated a more central position in spatial planning policy. Healthy planning should include a place for green space and policy makers should take the amount of green space in the living environment into account when endeavouring to improve the health situation of the elderly, the youth, and lower SES groups, especially in urban environments.
REFERENCES
Footnotes
-
Funding: this study was supported by a grant from the Netherlands Organisation for Scientific Research
-
Conflicts of interest: none declared.
Linked Articles
- In this issue