Article Text

Abstract
Background Socioeconomic status (SES) at the individual level is associated with hypertension risk. Less is known about neighbourhood level SES or how neighbourhood and individual level SES may jointly affect hypertension risk.
Methods The Area Deprivation Index (ADI) includes 17 census-based measures reflecting neighbourhood SES. The ADI was linked to enrolment addresses of 47 329 women in the Sister Study cohort and categorised as ≤10% (low deprivation), 11%–20%, 21%–35%, 36%–55% and >55% (high deprivation). Hypertension was defined as either high systolic (≥140 mm Hg) or diastolic (≥90 mm Hg) blood pressure or taking antihypertensive medication. We used log binomial regression to investigate the cross-sectional association between ADI and hypertension and evaluated interactions between ADI and race/ethnicity and between ADI and individual SES.
Results The highest ADI level of >55% was associated with increased prevalence of hypertension, compared with the lowest level of ADI≤10%, in a model adjusted for age, race/ethnicity, educational attainment and annual household income (prevalence ratio=1.26, 95% CI 1.21 to 1.32). We observed interaction between race/ethnicity and ADI (interaction contrast ratio (ICR)=1.9; 95% CI 0.94 to 2.8 comparing non-Hispanic Black women with ADI >55% to non-Hispanic White women with ADI≤10%) and between household income and ADI (ICR 0.38; 95% CI 0.12 to 0.65 comparing participants with household income ≤US$49 999 and ADI>55% to those with household income >US$100 000 and ADI≤10%).
Conclusions These findings suggest that neighbourhood deprivation measured by ADI may be a risk factor for hypertension and that ADI may act synergistically with race/ethnicity and individual household income to contribute to hypertension.
- blood pressure
- hypertension
- neighborhood/place
Data availability statement
Data are available on reasonable request. Data and code are available for replication upon request (www.sisterstudy.niehs.nih.gov).
This is an open access article distributed in accordance with the Creative Commons Attribution Non Commercial (CC BY-NC 4.0) license, which permits others to distribute, remix, adapt, build upon this work non-commercially, and license their derivative works on different terms, provided the original work is properly cited, appropriate credit is given, any changes made indicated, and the use is non-commercial. See: http://creativecommons.org/licenses/by-nc/4.0/.
Statistics from Altmetric.com
Introduction
Hypertension is the most common risk factor for cardiovascular diseases, including ischaemic and haemorrhagic stroke and heart disease,1 and is a leading risk factor for disability.2 It is predicted that there will be 1.56 billion adults with hypertension in 2025.3 Hypertension is defined as high systolic blood pressure (SBP) or diastolic blood pressure (DBP).4 Blood pressure includes a pulsatile component, pulse pressure and a steady component, mean arterial pressure.5 Widening pulse pressure and elevated mean arterial pressure are also predictors of cardiovascular disease.6 7
Individual socioeconomic status (SES), commonly estimated by factors such as income level and educational attainment, may influence hypertension risk. Lower levels of educational attainment and household income have been shown to be related to higher prevalence of hypertension and higher mean blood pressure.8–10 The prevalence of hypertension varies greatly across racial/ethnic groups, with a higher prevalence among persons characterised as non-Hispanic Black (40.3%) than among those characterised as non-Hispanic White (27.8%) or Hispanic/Latino (27.8%),11 which may be due in large part to differential frequencies of known environmental and social risk factors.12
Neighbourhood environment could also contribute to health disparities by SES and race/ethnicity due to a legacy of residential segregation due to historical and structural racism in the USA.13 Recently, the US Department of Health and Human Services released a report suggesting that neighbourhood-level strategies are needed to help prevent and control hypertension.14 Some epidemiological studies show that people living in neighbourhoods with low SES have a higher risk of hypertension and higher blood pressure,15 16 but more research is needed, including investigations of how the impact of neighbourhood conditions on health can be modified by individual SES or race/ethnicity.
In this study, we evaluated two main hypotheses. The first was that women living in more deprived neighbourhoods would have a higher risk of hypertension. The second was that the relationship between neighbourhood deprivation and hypertension would differ according to individual factors such as race/ethnicity and SES.
Methods
Study population
The Sister Study is a prospective cohort study of 50 884 US women aged 35–74 designed to study the relationship between environmental factors and some chronic diseases.17 At enrolment (2003–2009), information on demographic characteristics, SES, antihypertensive medication use and lifestyle was collected through a computer-assisted telephone interview by trained interviewers.17 Participants additionally completed self-administered food frequency questionnaires for diet in the past 12 months. During a baseline home visit, trained examiners measured height, weight and blood pressure (measured three consecutive times after participants rested for a few minutes) following standardised protocols.17 18 The data used in this report were from Sister Study Data Release 8.1. All participants provided written consent.
Area Deprivation Index
We used Area Deprivation Index (ADI) to characterise neighbourhood deprivation. ADI was constructed based on 17 weighted US census income, educational attainment, employment and housing indicators (eg, unemployment rate and median home value) obtained from the American Community Survey.19–22 Each neighbourhood received a percentile ranking, with a higher percentage of ADI indicating a higher level of deprivation.20 The 2000 ADI rankings were linked to each participants’ enrolment residential address using Census block-group identification codes. Participants were divided into five groups based on approximate ADI quintiles within the cohort.
Blood pressure and hypertension
For both SBP and DBP, we used the average of the second and third blood pressure measurements. The second measurement was used when there were only two measurements, and the single measurement was used when there was only one measurement (<2%). Hypertension was defined as follows: (1) either high SBP (≥140 mm Hg) or high DBP (≥90 mm Hg); or (2) currently taking antihypertensive medication. When considering continuous blood pressure as the outcome variable or as parameters to calculate pulse pressure and mean arterial pressure, we added 15 mm Hg to the measured SBP of those who reported taking antihypertensive medication and 10 mm Hg to their measured DBP. Correcting measured blood pressure by adding a constant allows for inclusion of the entire sample and reduces bias.23 We selected 15 mm Hg for SBP and 10 mm Hg for DBP based on a meta-analysis of the blood pressure improvement under different treatment regimens.24 Pulse pressure was calculated as SBP minus DBP.25 Mean arterial pressure was calculated as 1/3(SBP) plus 2/3(DBP).25
Covariates and potential effect modifiers
Age, race/ethnicity, highest educational attainment and annual household income at enrolment were included as covariates in statistical models. Race and ethnicity were self-reported and considered to represent lived experience and not genetic factors. We combined data on self-reported race and Hispanic ethnicity to categorise race/ethnicity as non-Hispanic White, non-Hispanic Black, Hispanic and other. Body mass index (BMI) was calculated as a person’s weight in kilograms divided by the square of the person’s height in metres, and participants with BMI≥30 were defined as obese.26 We used metabolic equivalent task (MET)-hours for exercise/sports to represent participants’ level of physical activity. MET-hours of physical activity considers not only hours spent on exercise/sports but also intensity.27 Dietary Approaches to Stop Hypertension (DASH) diet score was calculated to represent participants’ dietary habits.28 We also considered effect modification by BMI, MET-hours and DASH diet score in stratified analyses.
Statistical analysis
In this cross-sectional analysis, we included 47 329 participants who had baseline blood pressure measurements, information on antihypertensive medication use, national ADI ranking and all the covariates. We used multivariable log binomial regression to investigate the cross-sectional relationship between ADI and hypertension, with hypertension considered as a binary outcome and approximate study-specific quintiles of ADI as a categorical exposure variable (first quintile as referent). We used two models, one model was age-adjusted and the other model was adjusted for age, race/ethnicity, educational attainment and household income level. Prevalence ratios (PRs) and 95% confidence intervals (CIs) were estimated for the overall population and for subgroups stratified by race/ethnicity, educational attainment, household income level, BMI and MET-hours of physical activity. We also estimated the PRs using a common referent (the group that had the lowest values for ADI and the other variable of interest) in stratified analysis. We fit the median of each quintile group as a continuous variable in models for trend tests. Interaction terms were added into the model to explore multiplicative interaction, and relative excess risk due to interaction (RERI)/interaction contrast ratio (ICR) was calculated to estimate additive interaction.29 We used multivariable general linear regression to explore the relationship between ADI and blood pressure, pulse pressure and mean arterial pressure after adjusting for age, race/ethnicity, annual household income and educational attainment.
We conducted the following sensitivity analyses: (1) excluding participants who began living at their current residence after 2000, because the ADI used in this study was based on 2000 US census and American Community Survey data which represents average measures for the 5 years up to and including 2000; (2) additionally adjusting for DASH diet score to evaluate whether dietary pattern changed the results; (3) using the updated definition of hypertension (either SBP ≥130 mm Hg or DBP ≥80 mm Hg) released by the American College of Cardiology and the American Heart Association in 2017.4 We used the older definition of hypertension in our main analyses because at enrolment participants were treated under the older guideline. Analysis was done using SAS V.9.4 software (SAS Institution, Inc., Cary, NC).
Results
Among the 47 329 participants included in our study, participants living in neighbourhoods with a higher ADI were more likely to be categorised as non-Hispanic Black race/ethnicity, to be obese, and to report lower levels of educational attainment and household income. They also had higher prevalence of hypertension and higher levels of blood pressure, higher levels of pulse pressure and higher levels of mean arterial pressure (table 1).
Characteristics of Sister Study participants according to Area Deprivation Index (ADI) (n=47 329) (N (%) or mean (SD))
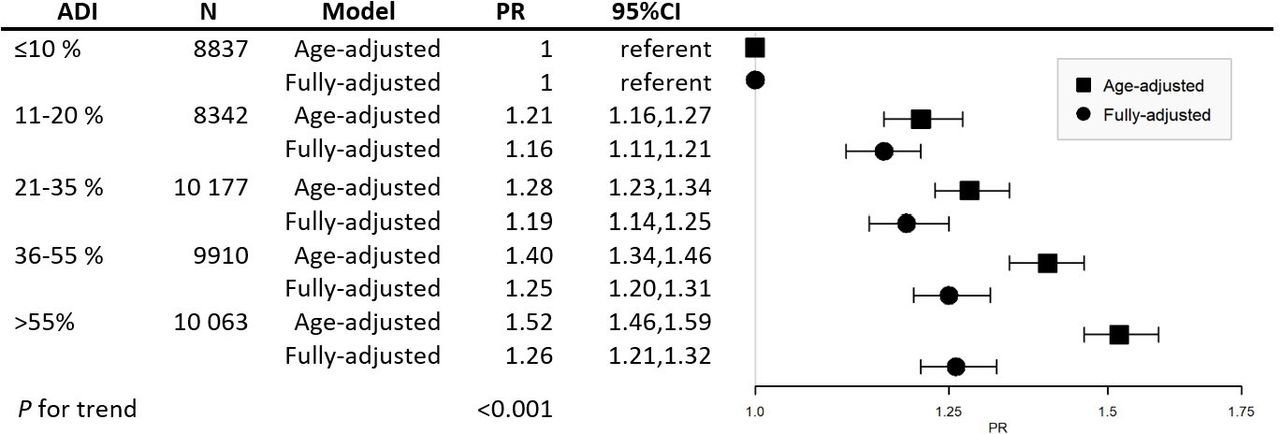
Figure 1 shows the association between ADI and hypertension. When only adjusted for age, hypertension was more common among those with ADI 11%–20% (PR=1.21, 95% CI=1.16 to 1.27), 21%–35% (PR=1.28, 95% CI=1.23 to 1.34), 36%–55% (PR=1.40, 95% CI=1.34 to 1.46) and >55% (PR=1.52, 95% CI=1.46 to 1.59), relative to those with ADI ≤10% (P trend <0.001). Patterns were similar, though attenuated, after additionally adjusting for race/ethnicity, educational attainment and annual household income: PR=1.16 (95% CI=1.11 to 1.21) for ADI 11%–20%, PR=1.19 (95% CI=1.14 to 1.25) for ADI 21%–35%, PR=1.25 (95% CI=1.20 to 1.31) for ADI 36%–55% and PR=1.26 (95% CI=1.21 to 1.32) for ADI >55%, all relative to those with ADI ≤10% (P trend <0.001).

Area Deprivation Index (ADI) and Risk of Hypertension in the Sister Study (n=47 329). Fully adjusted model was adjusted for age, race/ethnicity, educational attainment and household income. High ADI represents high deprivation. PR, prevalence ratio; CI, confidence interval.
After stratifying by race/ethnicity, educational attainment, annual household income, BMI and exercise or sports MET-hours the prevalence of hypertension was still positively associated with ADI in most strata (figure 2, online supplemental table S1). We observed an interaction between race/ethnicity and ADI (online supplemental table S1, P<0.001). When using a common referent (non-Hispanic white participants living in ADI neighbourhoods≤10%) (online supplemental table S2, figure S1A), non-Hispanic Black participants had a higher prevalence of hypertension at each level of ADI. In table S3 (online supplemental table S3), compared with non-Hispanic White participants living in ≤10% ADI areas, the RERI/ICR indicates that the PR for non-Hispanic Black participants living in areas with ADI 21%–35% was 1.1 (95% CI 0.34 to 1.9) more than if there had been no interaction. Compared with non-Hispanic White participants living in ≤10% ADI, RERI/ICR was 1.3 (95% CI 0.45 to 2.1) and 1.9 (95% CI 0.94 to 2.8) for non-Hispanic Black participants living in areas with ADI 36%–55% and >55%, respectively (online supplemental table S3). In the analyses stratified by income, participants with a lower level of household income living in more deprived neighbourhoods had a higher prevalence of hypertension than those with income ≥US$100 000 living in ADI ≤10% neighbourhood (online supplemental table S2, figure S1B), with an additive interaction. RERI/ICR was 0.38 (95% CI 0.12 to 0.65) for those with a household income ≤$49 999 and ADI >55% (online supplemental table S3). Similar though less pronounced patterns were seen for educational attainment (online supplemental figure S1C). The prevalence of hypertension for participants with BMI <30 was higher comparing those with high ADI to those with low ADI (P trend <0.001), but not so obvious for those with BMI ≥30 (P trend=0.03, P interaction <0.001 (online supplemental table S1).
Supplemental material

Stratified Analysis of the Association Between Area Deprivation Index (ADI) and Hypertension in the Sister Study. PR comparing ADI 55% to ADI ≤10%. Full details in online supplemental table S1. Results shown are from fully adjusted models (not including the stratification variable). High ADI represents high deprivation. Race/ethnicity of others include non-Hispanic Asian/Pacific Islanders, non-Hispanic American Indians and non-Hispanic other. BMI, body mass index; PR, prevalence ratio; CI, confidence interval.
Online supplemental table S4 shows the distribution of physical activity and diet scores in different ADI groups. Participants living in more deprived areas tended to have fewer exercise or sports MET-hours and tended to have lower diet scores representing poorer diet quality. When stratified by physical activity, the PR for hypertension among those living in the most deprived neighbourhoods (ADI>55%) who reported ≥15 exercise/sports MET-hours (PR 1.4; 95% CI 1.29 to 1.51) was substantially lower than that for participants with the lowest level of ADI (≤10%) but reporting <5 exercise/sports MET-hours per week (PR 1.57, 95% CI 1.45 to 1.71) (online supplemental table S2). In the sensitivity analyses excluding participants who began living at their enrolment residence after 2000, additionally adjusting for DASH diet score, and using the updated definition of hypertension, results were largely unchanged (online supplemental table S5). We also repeated the analysis in participants who had lived at their current residence for more than 10 years, which would partly capture potential effects of duration of residence, and the results remained the same (data not shown).
In analyses of continuous blood pressure indicators, comparing participants with ADI>55% to those with ADI≤10%, SBP (β=3.5, 95% CI=3.0 to 3.9), DBP (β=1.6; 95% CI=1.3 to 2.0, P for trend <0.001), pulse pressure (β=1.8; 95% CI=1.5 to 2.1, P for trend <0.001) and mean arterial pressure (β=2.2;95% CI=1.9 to 2.6, P for trend <0.001) increased with increasing levels of ADI (table 2). In a sensitivity analysis excluding those on medications, the results were largely unchanged (online supplemental table S6).
Association of Area Deprivation Index (ADI) and blood pressure, pulse pressure and mean arterial pressure in the Sister Study
Discussion
In this study, we found that participants living in more deprived neighbourhoods have a higher prevalence of hypertension and higher blood pressure, pulse pressure and mean arterial pressure. This association appeared greater for participants with lower SES and for non-Hispanic Black women. This study corroborates existing evidence by demonstrating that participants living in more deprived neighbourhoods have higher blood pressure and hypertension risk. It also indicates that women with lower individual SES and who self-reported as non-Hispanic Black women may be more likely to be impacted by neighbourhood deprivation.
Recent research has focused on neighbourhood factors, because individual factors seem to be insufficient to fully explain cardiovascular disease risk.30 Additionally, understanding the effect of neighbourhood factors on health may help formulate policies that could improve the quality of where individuals live and have a positive effect on health.14 30 Some studies considering only a few neighbourhood indicators suggest that the neighbourhood food environment and the availability of space for physical activities are related to the risk of hypertension.31 32 The neighbourhood environment is a combination of several factors, including environmental exposures such as air pollution, as well as the built environment including quality of housing and public spaces.30 Several studies have examined the association of neighbourhood factors with blood pressure or hypertension using a more comprehensive index. Some16 33 34 but not all35 studies found that residents in a higher SES neighbourhood had lower blood pressure or lower risk of hypertension compared with participants living in lower SES neighbourhoods. Our findings support this link and suggest that participants living in more deprived neighbourhoods have a higher risk of hypertension and a higher blood pressure even after controlling for individual SES.
We also evaluated associations between neighbourhood SES and pulse pressure along with mean arterial pressure, both of which are important predictors for cardiovascular disease. Elevated mean arterial pressure is a measure of total peripheral resistance; widening pulse pressure represents large artery stiffness.36 Our finding of widening pulse pressure and elevated mean arterial pressure among participants living in deprived neighbourhoods further suggests that these participants may be at higher risk for cardiovascular disease.
We found that among participants living in the same level of neighbourhood deprivation, those with higher educational attainment and household income had a lower risk of hypertension. Participants with higher individual SES may have more personal resources (eg, social connections), which may dilute the adverse impact of neighbourhood environments.30 Participants with higher individual SES may live in better locations with better physical activity and food environments within a neighbourhood and may have less exposure to adverse physical environments along with greater options for accessing services and adopting behaviours for optimal health.37 Furthermore, among people with lower individual SES, those who live in less deprived areas might benefit from the available resources in their neighbourhood, which could decrease their health risk.37
We found evidence of an interaction between having an annual household income of less than US$50 000 (the lowest household income level in our study) and living in the most deprived neighbourhood, which indicates that people with fewer personal resources may be more adversely affected by factors related to living in deprived neighbourhoods than people living in less deprived neighbourhoods. One reason for this may be that participants with lower individual SES rely more on neighbourhood resources, even though the lack of investment in deprived neighbourhoods leads to fewer resources.37 Physical activity is protective for hypertension, and a dose-response relationship between physical activity and risk of hypertension has been reported.38 In this study, participants living in the most deprived neighbourhoods with a high level of physical activity had a lower risk of hypertension than those living in the least deprived neighbourhoods with a low level of physical activity. Thus, physical activity may buffer the adverse effect of neighbourhood deprivation on the risk of hypertension.
We found that non-Hispanic Black participants had a much higher risk of hypertension than non-Hispanic White and Hispanic/Latina participants after controlling for individual SES. We also observed an interaction between ADI and race/ethnicity, which indicates that non-Hispanic Black participants are more likely to have hypertension if they live in more deprived neighbourhoods compared with Hispanic/Latina and non-Hispanic White participants. Structural racism may underlie race-based housing segregation, resulting in more persons of colour living in neighbourhoods classified as deprived which in turn leads to inequalities in resources and opportunities across racial/ethnic groups and environmental justice concerns. Race/ethnicity can be thus considered a proxy for social disadvantage caused by racism.39 Although hypertension prevalence was elevated at all levels of increasing ADI compared with the referent category among non-Hispanic Black participants, we did not observe an increasing trend of association between ADI and prevalence of hypertension. The neighbourhoods where non-Hispanic Black participants live might offer fewer services, so the difference among neighbourhoods with different ADI levels may not be enough to influence the prevalence of hypertension. The health disparities by race/ethnicity that we observed may be also due to different individual SES across racial groups.12 For example, compared with White individuals, Black individuals experience institutional racism and receive less income at the same educational attainment and have less wealth at equivalent income levels.12 After adjusting for individual SES, we still observed health disparities across race/ethnicity. Racism itself has been considered a fundamental cause of disease.40 The residual disparity we observed after controlling for individual SES measures may reflect other aspects of racism including the consequences of long-term psychological stress related to experiencing discrimination in different aspects of life.40
A major strength of our study is that at enrolment trained examiners measured blood pressure, height and weight, which allows us to more accurately identify hypertension and obesity. Additionally, our study population is large, allowing for evaluation of strata-specific results and interactions that had not yet been explored.
Our study has limitations. This study used cross-sectional data, so we cannot demonstrate a temporal relationship between living in a deprived neighbourhood and development of hypertension. Participants in this cohort have higher individual SES17 than the US population as a whole which may limit generalisability. Nevertheless, it is noteworthy that we still observe an association between neighbourhood deprivation and hypertension even in this higher SES cohort. The time between the ADI measure (2000) and participants’ enrolment (2003–2009) provides an opportunity for exposure misclassification if participants had been living elsewhere in 2000. We used quintile cut-point-based categories to represent neighbourhood deprivation, which may be less subject to misclassification. We also conducted sensitivity analyses excluding participants who began living at current residence after 2000 and results remained the same.
Our findings suggest that women living in more deprived neighbourhoods may have a higher risk of hypertension, and women with lower individual SES and non-Hispanic Black women may be even more susceptible to hypertension when living in deprived neighbourhoods.
What is already known on this subject
Many studies have shown that lower individual socioeconomic status is associated with higher risk of hypertension or higher blood pressure, and the prevalence of hypertension varies across races/ethnicities. Less is known about the association between neighbourhood level socioeconomic status and prevalence of hypertension or the interaction between neighbourhood level socioeconomic status and individual characteristics.
What this study adds
We found that women with lower neighbourhood level socioeconomic status had a higher prevalence of hypertension and higher blood pressure. Women with lower individual socioeconomic status and non-Hispanic Black women living in neighbourhood with lower socioeconomic status may be even more susceptible to hypertension compared with women with a relatively higher individual socioeconomic status or other races/ethnicities.
Data availability statement
Data are available on reasonable request. Data and code are available for replication upon request (www.sisterstudy.niehs.nih.gov).
Ethics statements
Patient consent for publication
Ethics approval
The institutional review board (IRB) of the National Institute of Environmental Health Sciences (02-E-N271) approved the Sister Study.
References
Supplementary materials
Supplementary Data
This web only file has been produced by the BMJ Publishing Group from an electronic file supplied by the author(s) and has not been edited for content.
Footnotes
Contributors JX: methodology, formal analysis, writing-original draft. KL: validation, writing-review and editing. KO’B: conceptualisation, writing-review and editing. CJ: writing-review and editing. DS: guarantor, conceptualisation, writing-review and editing, supervision, funding acquisition.
Funding This work was supported by the Intramural Research Program of the National Institutes of Health, National Institute of Environmental Health Sciences (grant number Z01ES044005, Z1AES103325) and China Scholarship Council (grant number 201906210460).
Competing interests None declared.
Provenance and peer review Not commissioned; externally peer reviewed.
Supplemental material This content has been supplied by the author(s). It has not been vetted by BMJ Publishing Group Limited (BMJ) and may not have been peer-reviewed. Any opinions or recommendations discussed are solely those of the author(s) and are not endorsed by BMJ. BMJ disclaims all liability and responsibility arising from any reliance placed on the content. Where the content includes any translated material, BMJ does not warrant the accuracy and reliability of the translations (including but not limited to local regulations, clinical guidelines, terminology, drug names and drug dosages), and is not responsible for any error and/or omissions arising from translation and adaptation or otherwise.