Article Text

Abstract
The aim of this study was to investigate whether coronary heart disease (CHD) is rising in India and assess the quality of the evidence. Thirty one studies were reviewed. The sample sizes of the studies varied from approximately 500 to 14 000, with response rates generally over 90%. Many did not fulfil basic requirements for epidemiological research and most studies were in or around Delhi. The three incidence studies used different diagnostic criteria; however, the incidence of myocardial infarction (MI) in urban India in the 14 years to 1991 remained similar at about 6/1000 in males and 2/1000 in females. Prevalence range was higher in urban than rural areas in men (35–90/1000 v 17–45/1000) and women (28–93/1000 v 13–43/1000). There was no clear rise in age specific rates in men over a 27 year period, whereas a rise was seen in women. In conclusion, using a relatively objective measure of CHD it was found that CHD is more common in urban than rural areas of India, but there was little evidence of a rise in CHD over time, especially in men.
- systematic review
- prevalence
- coronary heart disease
Statistics from Altmetric.com
Coronary heart disease (CHD) is forecast to be the most common cause of death globally, including India, by 2020.1 CHD is high among people with Indian origins who are now living abroad.2–6
Gupta and Gupta7 reviewed studies determining CHD prevalence in India. They found that CHD prevalence increased in urban areas from 1% in the 1960s to 9% in the 1990s. In rural areas the rate increased from 2% in the 1970s to 4% in the 1990s. Their meta-analysis did not comment upon the quality of the studies included and did not separate the prevalence on clinical data, and clinical and ECG data. Their conclusions, therefore, need re-examination.
To investigate how common the disease was we reviewed data published in journals (including the prevalence data used in Gupta’s report) on the frequency of CHD in India. To increase comparability we focused on studies including Minnesota coded ECG as part of the definition of CHD.
METHODS
We searched Medline between 1966 and March 2003 and Embase between 1980 and March 2003 using the following text words and MeSH headings: India$ or Asia$ and heart or coronary disease or myocardial infarction or angina. We then examined the citations in the papers found to identify studies not indexed by Medline or Embase. Studies were limited to those published in English language journals and based on populations residing in India. We also searched RSB’s personal collection of books and papers on the subject as well as the World Health Organization8 and Global Cardiovascular Infobase9 websites during March 2003. We extracted data from community based research.
Our search highlighted 3278 references. After removing duplicates and those not obviously relating to CHD frequency, 336 potentially relevant references remained of which 305 were excluded (list of rejected studies available from the authors) as follows: 24 outside India, 33 were hospital studies, 15 CHD was not defined using ECG, 96 measured CHD risk factors, 11 were on diseased populations (for example, diabetic patients), 23 examined CHD prevention or treatment strategies, 60 summarised data in the form of reviews, and 43 were on other topics (for example, case reports). We focused on studies conducted after 1960 because the Minnesota code was published in 1969.10 The first Indian study using the Minnesota code was published in 1974.11
The hospital studies were excluded from this review as they did not permit robust conclusions because they were from cities from several regions and from different types of hospital. No study commented upon the accuracy of data and few stated diagnostic criteria. Many did not state type of hospital, location, or catchment area. While CHD comprised 0–2% of all admissions in the 1950s, it comprised about 10% in the 1970s and 1980s.
Community studies generally included both symptomatic and asymptomatic individuals. Asymptomatic CHD cases had characteristic changes on the ECG but no symptoms. Of the nine studies presenting data from the asymptomatic population, only three12–14 detailed how this population was defined—that is, whether negative on the Rose questionnaire or without clinical history. Most studies used Minnesota codes 1.1.1–1.1.7, 1.2.1–1.2.7 (pathological Q), 4.1.1, 4.1.2 (ST depression), or 5.1, 5.2 (T wave inversion) to define CHD. However, some studies used the additional ST change code 9.215–18 in their definition and occasionally included clinical cases.19,20 One did not include t wave inversion data in their definition.20 Probable CHD was, therefore, not defined absolutely consistently.
We extracted the following information from publications: time and location of fieldwork, criteria for diagnosing CHD, method of determining denominator populations, technique of selecting sample, age range of subjects, response rates, and the rate of CHD in males, females, and both combined. The incidence and prevalence rates were rounded to the nearest integer and expressed per 1000, and mortality rates per 100 000.
The quality of the totality of publications was judged on basic requirements of epidemiological design (for example, whether location and date of fieldwork was given), the definition of the measures of disease and hence accuracy of the numerator, the source and accuracy of the denominator, sampling strategy, response rates, and definitions used to do subgroup analysis by ethnic or religious group.21
RESULTS
Community based studies
For ease of reference, studies will be referred to in the text by their number in the table under consideration, shown in brackets. The methods employed in the included studies are tabulated in the appendix (table A1)(to view the appendix please visit the Heart website—http://www.heartjnl.com/supplemental).
Location of Studies
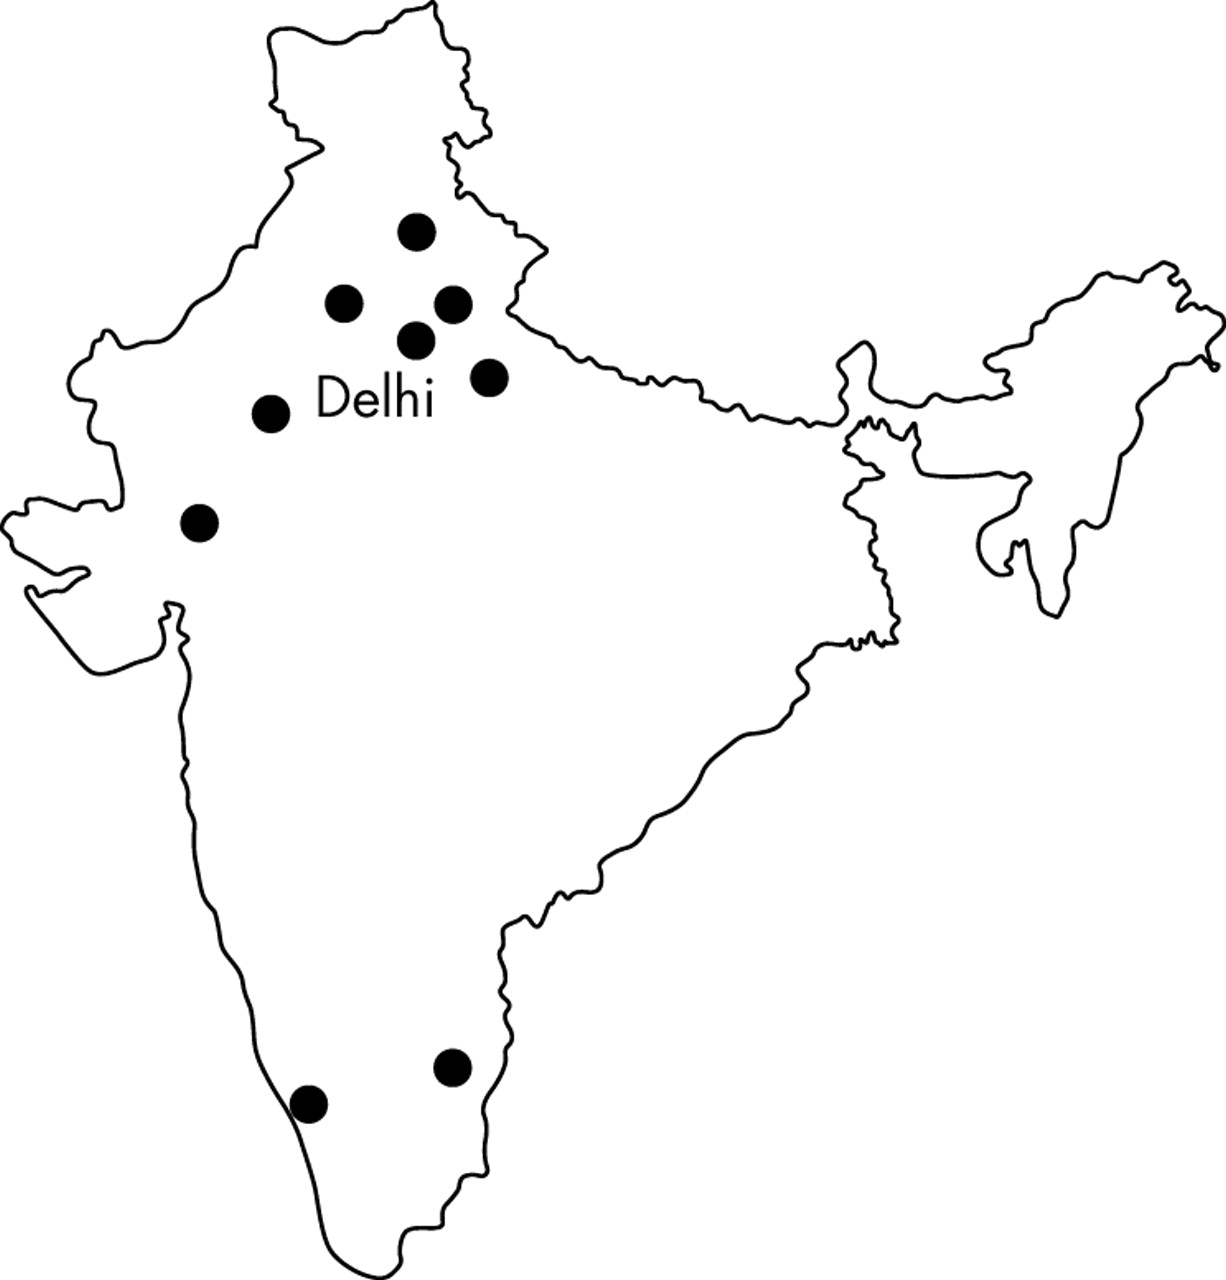
Table 1 shows there were three studies on incidence, 27 on prevalence, and one on mortality. Of these, 28 were from North India, mostly around Delhi, the capital of India (fig 1). Mortality data were only on Indian men.
Summary of methods and results of incidence and mortality studies examining CHD frequency in India

Map of India showing location of areas studied.
Observations on methods of community studies
Of 31 studies, 21 did not state the date of fieldwork11,13,15–19,22–35(table A1, studies 4–6, 8, 11–15,17–24, 26, and 28–30). Three studies used the census to define study areas and denominators19,27,36(table A1, studies 14, 16, and 18) though the accuracy outside the census year is questionable. Malhotra37(table A1, study 31) determined the denominator for his railway mortality study from pay roll data. Trivedi38(table A1, study 3) provided detailed information on the method of sampling.
The response rate was sometimes near 100% and generally over 85%, although lower in females (table A1, studies 12, 17, 20, 24, and 29). There was dual publication of data. Two urban datasets supplied six papers13,29,34,36,39,40(table A1, studies 7, 9, and 16 and studies 17, 21, and 29). One rural dataset supplied four papers15,17,29,31(table A1, studies 12, 20, 21, and 24).
None of the three studies reporting ethnic differences12,34,36(table A1, studies 10, 16, and 29) indicated the criteria for categorising people into different ethnic groups.
Findings of community studies: incidence
The three incidence studies used different methods to attain data and so are not directly comparable. However, Gupta and Khetrapaul41(register based study) and Chadha et al42(cohort study) describe a similar incidence of MI 14 years apart. The decreasing incidence in the Trivedi and co-workers cohort study38, from 6/1000 to 3/1000, probably reflects early cases arising in people with prevalent disease, possibly exacerbated by including 172 volunteers, who may have had high risk of CHD.
Findings of community studies: prevalence of probable CHD in Indian urban and rural areas
Over the 27 year period represented in table 2, there was little evidence of a rise in prevalence in urban areas, particularly in men. Evidence suggesting an increased urban prevalence over time in women in the symptomatic and asymptomatic population came from Gupta and Malhotra22(table 2, study 1) and Gupta et al13(table 2, study 2) where rates were 28/1000 in 1975 and 84/1000 in 1995 respectively. Gupta et al35(table 2, study 8) measured prevalence in the same population (but not the same individuals) approximately eight years after the initial study13(table 2, study 2). They found no increase in the prevalence of CHD in men or women. Of the five studies presenting data from asymptomatic populations, two reported from the same dataset (table 2, studies 10 and 12) with rates of 56/1000 in men and 76/1000 in women; the remaining three (table 2, studies 9, 11, and 13) reported rates between 25/1000 and 77/1000 in men and 31/1000 and 56/1000 in women with no trend. The study of Singh and co-workers in Moradabad (table 2, study 11) was not directly comparable with the other urban studies as their population was all over 49 years old.
Urban prevalence rates of probable CHD per 1000, in males and females
In the rural studies (table 3), again the evidence for a rise in prevalence was very limited. Assessing change over time was tentatively possible between Deewan et al11(table 3, study 1) and Wander et al19(table 3, study 3). Neither gave fieldwork dates but were published 20 years apart. Prevalence of probable CHD in the symptomatic and asymptomatic populations increased from 17/1000 to 26/1000 in men and 13/1000 to 38/1000 in women. Among the asymptomatic population, prevalence appeared to decrease over time, at least in women. Jajoo et al23(table 3, study 8), reported prevalence as 34/1000 in 1988 and this decreased by 1997 to between 11/1000 and 27/1000 as reported by Singh et al18(table 3, study 11) and Chadha et al14(table 3, study 10), respectively. Only Chadha et al14(table 3, study 10) gave fieldwork dates. Of the 10 studies that gave both male and female rates, six (table 3, studies 2, 3, 7–10) reported rates higher in females than males of between 20%(table 3, studies 2 and 4) and 450%(table 3, study 10). Artefacts, particularly the validity of the ECG in the diagnosis of CHD, need to be considered with such a female excess.
Rural prevalence rates of probable CHD per 1000 in males and females
Three studies explicitly compared urban and rural prevalence rates. The urban prevalence of Gupta and Malhotra22(table 2, study 1) was higher than Deewan et al11(table 3, study 1) rural prevalence in men (45/1000 v 17/1000) and women (28/1000 v 13/1000). Chadha14 compared the asymptomatic urban (table 2, study 10) and rural Delhi population (table 3, study 10) and found rates to be higher in urban Delhi men (56/1000 v 6/1000) and women (76/1000 v 27/1000) compared with their rural counterparts. Singh et al18 also found a similar pattern in the urban (table 2, study 13) and rural (table 3, study 11) asymptomatic Moradabad population (men 25/1000 v 18/1000; women 34/1000 v 11/1000). Urban prevalence rates therefore exceeded rural rates by between 40% and 900% in men and between 220% and 300% in women.
No studies presenting ECG defined CHD explicitly compared rates between North and South India. South Indian prevalence rates were not consistently higher than North India (table 2, studies 5 and 6).20,33 However, Beegom and Singh28(table A1, study 19) found the rates of MI (clinical CHD; defined using the Rose angina questionnaire) to be higher in both South Indian males (174/1000 v 100/1000) and females (102/1000 v 69/1000) than North Indians.
Ethnic groups in India
Few studies reported on Indian ethnic subgroups, with some suggestion of heterogeneity. Gopianth36(table 2, study 12) reported on the asymptomatic Delhi population by religious group without stating how religion was determined. Among the male population, Muslims experienced the highest rates (95/1000) with no cases in Christian men. Hindus and Sikhs had similar rates (50/1000 and 54/1000, respectively). Among females, Sikhs experienced the highest rate (114/1000), Christians the lowest (48/1000; but only comprised 0.9% of the study population) while Muslims and Hindus had rates in between (85/1000 and 61/1000 respectively). Gupta et al34(table 2, study 7) found rates to be higher in Hindus, particularly men, than Muslims but there were only two cases in the 272 Muslim men. Chadha et al12 and Gopianth et al40(table 2, studies 9 and 10) found that Gujerati males in Delhi had a prevalence rate that was higher than the general population (67/1000 v 56/1000) whereas Gujerati females had a lower rate compared with their counterparts (31/1000 v 76/1000).
Comparison over time in age specific prevalence rates
Five urban (table 4) and five rural (table 5) studies reported prevalence of probable CHD by age groups. Only one gave a date for fieldwork. Among the symptomatic and asymptomatic urban populations, Gupta et al13(table 4, study 2) and Gupta et al35(table 4, study 3) published prevalence in the same Rajasthan area some years apart. Although no difference in total prevalence was reported, age specific rates show a decline in males less than 40 years old, but an increase in those aged 40–59 years but no important changes in females. However, comparing Gupta et al35(table 4, study 3) with Gupta and Malhotra22(table 4, study 1), over a 27 year period, there appeared to be no difference in age specific rates between males whereas an increase was clear cut in females. Among the asymptomatic urban population (table 4, studies 4 and 5), there was no evidence of a rise in either males or females.
Urban prevalence rates of probable CHD per 1000 by age group (numbers in parenthesis represent numbers studied in each age band)
Rural prevalence rates of probable CHD per 1000 by age group (numbers in parenthesis represent numbers studied in each age band)
Among the rural population (table 5), a clear cut rise among the symptomatic and asymptomatic females was seen with some evidence of a rise in men.
Mortality from CHD
The study by Malhotra37 is the only study reporting CHD mortality from the Indian subcontinent (table 1). Indian rates were presented by railway zones and ranged from 20/100 000 to 135/100 000 in Northern and Southern railway zones respectively.
DISCUSSION
Search strategy and methods
We reviewed 31 studies found by searching Medline and Embase and examining citations. We searched some grey literature—for example, from the World Health Organization website. The World Health Organization statistical information system (WHOSIS)8 and Global Cardiovascular Infobase9 provide epidemiological profiles of cardiovascular disease internationally. Neither source yielded relevant information, in the case of WHOSIS because death registration was considered to be too low. It is unlikely that additional grey literature sources would yield higher quality information than we found. Much Indian scientific, medical, and academic research uses English, particularly for publication. While our search strategy may have missed work, it seems unlikely that it would give higher quality information than we found, or that our conclusions would have changed substantially. Our search was, therefore, limited to articles in English for pragmatic reasons.
Using ECG based definitions made it possible to compare studies. We have, therefore, focused on ECG defined probable CHD in populations that were asymptomatic or included both asymptomatic and symptomatic people. We excluded studies using only the Rose angina questionnaires because they seldom commented on translation and validation. Without this information we cannot judge the accuracy of the translation or the ability of the population to understand it correctly.43 The questionnaire has lesser validity in women44 and is probably less valid in non-white populations.45 One Indian study concluded that the questionnaire was highly sensitive but not highly specific for angina.24
However, ECG based definitions also have limitations. Non-specific ECG changes make interpretation difficult—for example, Q waves, a sign of MI, can be produced by bundle branch block, and flat/inverted T waves in leads II, III and AVF are not necessarily myocardial ischaemia.46 ST depression may not have the same diagnostic power in females and may over diagnose.47 Patel et al concluded that ECG changes suggestive of ischaemia are common in South Asians and may not be associated with clinical evidence of CHD.48 Our finding of more probable CHD in women than men suggests that this may be partially true for women.
Prevalence of CHD measured clinically produces rates higher than that measured solely by Minnesota coded ECG. For example, the prevalence of probable CHD based on ECG, in Moradabad27 was 67/1000 but it was 121/1000 when based on clinical and ECG data. A recent review by Gupta7 did not take such factors into account. For example, the prevalence in Rohtak in 1975 was reported to be 3.6%(our calculation was 3.8%) and 8.6% in Moradabad in 1995 (table A1, study 21). The Rohtak study presented ECG defined probable CHD whereas clinical CHD was presented in the Moradabad study. To infer an increase over time, as Gupta did, was misleading. This report was cited by the key publication of Yusuf et al1 as demonstrating the alarming increase of CHD in India.
To accurately determine prevalence, a precise baseline denominator and a representative sample of individuals are required. To gauge CHD in India we need studies from across the country. In fact, most have been done in and around Delhi. Five rural studies11,17,19,23,26 all studied subjects in their chosen area but the study areas were usually chosen because of their proximity to educational institutions. Only three studies13,35,36 used random number methods to select subjects. The other methods used included blind selection of streets18,27,32(but not houses/individuals), and selecting houses at varying intervals.11,12,14,22,36,39,40 These methods may not draw random samples.
Generally the studies were large, the number of participants ranging from approximately 500 to 14 000. A power calculation was done in three studies.18,27,39 These studies assumed prevalence rates of 40/1000,39 50/1000,18 and 80/100027 and had sample sizes of 14 000, 2000, and 600. These assumed rates were based on clinical CHD. The two studies accounting for clustering27,39 did so by doubling the sample size required. The statistical basis upon which this decision was made was not stated. Response rates were high (over 90%) and frequently approached 100%. The methods are worthy of deeper examination to understand how such high rates were achieved.
In the studies that examined subgroup differences, no mention was made as to how religious affiliation was assessed34,36 or how Gujerati identity was established.12
Comparisons by time, regional and ethnic/religious subgroups
The three incidence studies did not show a rise over time. Trivedi38 reported that the incidence of CHD from the same Gujarat village cohort halved over the years 1987–1992 (6/1000 to 3/1000), probably because early cases were arising from the pool of prevalent disease. Trends in prevalence data over a 27 year period were difficult to interpret, partly because many studies did not give dates of fieldwork. This is a major weakness in the set of studies21; however, using publication date as a proxy measure the re-examination of prevalence in urban Rajasthan by Gupta et al showed no increase between 1995 and 2002 in either men or women. Overall and age specific prevalence data over a 27 year period suggests an increase in women, and less evidence for changes in men. On the ECG alone, however, the male to female ratio was inconsistent, with female rates exceeding those of men in several studies, especially more recent ones. This most likely reflects the sex differences in the validity of the ECG in diagnosing CHD, though the sex ratio may be changing as the epidemic of CHD affects women more than men.
There are few data on regional variations within India. Malhotra37 showed that mortality from CHD differed between employees of Indian railways across railway zones. The rates were lowest in Northern areas (20/100 000), higher in Eastern and central areas (50/100 000 and 63/100 000, respectively) and highest in Southern areas (135/100 000). The lack of mortality studies reflect no uniform completion of death certificates and no centralised death registry for cardiovascular disease.49 Prevalence data did not accord with such huge variation. Within urban Delhi12,36 and Rajasthan35 there was evidence that prevalence might differ by religion and ethnic group, but larger and more clearly documented studies are needed. The prevalence rates are higher in urban than rural India.
In conclusion, there is a shortage of good quality comparable epidemiological data from India. The evidence does not suggest a rising incidence of CHD to the extent predicted. However, there is evidence of increasing prevalence, mainly in women, but it is based on few studies. India may be on the cusp of an explosive epidemic of CHD, but the evidence for this is weak. The impression of a higher prevalence in recent decades may reflect better clinical diagnosis, more health care facilities, more cases of CHD in hospitals, greater survival, and population aging. There is an urgent need for new epidemiological research in India. Future studies should randomly select subjects, provide dates of fieldwork, be powered to test for variation in time and place, provide age specific and age adjusted rates, diagnose CHD using agreed and consistent definitions, including ECG based measures, and represent more regions of the country.
Acknowledgments
We would like to thank Professor Simon Capewell for comments on a student project of N Ahmad arising from this research.
REFERENCES
Supplementary materials
The table is available as a downloadable PDF (printer friendly file).
If you do not have Adobe Reader installed on your computer,
you can download this free-of-charge, please Click hereFiles in this Data Supplement:
- [view PDF] - Table A1. Summary of methods for studies measuring frequency of coronary heart disease in communities.