Article Text

Abstract
Objectives Several observational studies have suggested an association between high temperatures and all-cause mortality. However, estimates on more specific mortality outcomes are sparse, and frequently assessed in studies using different analytical methods.
Methods A time series analysis was performed on 10 regions in England and Wales during the summers (June–September) of 1993–2006. Average percentage linear increases in risk for a 1°C increase in temperature above region-specific thresholds and attributable deaths were computed by cause-specific mortality and age groups (0–64, 65–74, 75–84, 85+).
Results There was evidence of increased mortality with heat for almost all cause-of-death groups examined, with an overall increase in all-cause mortality of 2.1% (95% CI 1.6% to 2.6%) for a 1°C rise above the regional heat threshold. Among main causes, the steepest increase in risk was for respiratory mortality (+4.1% (3.5% to 4.8%) per 1°C). It was much smaller for cardiovascular causes (+1.8% (1.2% to 2.5%)) and myocardial infarction (+1.1% (0.7% to 1.5%)), but comparatively high for arrhythmias (+5.0% (3.2% to 6.9%)) and pulmonary heart disease (+8.3% (2.7% to 14.3%)). Among non- cardiorespiratory causes, the strongest effects were for genitourinary (+3.8% (2.9% to 4.7%)) and nervous system (+4.6% (3.7% to 5.4%)) disorders. 33.9% of heat deaths were attributable to cardiovascular causes, 24.7% to respiratory causes and 41.3% to all other causes combined.
Conclusions These results suggest that the risk of heat-related mortality is distributed across a wide range of different causes, and that targeting of preventative actions based on pre-existing disease is unlikely to be efficient.
- Epidemiology
- mortality studies
Statistics from Altmetric.com
What this paper adds
A number of observational studies have suggested an association between hot temperatures and all-cause, cardiovascular and respiratory mortality.
Estimates on the effect of heat on more specific mortality outcomes are sparse, and frequently assessed in studies relying on different analytical methods.
Analysis of the association between heat and an extensive list of mortality outcomes, based on a common analytical approach, indicates a very widely distributed risk in relation to contributing cause.
This suggests that targeting preventative actions based on assessment of existing diseases is unlikely to be an efficient strategy.
Introduction
Periods of high temperature in England and Wales are likely to increase in frequency and intensity as a result of climate change,1 2 and, unless protective measures are taken,3 so too their attendant impact on mortality and morbidity.4
In England, the strategy for the prevention of heat-related health effects is outlined in the Department of Health's Heatwave Plan, launched in 2004 and subsequently revised.5 The plan includes both a weather-based warning system, and advice to primary and social care professionals and to the general public. The identification of individuals at high risk of heat-related mortality or morbidity is a key part of the plan. It defines at risk people as those with serious chronic conditions (especially heart or breathing problems), mobility problems (eg, Parkinson's disease or a previous stroke) and serious mental health problems. In addition, people on certain medications and those who misuse alcohol or drugs are considered at risk. However, to date, evidence concerning the degree to which risk is concentrated in these groups has been very limited, and it is unclear, even in theory, whether targeting these groups would prevent a large number of heat deaths.
The aim of this contribution is to assess heat-related mortality in relation to a wide range of causes using data for England and Wales in the period 1993–2006. The analysis may help define high-risk groups and estimate the effectiveness of preventive actions undertaken so far. In addition, the comparative assessment of multiple causes of deaths could help formulate or assess hypotheses on the underlying pathophysiological mechanisms in the association between high temperature and human health.
Methods
Weather and mortality data
In order to account for the different climates within the UK, a meteorological data series was created for each Government Office Region in England and Wales. Data on minimum and maximum dry-bulb and dew point temperatures were obtained from the British Atmospheric Data Centre. Relative humidity was calculated using the average from dew point and dry-bulb temperatures at 9:00 h and 15:00 h. For each measure we used only data from stations reporting on 75% of days between 1993 and 2006, with a mean of 29 stations contributing to each regional series (range: 7 in London to 44 in Wales). The temperature series are highly correlated within regions (mean r=0.95, range 0.94–0.98) and station means vary little within region (mean SD 0.7°C, range 0.3–1.1°C). Missing values in day i in station j were imputed using a combination of period average of the station j and a weighted average of the other regional stations. We then combined the values for day i from all monitoring stations in each region using a weighted average with weights equal to the populations residing closest to each station. Details of these methods have been previously described.6 7
Individual death record data were obtained from the Office for National Statistics, including date of death, age, underlying cause of death and postcode of residence at time of death. A broad list of 33 causes of death potentially associated with heat was selected, based on published epidemiological and physiological evidence regarding chronic diseases previously reported to be affected by hot weather. ICD-9 codes were used for the period 1993–2000 and ICD-10 for 2001–2006 (see online eTable 1 for the full list). Data were also disaggregated into five age groups: all, 0–64, 65–74, 75–84, 85+ years of age). The data were collapsed to series of daily counts for each region, for the specified age/cause-of-death subgroups.
Statistical analysis
The region and age-specific association between temperature and each outcome was assessed by time series analysis. Given the focus of the analysis on the effect of heat, we restricted the period of observation to the summer months (June–September). The different methods used to express the relationship between temperature and health outcomes have been extensively reviewed in previous work,8 and modelling choices in this contribution are based on an extensive assessment performed on the same dataset for all-cause mortality.7 We rely on a simple model, choosing a parameterisation where the effect of the average of the same and previous day's maximum temperatures (lag 0–1) is assumed to follow a log-linear increase in risk above a heat threshold, suggested as a reasonable and transparent approximation to more complex non-linear models. Lag choices are based on previous research in the UK,9 10 while maximum temperature was chosen as the index providing the best fit in an analysis of all-cause mortality. In order to achieve comparable estimates for different regions and outcomes, we fixed the threshold to the 93rd percentile of region-specific year-round distribution of lag 0–1 maximum temperature (reported in table 1), the value showing the best fit for overall mortality.
Descriptive statistics for overall mortality and maximum temperature by each region (June–September)
The model follows a standard form for time series regression of season-specific data.11 12 Here the expected number of deaths E(Yir)=μir in day i for each region r, assumed to follow an overdispersed Poisson distribution, is described by the formula:
Results
Descriptive statistics for each region are reported in table 1. During the period considered in the analysis (summer months in 1993–2006), a total of 2 285 519 deaths occurred in England and Wales, with an average of 134 each day per region. Regions show some differences in the distribution of maximum temperature, with the 93rd centiles (thresholds) increasing from 20.9°C for the North East to 24.7°C for Greater London.
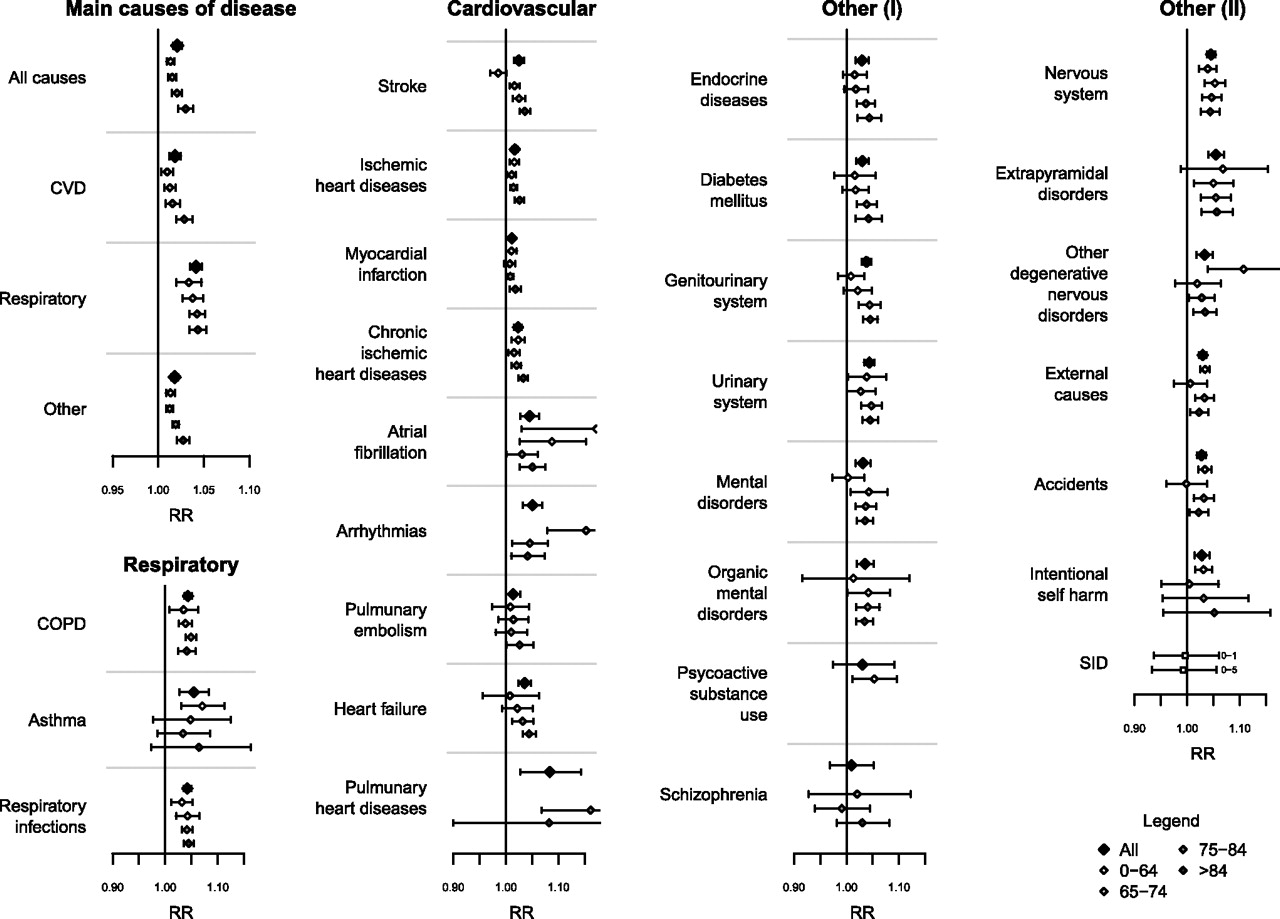
The main results are plotted in table 2, which shows the pooled estimates of effect (percentage increase in risk for each 1°C increase above the regions-specific heat threshold) and attributable deaths for each mortality outcome (see online eTable 1 for ICD-9 and ICD-10 codes). The age-specific estimates are included in figure 1 (see online eTable 2 for a complete list of age-specific values). The analysis by main causes shows the typical trend of risk by age, with an estimated increase for overall mortality of 2.1%, ranging from 1.3% in 0–64 year olds to 3.0% in 85+ year olds. Thus, ambient heat is responsible for 1.03% of the overall mortality that occurred in the summer months during the study period, equating to approximately 23 617 deaths. The results confirm the higher risk for respiratory as compared to cardiovascular mortality, with an increased risk of 4.1% and 1.8%, respectively. However, the attributable burden is higher for the latter, with 8005 attributable cases compared to 5841 for the former. While the risk for cardiovascular mortality increases with increasing age, the effect by respiratory causes is consistent across age groups. Non-cardiorespiratory (‘other’) deaths were also associated with heat, with similar slopes and age-specific effects as cardiovascular causes.
Total number of deaths, pooled estimates of effect (% increase, with 95% CI) related to a 1°C increase above the region-specific heat thresholds and attributable burden for each cause of death

Pooled estimates of relative risk (with 95% CI) related to a 1°C increase above the region-specific heat thresholds for each cause-of-death and age group.
Within cardiovascular causes, the highest estimated risk was found for atrial fibrillation (4.5%), arrhythmias (5.0%) and pulmonary heart disease (8.3%). We found a much lower additional risk per 1°C increase in heat for myocardial infarction (1.1%) and ischaemic heart diseases (1.7%), although these causes are associated with large absolute risks. Stroke and heart failure show a strong pattern by age. The increases for respiratory causes are higher and less heterogeneous, both between causes and age groups, than for cardiovascular causes, ranging from 4.2% for respiratory infections to 5.5% for asthma.
There was also a significant heat-related risk for most non-cardiorespiratory outcomes, with increases of 2.9% for endocrine, nutritional and metabolic disorders, 3.8% for diseases of the genitourinary system, 3.1% for mental and behavioural disorders, and 4.6% for diseases of the nervous system. External causes showed an increase of 3.0%, with a slightly higher risk for deaths among those aged 0–64 than for older age groups.
Table 2 and online eFigure 1 show that there is no clear relationship between cause-specific heat-mortality and the number of heat attributable deaths. Most notably, ischaemic heart disease and myocardial infarction both had comparatively small temperature–mortality relationships (smaller point estimates than for all non-cardiorespiratory causes combined) but account for sizeable fractions of the overall burden of heat deaths, while some of the causes with strong temperature–mortality relationships, such as arrhythmias, asthma and nervous system disorders, account for a comparatively small fraction of the overall heat mortality burden.
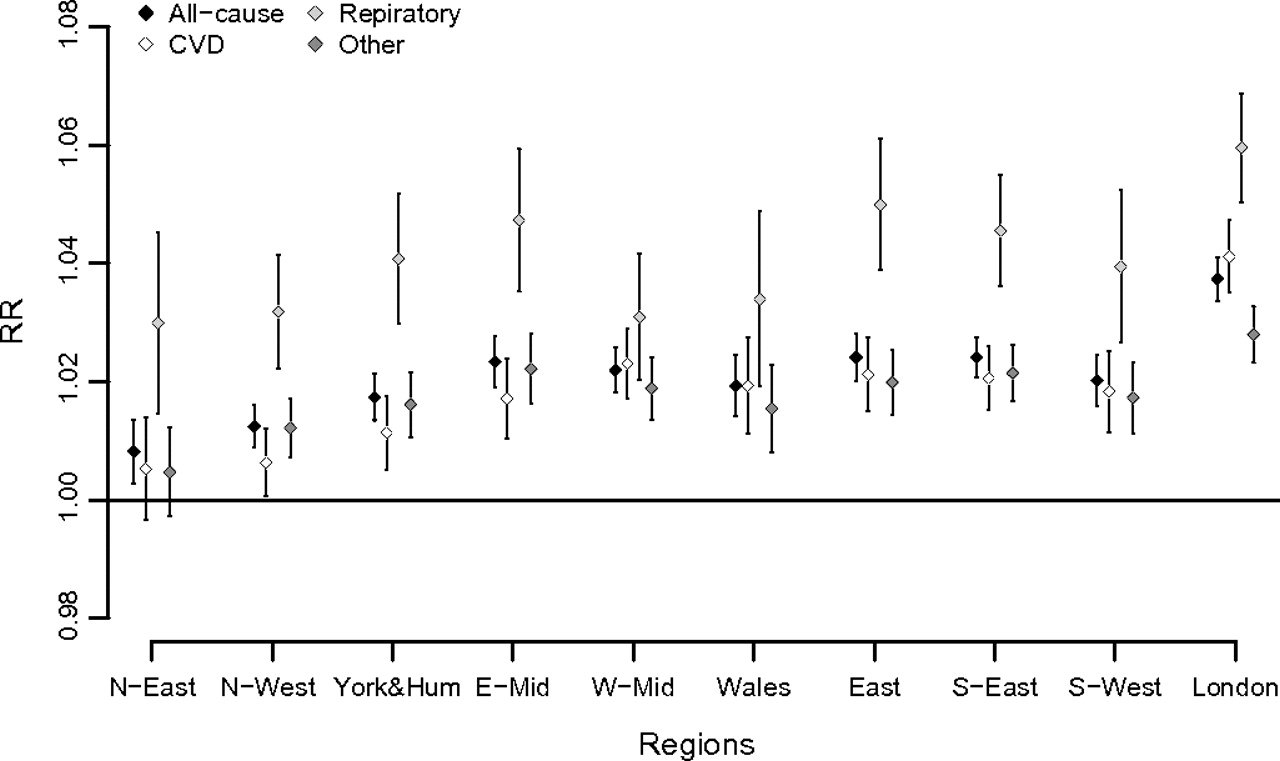
Region-specific estimates for broad causes (all-cause, cardiovascular disease, respiratory, other) are illustrated in figure 2. Estimates of the increase in risk for each 1°C above the region-specific heat threshold are substantially heterogeneous across regions, with I2 statistics (the proportion of variance estimated to be true between-region variation) ranging between 67% and 92% for these causes of deaths. However, although heterogeneous, the cause-specific heat slopes show broadly similar relationships to each other across regions, with the gradients being generally steeper in London and other warmer regions, as previously reported for all-cause mortality.7
Region-specific estimates of relative risk (with 95% CI) related to a 1°C increase above the region-specific heat thresholds for broad causes of death. CVD, cardiovascular disease.
In order to assess the sensitivity of the results to the modelling choices, we repeated the analysis on broad causes increasing to 6 the degrees of freedom of the spline for seasonality and/or including a cubic term for long time trend. The results are robust to these choices, with the percentage change in the effects (measured as percentage increase) for the four broad causes ranging in the order of 0.1–7.5%.
Discussion
This study provides detailed evidence from England and Wales on the relationship between high temperature and mortality by cause-of-death and age. Comparability of the results by cause is enhanced by the application of a common analytical framework and modelling choices.
One of the notable observations of this analysis is the apparently widespread effect of heat, with evidence of a heat-related increase in mortality for almost all of the cause-of-death and age groups analysed. The effect of heat generally increases by age, as reported by other investigators.16 17 Ageing induces physiological changes in thermoregulation and homeostasis, together with the increased prevalence of chronic conditions and use of medication, which are likely to increase vulnerability to heat.18 19 There were some variations in the pattern of risk with age, with relatively steep gradients for stroke and heart failure, for example, and flatter slopes for respiratory diseases.
Although heat risk is often thought of mechanistically in terms of its effects on the cardiovascular system, it is noteworthy that relative risks for cardiovascular causes in general were no higher than those of most other causes of death and appreciably lower than those of respiratory causes. Of particular note is the relatively low relative risk for myocardial infarction, which has an underlying thrombotic genesis. This argues against changes in the coagulation properties of the blood as a major pathway for heat-related mortality risk, although numerically, myocardial infarction still contributes substantially to the excess burdens of deaths. However, the excess risks appear somewhat higher for stroke, which also is partly a thrombotic phenomenon.
Although the estimates are very imprecise, it appears that some of the highest cardiovascular excess risks are for pulmonary heart disease. Pathophysiologically, this may tie in with the relatively high excess risks for respiratory categories in general, and perhaps suggests critical exacerbation of right heart failure or other circulatory decompensation in the context of increased demand for cardiac output (for cooling) but limited reserve. Heart failure in general showed relatively high excess risks. Also of note is the comparatively high excess risks for arrhythmias and atrial fibrillation in particular, which have been noted previously.17 20 The reasons for the large excess relative risk for this cause-of-death group are not clear, but such arrhythmias may contribute to cardiovascular compromise.
We found an important risk for chronic diseases such as diabetes mellitus, as well as for diseases of the genitourinary system, which may well reflect adverse effects on fluid and electrolytic balance, especially in those on medication.4 20 The higher risk for nervous system diseases and mental disorders is likely to be related to impaired perception of environmental conditions and impaired ability to take actions to protect health.18 19 Note the relatively high excess risks for extra-pyramidal disorders, which includes Parkinson's disease.
Our results on the overall relationship between heat and all-cause mortality are broadly compatible with evidence from the USA,16 21–23 the UK,7 24 25 and elsewhere. In particular, two recent studies summarise the effects for 107 U.S.A. communities and 15 European cities, and report an average increase of around 3% for 1°C increase in temperature.12 26 Where cause-of-death has been examined, mainly for cardiovascular and respiratory deaths as broad groupings, the evidence has generally shown larger effect on respiratory causes,21 27 28 while some studies of other causes have found a marked increase also for nervous system diseases and mental illness.17 19 29 However, a comprehensive analysis of specific causes of death in relation to high temperatures has rarely been reported.
Our analytical approach is based on a simple linear-threshold model with cut-offs at percentiles of region-specific distributions. This choice is coherent with the findings of the systematic assessment by Armstrong and colleagues for all-cause mortality, performed on the same data.7 In their analysis, the linear threshold model performed only marginally less well compared to more complex models with non-linear terms, although some evidence of non-linearity for extremely hot temperatures was also reported. Here, given our focus on the relative impacts of heat on different causes of death, we favoured interpretability over flexibility, but the presence of bias in the analysis of cause-specific mortality due to this approximation cannot be entirely ruled out. The same applies to other complexities in the temperature–mortality association, such as harvesting and time-varying effects.
The adoption of region-specific thresholds assumes the (partial) adaptation of populations to their own climates, a phenomenon previously reported.12 22 Nonetheless, a substantial heterogeneity still remains, and we measured a North–South gradient in the supra-threshold linear effect, reported previously in detail for all-cause mortality.7 However, given the relative similarity in these patterns across different causes, as illustrated in figure 2, we do not expect important biases in our comparative assessment.
The analyses do not account for the potential mediating, confounding or modifying effects of air pollution, in particular ozone, as these measures were not available for regional data. While some studies have reported some evidence of effect modification by particulates and ozone in the temperature–mortality association,30 31 other investigators have measured a relatively small confounding effect.26 32 A recent study exploring the heat–ozone interaction in 15 British conurbations, a subset of the data used here, has found that the effect of temperature was robust to the confounding or modification effect of ozone.33 In particular, the effect of ozone seems to disappear when maximum temperature is used, the same temperature metric adopted in our analysis. However, these results are not conclusive and the chance that the estimated effects are partly due to unmeasured air pollution should be taken into account.
Although vulnerability to heat in those with recognised chronic diseases is not directly estimated in these cause-specific mortality analyses, the widespread heat-related increased mortality in many cause-of-death groups suggests that many groups of individuals with recognised disease conditions would need to be targeted if preventative actions were to cover most of the population-level risk of heat mortality. Indeed, in the case of cardiovascular disease, for example, which numerically contributes the largest group of excess heat deaths despite a comparatively low relative risk, it is reasonable to assume that pre-existing disease may often not be even recognised. Thus, heat death may be little more predictable than death in general. And, while of course it is appropriate in clinical settings to pay attention to those who may be at relatively greater risk during periods of heat, the observed increase in heat mortality in a wide range of cause-of-death groups suggests the need to pursue a broad-based population strategy for prevention as well as targeted strategies. This has evident implications for the emphasis in the Heatwave Plan in England and elsewhere.
References
Supplementary materials
Web Only Data oem.2010.059782
Files in this Data Supplement:
Footnotes
Funding This study was funded by the Medical Research Council (grant reference G0501810). The funder had no role in the planning of the study design; in the collection, analysis and interpretation of data; in the writing of the report; or in the decision to submit the article for publication. All authors are independent of the funder.
Competing interests None.
Provenance and peer review Not commissioned; externally peer reviewed.