Article Text

Abstract
Objective: To study cross-national inequalities in mortality of adults and of children aged <5 years using a novel approach, with clustering techniques to stratify countries into mortality groups (better-off, worse-off, mid-level) and to examine risk factors associated with inequality.
Design, setting and participants: Analysis of data from the World Development Indicators 2003 database, compiled by the World Bank.
Main outcome measures: Adult and child mortality among countries placed into distinct mortality categories by cluster analysis.
Results: 29 countries had a high adult mortality (mean 584/1000; range 460/1000 to 725/1000) and 23 had a high child mortality (mean 207/1000, range 160/1000 to 316/1000). All these countries were in western and sub-Saharan Africa and Afghanistan. Bivariate analyses showed that relative to countries with low child mortality, those with high child mortality had significantly higher rates of extreme poverty (p<0.001), populations living in rural areas (p<0.001) and female illiteracy (p<0.001), significantly lower per capita expenditure on healthcare (p<0.001), outpatient visits, hospital beds and doctors, and lower rates of access to improved water (p<0.001), sanitation (p<0.001) and immunisations. In multivariate analyses, countries with high adult mortality had a higher prevalence of HIV infection (odds ratio per 1% increase 18.6; 95% CI 0.3 to 1135.5). Between 1960 and 2000, adult male mortality in countries with high mortality increased at >4 times the rate in countries with low mortality. For child mortality, the worse-off group made slower progress in reducing <5 mortality than the better-off group.
Conclusions: Inequalities in child and adult mortality are large, are growing, and are related to several economic, social and health sector variables. Global efforts to deal with this problem require attention to the worse-off countries, geographic concentrations, and adopt a multidimensional approaches to development.
- CPI, consumer price index
- GDP, gross domestic product
- GNI, gross national income
- PPP, purchasing power parity
- WDI, World Development Indicators
- WHO, World Health Organization
Statistics from Altmetric.com
- CPI, consumer price index
- GDP, gross domestic product
- GNI, gross national income
- PPP, purchasing power parity
- WDI, World Development Indicators
- WHO, World Health Organization
Interest in health inequality among countries is growing.1 The World Health Organization (WHO),2–4 World Bank,5,6 Unicef,7,8 Pan American Health Organization, United Nations Development Programme,9–12 the UK Department of International Development13 and the broader global health community14–16 have made this issue a priority. One book, Challenging inequities in health: from ethics to action, published results from the Global Health Equity Initiative examining social inequalities in health in 15 countries.1,16–18 On 18 March 2005, the WHO Commission on Social Determinants of Health was formed and charged with identifying interventions and policies to reduce global health inequalities. However, the formulation of a global policy for closing the gap between industrialised and developing countries is hampered by the lack of a sound knowledge base. Although much work has focused on the determinants of average health,1 the conceptualisation and measurement of poverty worldwide,19,20 social determinants of, and social inequalities in, health within and between industrialised countries,21–28 and comparing inequalities between socioeconomic groups within countries,1,29–37 there have been few studies on health disparities between countries. This paper aims to study cross-national inequalities in adult and child mortality using a novel approach, with clustering techniques to stratify countries into mortality groups (better-off, worse-off, mid-level) and to examine associated risk factors for inequality. Stratifying countries into mortality groups of different levels of health, which, to our knowledge, has yet to be carried out, better enables multilateral institutions like the WHO and the World Bank to devise policies and interventions to reduce the gap in mortality between countries. This type of study is particularly relevant for organisations such as the World Bank, which work in several policy domains outside the health sector.38 This study uses data from the World Development Indicators (WDI), enabling the study of numerous economic and social variables unavailable in other international datasets which also include health.
METHODS
Data
WDI 200339 is a cross-national database of >500 time-series indicators (variables) for 207 countries and 18 country groups, covering 1960–2001, for which data are available. The 94 indicators include size, growth and structure of a country’s population; health; labour force; education and illiteracy; natural resources and land usage; income and poverty; expenditure on food, housing, fuel and power; transport and communication; urbanisation and pollution; national accounts, debt and trade; exchange rates, prices, taxation, levels of aid; and healthcare and education. The World Bank also classifies countries on the basis of annual gross national product per capita. As far as possible, data included in the WDI conform to the United Nations System of National Accounts and the methods of specialised agencies of the United Nations.
Measures
The two primary outcome measures in our study were under-five mortality (the probability that a child born in the indicated year would die before age 5 years, using current age-specific mortality data) and adult mortality (the probability of dying between ages 15 and 60 years, using current age-specific mortality data for men between these ages). We did not choose life expectancy as our main dependent variable, because it applies to a hypothetical cohort born each year and does not reflect real-life cohorts at different ages. It also combines adult, infant and child mortality, precluding assessment across the life span.
The main covariates in our bivariate and multivariate analyses stem from several key topics. Gross national income (GNI) per capita, purchasing power parity (PPP; $) is (the sum of gross national product and the terms of trade adjustment) converted to international dollars (using PPP rates). The population below $1 a day is the percentage of the population living on <$1.08 a day at 1993 international prices. The percentage living in the lowest income quintile is the income share that accrues to subgroups of the population indicated by quintiles. The Gini Index measures the degree of income inequality within a country.39
Adult illiteracy rate for men or women is the percentage of people aged ⩾15 years who cannot, with understanding, read and write a short, simple statement about their everyday life. Total health expenditure is the sum of public and private health expenditure (preventive and curative health services, family planning, nutrition and emergency medical aid). Private health expenditure includes out-of-pocket spending by households, private insurance, spending by non-profit institutions serving households (other than social insurance) and direct service payments by private corporations. Public health expenditure includes government spending (central and local), external loans and grants, and social health insurance funds. Doctors are graduates of any faculty or school of medicine who are working in the country in any medical field. Hospital beds include those for acute or chronic care in public, private, general and specialised hospitals and rehabilitation centres. Outpatient visits per capita is the number of visits to healthcare facilities per capita, including repeat visits.39
As per disease-prevention strategies in environmental health, an improved water source is considered to be a household connection, public standpipe, borehole, protected well or spring, or rainwater collection. Access to water is the availability of ⩾20 l/person/day from a source within 1 km of the dwelling. Improved sanitation facilities (private or shared, not public) are those that permit excreta to be disposed away from contact with humans, animals and insects, ranging from protected pit latrines to flush toilets.39
For health conditions and interventions, the incidence of tuberculosis is the estimated number of new cases (pulmonary, smear positive, extrapulmonary). The prevalence of HIV is the percentage of the population infected. The child immunisation rate is the percentage of children <1 year adequately vaccinated for measles (one dose) and diphtheria, pertussis and tetanus (three doses). The prevalence of smoking is the percentage of men and women >18 years (15 in some countries) who smoke cigarettes.39
Rural population refers to the percentage of the total population living in rural areas in a given country. Electric power consumption measures the production of power plants and heat/power plants excluding transmission, distribution and transformation losses.39
Household final consumption expenditure per capita is the market value of all goods and services purchased by households. Gross domestic product (GDP) at purchasing power prices is the sum of the gross value added by all resident producers in the economy and product taxes (excluding subsidies) not included in the valuation of output.39 Trade in goods as a share of GDP is the sum of merchandise exports and imports divided by the value of GDP ($US). Food production and consumption price indices measure changes in prices.
Total debt service is the sum of principal repayments and interest paid in foreign currency, goods or services on long-term debt, and interest paid on short-term debt and repayments to the International Monetary Fund.
Finally, military expenditures include all current and capital expenditures on the armed forces, including peacekeeping forces, defence ministries and other relevant government agencies, paramilitary forces and military space activities.39 For information and technology, internet users are people with access to the world wide web. Personal computers are those designed to be used by one person.
As missing data was an issue for all covariates, we followed the World Bank recommendations regarding the selection of variables and years, with a 5-year range, using the most recent data available (1996–2000).
Statistical analysis
As we were interested in measuring inequalities in health between population groups, as opposed to measuring interindividual health inequalities, we wanted to identify groups, assess intergroup disparities and examine risk factors associated with such disparities. To group countries by mortality, we used cluster analysis, which tests whether individual members (countries in our analysis) within clusters are similar to each other (homogeneous or compact with respect to certain characteristics) and different from members of other clusters (with respect to the same characteristics). Cluster analysis is a statistical method well suited for classifying data into cluster groups,40,41 and has several basic science and medical applications, such as the classification of elements of the periodic table and of diseases for research on aetiology and treatment.40,41 We used the K-means clustering technique to minimise variability within clusters and to maximise variability between clusters. For adult and child mortality in 2000, the 3-means cluster analysis produced more discriminatory results than 2-means or 4–5-means clusters.
We especially wanted to identify a least healthy (worse-off) group, a most healthy (better-off) group and other groups in between. In choosing groups for comparison, we tried to balance the need to demonstrate the magnitude of health inequality across groups with the need to have groups large enough to produce significant results.17,24 Should it be desirable to disproportionately weigh the improvements in health among the least healthy (and, to a certain extent, those with mid-level health), more than improvements among the healthiest,9,12,17 our analyses could be extended to assess shortfalls in health achievement (mortality), using the most healthy as the reference group.9,12,42,43
We assessed overall sample characteristics using univariate analysis. Bivariate analysis examined unadjusted relationships between mortality groups and major country-level factors: poverty and income; education; health expenditure; disease prevention; health risk factors; environment; energy production and use; economy; trade; monetary; external debt; military spending; communication; and information technology. χ2 tests allowed comparisons among groups (categorical variables). Bivariate correlations between continuous variables were analysed with the t test. Analysis of variance among multiple groups evaluated differences in unadjusted mean values between each pair of means for each group, and confidence intervals (CIs) were calculated for each group mean to permit groupwise comparisons.
Multivariate analyses were carried out using multinomial logistic regression. We stratified adult mortality into three levels per 1000: 80–250; 258–449; and 460–725. The strata for under-five mortality for 1000 were 3.9–60; 66–156; and 160–316. Multinomial logistic regression analyses were used to estimate associations between the mortality groups and independent variables; to avoid potential collinearity, we used the stepwise procedure of entering several variables at a time. Separate sets of models were estimated for under-five and adult mortality. In each case, the healthiest group, group 1, was the reference group. For each predictor in the model, we estimated one parameter that represented the effect of a 1-unit increase on the logit (log odds) scale (a 10-unit increase produced little change in the log odds). Our first model included only income, education, health expenditure, disease prevention and health risk factor variables. In the second model, we added indicators on the environment, economy, monetary, communication, and information technology. Multinomial regression was validated using the Wald test and log likelihood ratios. Two-tailed p values or 95% CIs are reported for all analyses. We used SAS, Stata and EXCEL statistical software for analyses.
RESULTS
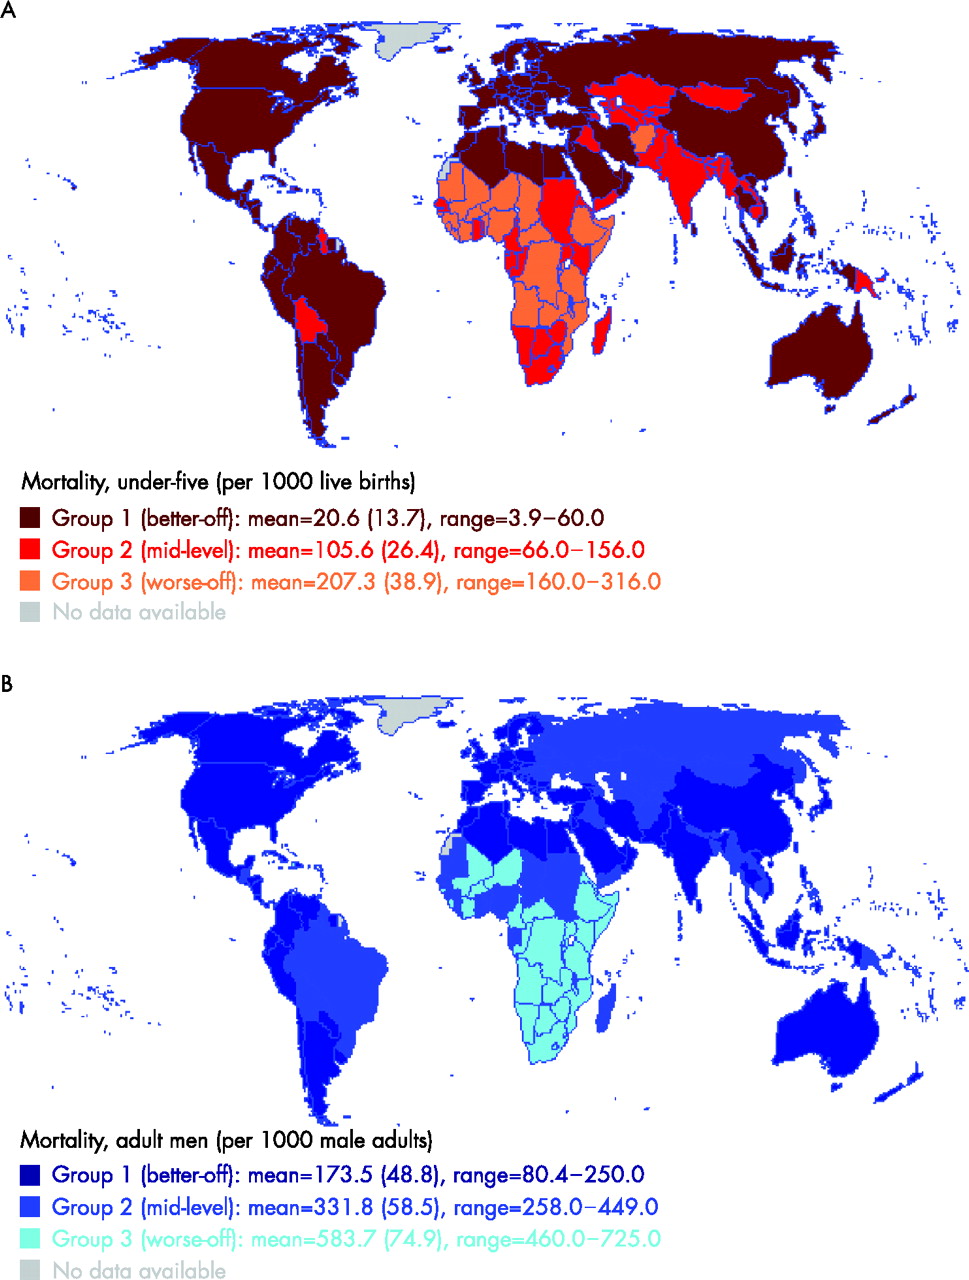
Appendix A (available at http://jech.bmjjournals.com/supplemental) shows data on under-five and adult mortality by country. Cluster analysis identified three distinct groups for under-five mortality. Group 1 (lowest mortality) included 117 countries with a mean mortality per 1000 live births of 20.6 and a range of 3.9–60 (fig 1A). Group 2 (mid-level) included 45 countries with a mean mortality per 1000 live births of 105.6 and a range of 66–156. Group 3 (highest mortality) included 23 countries with a mean mortality per 1000 live births of 207.3 and a range of 160–316.

(A) Global distribution of disparities in under-five mortality. (B) Global distribution of disparities in adult mortality (men).
Cluster analysis also identified three distinct categories for adult mortality (men; fig 1B). Group 1 included 111 countries with a mean mortality per 1000 adult men of 173.5 and a range of 80.4–250. Group 2 included 49 countries with a mortality per 1000 adult men of 331.8 and a range of 258–449. Group 3 included 29 countries with a mean rate per 1000 adult men of 583.7 and a range of 460–725.
Figure 1A shows that the 23 countries with the highest under-five mortality are in western and sub-Saharan Africa and Afghanistan. Figure 1B shows even more strikingly that the 29 countries with the highest adult mortalities are also in western and sub-Saharan Africa.
Figure 2A shows time-series trend data on adult mortality. Between 1960 and 1990, all three groups experienced a decline in mortality. Since 1990, however, adult mortality has actually increased for the worse-off group. Figure 2B shows the rate of change in adult mortality between 1960 and 2000. It shows that gaps in mortality are becoming wider and that the rate of change in mortality has become markedly different, especially among the countries with the highest mortality, which have switched from a reduction to an increase. Between 1990 and 2000, adult male mortality increased by roughly 30% among the worse-off countries, whereas it stayed roughly the same or even fell slightly for the better-off and mid-level groups.
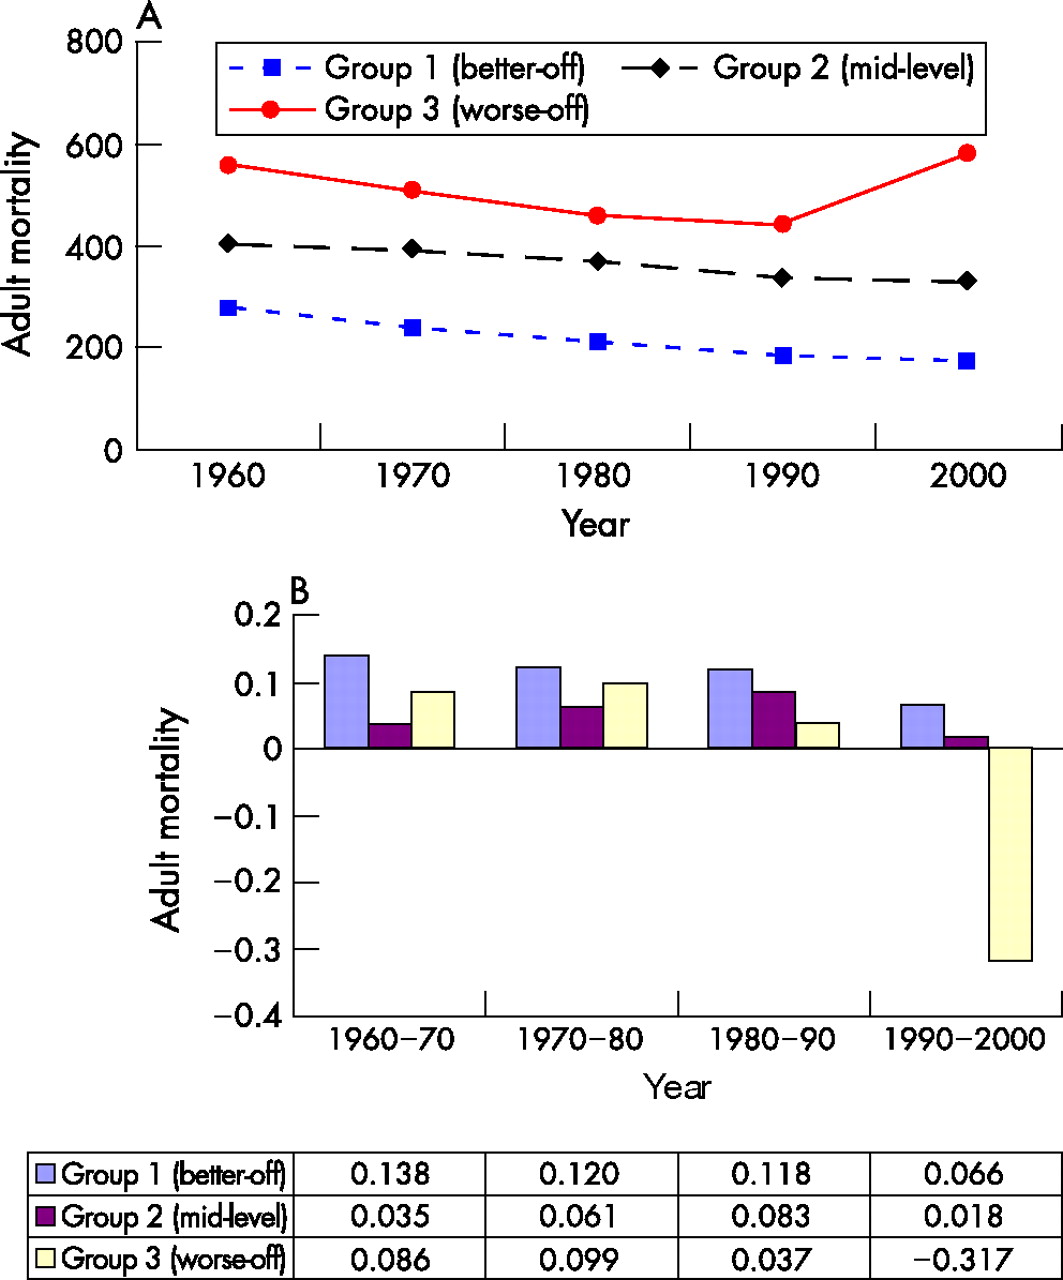
(A) Time-series trend of adult mortality. (B) Rate of change in adult mortality.
Figure 3A shows time-series trend data on under-five mortality between 1960 and 2000. Under-five mortality declined for all three groups. Figure 3B shows rates of change in under-five mortality between 1960 and 2000. The rate of change for the worse-off group slowed down more (from 0.124 between 1960 and 1970 to 0.056 between 1990 and 2000) than, for example, the rate for the better-off group (from 0.292 from 1960 to 1970 to 0.326 between 1990 and 2000). The worse-off group therefore made slower progress in reducing under-five mortality than the better-off group.

(A) Time-series trend of child mortality. (B) Rate of change in child mortality.
Table 1 compares the country indicators of the adult and under-five mortality groups. For under-five mortality, the worse-off group had a mean GNI per capita in international dollars of $1011 as compared with $12 086 for the better-off group—a 10-fold difference. This relationship held true for GNI per capita calculated by the Atlas method as well. Additionally, the percentage of the population living on <$1 per day was considerably greater in the worse-off group (53%) than in the better-off group (8%). Educational outcomes were also unequal, with a fourfold difference in the female illiteracy rate (63% for the worse-off group v 14% for the better-off group). Differences in health expenditures and risk factors showed considerably more investment in overall spending ($650 v 10$ per capita), human resources such as doctors (7 v 1 per capita) and health-related capital (eg, 5 v 0.7 hospital beds per capita) for the better-off as compared with the worse-off group. An interesting finding was the degree of difference in the consumer price index (CPI) between the worse-off (CPI of 25 035) and better-off (CPI of 251) groups, indicating the influence of considerable instability and inflation in general prices. The better-off group fared much better on all measures of communication (fixed line and mobile phone subscribers) and information technology (computer and internet).
Country indicators by mortality groups
In general, these relationships held true for the adult mortality groups (table 1). The better-off group had higher per capita income; less poverty (percentage of the population living on <1$ per day); better educational outcomes, more expenditure on health and human and physical resources; better access to sanitation and safe water; lower rates of diseases such as HIV/AIDS and tuberculosis; higher percentage of GDP in trade; and greater access to communication and information technology. For both indicators of mortality, therefore, the better-off groups of countries had better resources, investments and outcomes than the worse-off groups, suggesting that multiple factors influence a country’s level of health.
Table 2 presents unadjusted and adjusted odds ratios (ORs) for associations between country indicators and mortality groups. For adult mortality (table 2), associations among several independent variables (GNI per capita, PPP ($); adult illiteracy rate for men and women; health expenditure per capita ($) total; improved water source and improved sanitation facilities; and incidence of tuberculosis) and the comparison between the worse-off and better-off groups lost significance after adjustments for all other variables in the table. The exception was public health expenditure (%; adjusted OR 2.3; 95% CI 0.06 to 8.8) and prevalence of HIV infection (adjusted OR 18.6; 95% CI 0.30 to 1135), which approached borderline significance.
Multivariate logistic regression relating country indicators to mortality groups
A similar trend was found for under-five mortality (table 2): associations between all the independent variables and the comparison between the worse-off and better-off groups were no longer significant after adjustments for all other variables shown in the table. The exception was seen in the comparison between the mid-level and better-off groups for total health expenditure per capita ($; adjusted OR 0.89; 95% CI 0.77 to 1.02), incidence of tuberculosis (adjusted OR 1.01; 95% CI 0.99 to 1.03) and prevalence of HIV (adjusted OR 2.24; 95% CI 0.75 to 6.71) approaching borderline significance. This logistic model had fairly good predictive power, with a pseudo-R2 of 0.65 (the pseudo-R2 is the log likelihood on a scale where 0 corresponds to the constant-only model and 1 corresponds to perfect prediction for discrete models).44
What this paper adds
-
This paper deals with gaps in the literature on health inequalities in work on intercountry inequalities, on the use of a threshold or norm (established by clustering techniques) and on the identification of “health gaps” for development policy purposes.
-
Most of the prior work has focused on international comparisons of intracountry inequalities, with the use of the application of econometric techniques in inequality assessment to health as a variable (Gini coefficient, etc).
DISCUSSION
To our knowledge, this is the first systematic study of cross-national inequalities in adult and child mortality to identify mortality groups (most healthy, least healthy, mid-level health) by cluster analysis, and examine risk factors associated with inequality in mortality. We found that inequalities in child and adult mortality are wide, are growing and are influenced by several economic, social and health-sector variables. On average, groups of countries with high adult or under-five mortality also had lower average incomes, more extreme poverty, lower levels of investment in human and physical resources, higher inflation and less trade, less effective disease prevention, and worse educational outcomes and health risk factors. Global health inequalities should be studied in conjunction with levels of development and social and economic inequalities. Global efforts to deal with inequalities in health require attention to the worse-off countries, geographic concentrations and multidimensional approach to development.45
Policy implications
-
Stratifying countries into mortality groups of different levels of health, which to our knowledge has yet to be carried out, better enables multilateral institutions like the World Health Organization and the World Bank to devise policies and interventions to reduce the gap in mortality between countries.
-
This type of study is particularly relevant for organisations such as the World Bank, which work in several policy domains outside the health sector.
-
The study uses data from the World Development Indicators (WDI), enabling the study of numerous economic and social variables unavailable in other international datasets which also include health.
A particularly disturbing finding from this study was that countries with high under-five mortality are making slower progress than countries with lower rates. Moreover, gaps in adult mortality are becoming wider and countries with the highest mortality have actually shifted from reduced mortality to increased mortality. Studies comparing inequalities in child health within countries have found similar trends.38 This finding suggests that the widening inequality in both child and adult mortality may reflect of growing gaps in living conditions and standards between geographical areas and between rich and poor countries.
Our study showed that the countries with the highest adult and under-five mortality have multiple deprivations. For example, they have a fourfold higher percentage of people living on <$1 per day; more than a twofold higher female illiteracy rate, and less than one sixth the GNI per capita in international dollars; and one fifth the outpatient visits, hospital beds and doctors as their low-mortality counterparts. The gap in total expenditure on health per capita is even greater: a 20-fold difference between adult mortality groups and a 50-fold difference between child mortality groups. Additionally, this study confirms what is known about the HIV/AIDS epidemic, as countries with high adult mortality had a higher prevalence of HIV infection (OR per 1% increase 18.6; 95% CI 0.3 to 1135). It is therefore important to deal with health needs on multiple fronts with an integrated set of strategies, especially in western and sub-Saharan Africa and Afghanistan. These results are particularly relevant for multinational organisations, such as the World Bank, which work in multiple policy domains affecting health inequalities.
Our study has some limitations.
-
Although the World Bank reviews social and economic indicators for reliability and validity, the definitions and methods underlying indicators can vary from country to country and over time. Data may also be collected differently in different countries. Therefore, we have focused on broad trends rather than small differences among indicators.
-
Social indicators may refer to different years. Because social changes tend to occur slowly and many factors contribute to a single indicator, the World Bank does not generally recommend that values be imputed for missing data.
-
Although WDI data are collected from supposedly authoritative sources, many statistical systems in developing economies are weak, which affects the availability, reliability and margin of error associated with individual data. However, the WDI dataset is considered one of the most reliable and valid of all international databases that include health, social and economic indicators.
-
We have tried to control for multicollinearity in our study, but as commonly recognised in multivariate modelling, we note inevitably high levels of correlations between variables, in some cases resulting in wide CIs.
-
Numerous historical and political factors, including coloniser status and years of colonisation, composition of military power, political orientation and political total years of dictatorship, and human rights are not included in the dataset but may influence both health and development.
In conclusion, this study identified three distinct mortality groups worldwide (worse-off, better-off, mid-level) and showed that key associated factors to health disparities among countries include both factors within the health sector and factors related to a country’s overall level of development. Thus, this analysis could be extended by multinational development actors to assess shortfalls in mortality using better-off as the reference group. It is important to note, however, that global health policy focused on narrowing the mortality gap between countries is not simply a matter of poverty reduction or development. It requires a commitment to social justice.46–48
Acknowledgments
We thank Edward Bos and Sulekha Patel of the World Bank for clarification of data and Yeunsun Chung of the Department of Statistics, Gyeongsang National University and Sukja Park of the Korea National Statistical Office for their assistance with data analysis. We also thank Susan Gatchel, Kimberly Hannon and Linda Sage for administrative and editing assistance. Portions of this article were presented as the 2005 Labelle Lecture Dr Ruger gave at McMaster University.
REFERENCES
Supplementary materials
Files in this Data Supplement:
Footnotes
-
H-JK is supported in part by a grant (KRF-2002-003-B00142) from the Korea National Research Foundation. JPR is supported in part by a Career Development Award (grant number K01DA01635801) from the US National Institutes of Health.
-
Competing interests: None declared.
Linked Articles
- In this issue