Article Text

Abstract
Study objective: To assess relations between socioeconomic status and local air quality, and combined effects on respiratory health, in the context of environmental and health inequality.
Design: Data on people taking part in the Health Survey for England were attributed with a small area index of air pollution using annual mean concentrations of nitrogen dioxide, sulphur dioxide, benzene, and particulates (PM10). Regression models were used to measure associations between social class, air quality, forced expiratory volume in one second (FEV1), and self reported asthma.
Participants: Participants aged 16–79 in the Health Survey for England 1995, 1996, and 1997.
Main results: Urban lower social class households were more likely to be located in areas of poor air quality, but the association in rural areas was, if anything reversed. Low social class and poor air quality were independently associated with decreased lung function (FEV1), but not asthma prevalence, after adjustment for a number of potential confounders. Social class effects were not attenuated by adjustment for air quality. In men, a differential effect of air pollution on FEV1 was found, with its effect in social classes III to V about double that in social classes I and II (p value for interaction = 0.04). This effect modification was not seen for women.
Conclusions: Further evidence of environmental inequity in the UK is provided. The association between FEV1 and local air quality is of similar magnitude to that with social class, and the adverse effects of air pollution seem to be greater in men in lower social classes.
- SES, socioeconomic status
- HSE, Health Survey for England
- air pollution
- FEV1
- environmental equity
- health survey for England
Statistics from Altmetric.com
ENVIRONMENTAL EQUITY AND ENVIRONMENTAL JUSTICE
Environmental equity can be thought of as being concerned with the equitable distribution of environmental risk, while environmental justice includes consideration of overall abatement of environmental risks and implementation of just procedures and systems to prevent inequity from arising or intensifying.1 The environmental justice debate in the USA has been explored at length, from beginnings in the civil rights movement,2 through a Presidential Executive Order in 1994,3 to a growing body of research.4–8
The issue is less well developed in the UK, but has generated research and policy interest since the late 1990s.9 One of the first studies, conducted by environmental pressure group Friends of the Earth, found that the largest polluting industrial facilities licensed by the Environment Agency were most likely to be found in low income areas.10 Much of the UK based research since that time has found similar results with regard to disproportionate distribution of potential environmental health risks in deprived areas. A number of studies have investigated the spatial distribution of ambient air pollution (local atmospheric concentrations of particular substances).11–14 The issue has rapidly attained recognition in the policy domain; the Environment Agency’s position statement on environmental inequalities states that “…those living in the most deprived parts of England experience the worst air quality”.15
AIR POLLUTION AND RESPIRATORY HEALTH
Since the massive public health impacts of the 1950s London smogs,16 a substantial literature on a variety of adverse health effects attributable to short term and long term air pollution exposure has developed.17 Along with severe impacts such as increased mortality,18 more subtle effects on respiratory health have been found, particularly by a well designed series of studies set in Switzerland.19 These studies, and others, of long term exposure to pollutants such as nitrogen dioxide (NO2) and particulates have tended to show adverse effects on respiratory symptoms, although there is unclear evidence of impacts of outdoor air pollution on asthma incidence.20–22
Until recently, impacts of environmental inequity on public health had been given little consideration.23 Socioeconomic status (SES) is usually “adjusted away” by studies attempting to measure the effects of air pollution on health, although recent studies have found evidence of effect modification, with low SES associated with greater health impacts of air pollution.24,25
This study extends the UK environmental equity agenda by investigating associations between ambient air quality, SES, and respiratory health using data from the Health Survey for England (HSE). The analysis is concerned not simply with the association between air quality and respiratory health, but explicitly with associations between SES and air pollution exposure, and their combined health effects.
METHODS
The HSE has been carried out since 1991 for the Department of Health.26 The annual survey captures information for representative samples of the adult population of England, and monitors progress toward health targets. Data for people and households from the HSE were downloaded from the UK Data Archive.27 Lung function measurements were made in the 1995, 1996, and 1997 surveys, and data from these three years were combined.28–30 Lung function measurements included forced expiratory volume in one second (FEV1), a general indicator of lung function. A variable for maximum FEV1 from a number of tests, excluding “blows” that were technically unsatisfactory, was used.
Other variables included age, sex, height, body mass index (BMI), smoking status, household passive smoke exposure, inhaler use in the previous 24 hours, and whether a doctor had ever diagnosed asthma. Social class of head of household (SCHoH) was available as a measure of SES. Ambient air quality data consisted of 1996 annual mean pollutant concentration estimates for a national one km grid, produced by the National Environmental Technology Centre for the UK government. These data were used to construct a small area air quality index based on nitrogen dioxide (NO2), particulate matter (PM10), sulphur dioxide (SO2), and benzene. A geographical information system was used to attribute the pollution data to 1991 census wards. For each ward, the index was calculated by summing the ratio of pollutant concentration to relevant national/international air quality guideline value across the four pollutants. A ward with annual mean concentration of each pollutant equal to its guideline value would score “4” on the index. Detailed methodology has been described elsewhere.14 Table 1 gives descriptive statistics for the four pollutants and the index across all wards. An air quality index using the same methodology forms a component of the “Living Environment” domain of the English index of multiple deprivation 2004.31
Descriptive statistics for the four air pollutant annual mean concentrations and the composite index across all wards
The most detailed geography available on the HSE data is district health authority, of which there were around 100 in the 1990s. This geographical resolution is too coarse for small area analysis. A categorical version of the air quality index—quintiles across all wards—was therefore supplied to the original survey researchers, the National Centre for Social Research (NatCen). Based on residential postcode, each HSE participant was attributed by NatCen with the air quality index quintile for their residential ward. Participants’ identifying codes and attributed index values were then returned and merged back into the main datasets. Through this mechanism, the detailed geography could be used without compromising confidentiality.
The analysis to estimate the association between the air quality index and social class was conducted for all households. In an ideal situation, the distribution of the continuous air quality index could be compared across households by social class. To measure this association using air quality quintiles, they were reclassified into a binary index, comparing “good” air quality (quintiles 1–3) with “poor” air quality (4–5). Logistic regression was then used to estimate the effect of social class on the odds of being in the “poor” air quality category. Models were assessed separately for urban and rural areas using a ward urban-rural indicator, as urban-rural differences had been seen previously.14
Ordinary least squares regression models were used to estimate the effects of social class and air quality on FEV1, separately for men and women aged 16 to 79. FEV1 values were standardised using regression analysis32 to calculate expected values based on age, height, and sex in the “never smoked” subset of participants:

Standardised FEV1 was calculated as the ratio of each participant’s actual maximum FEV1 measurement to their expected FEV1 given their age, sex, and height. This value was then used as the dependent variable in models, with the advantage of producing easily interpreted regression coefficients indicating the percentage difference from expected FEV1. Smoking status, passive smoking, BMI, rurality, previous asthma diagnosis and inhaler use were also considered as potential confounders. Three initial models were run; (a) social class, (b) air quality index, and (c) both social class and air quality, all adjusted for confounders. Models were also constructed to examine whether or not social class modified the effect of air quality, and tests for interaction were performed. A similar series of models using logistic regression were constructed to measure associations between social class, air quality, and self reported lifetime asthma prevalence.
RESULTS
Sample description
Table 2 describes the 39 251 HSE participants in 1995–97 aged 16–79, and 26 426 households. A large proportion of people (16.2%) had no valid FEV1 measurement, so a logistic regression model was constructed to investigate whether “missingness” was associated with any variables of interest. After reciprocal adjustment, the odds of missing FEV1 value were higher for: people aged over 70 (compared with 16–19 year olds, OR = 2.19, 95% CI 1.32 to 3.64, p = 0.002); women (OR = 1.54, 95% CI 1.31 to 1.81, p<0.001), people in lower social class households (social class V compared with class I: OR = 1.82, 95% CI 1.71 to 2.84, p = 0.008), and people in poor air quality areas (quintile 5 compared with quintile 1: OR = 2.52, 95% CI 1.64 to 3.87, p<0.001).
Distribution of health survey for England households and participants across variables of interest
Air quality inequity
Table 3 shows the cross tabulation of households by air quality index and social class, with odds ratios from logistic regression. This crude analysis supports assertions of environmental inequity for urban households, with percentage of households in the poor air quality category increasing with decreasing social class. These urban households account for 87% of households with non-missing values. For the remaining households, the relation appears inverted, with higher social class households more likely to be located in areas of higher air pollution (although this is based on a small number of households and is compatible with sampling variation).
Percentage of households and odds ratios by social class of head of household and ambient air quality index (health survey for England, 1995–97)
Respiratory health inequalities and air quality
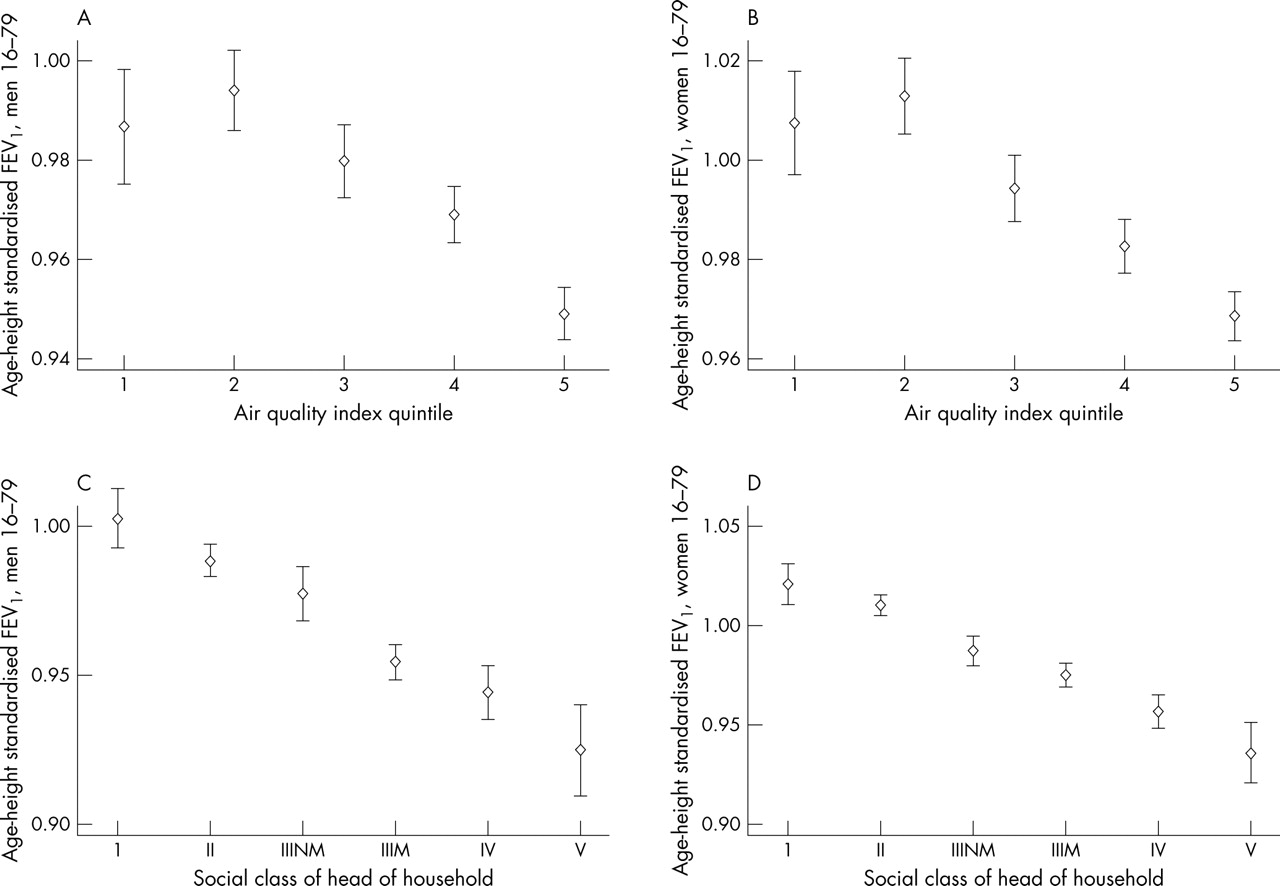
Figure 1 illustrates the associations between standardised FEV1, air quality, and social class. These suggest that lower social class and poorer air quality are both associated with decreasing lung function, and associations on this crude basis are of a similar order of magnitude.

Mean standardised FEV1 with 95% confidence intervals by ambient air quality index quintile for men (A) and women (B) and social class of head of household for men (C) and women (D).
Social class was reclassified for regression analyses, so that samples in sub-groups of interest were of equivalent size. The “high” social class (I and II) group includes 38% of the study population, and the “good” air quality group includes 40%. While this simplifies the data and means that dose-response gradients are not measured, it ensures that the relative effects of social class and air quality can be compared. Table 4 shows that men in the low social class group had average FEV1 2.7% lower (95% CI 2.1 to 3.4%) than men in the high social class group, after adjustment for confounders. Table 5 shows the same effect size for women. Effects associated with poor air quality compared with good air quality were a reduction of 2.3% (95% CI 1.6 to 3.0%) for men and 1.9% (95% CI 1.3 to 2.6%) for women. After reciprocal adjustment (model c), effect estimates for both social class and air quality were virtually unchanged.
OLS regression model results for male age-height standardised FEV1 by social class of head of household, ambient air quality index quintile and both adjusting for potential confounders
OLS regression model results for female age-height standardised FEV1 by social class of head of household, ambient air quality index quintile and both adjusting for potential confounders
Other risk factors associated with reduced FEV1 were smoking status, household passive smoke exposure, asthma diagnosis, BMI <20, and inhaler use in the previous 24 hours. Rural area was initially associated with slightly higher FEV1 but this effect was attenuated after adjustment for air quality and social class.
For men the effect of poor air quality was twice as big (−2.8%, 95% CI −1.9 to −3.7, p<0.001) among those from low social class households compared with those from high social class households (−1.4%, 95% CI −0.3 to −2.4, p = 0.009; p value for interaction = 0.04). For women however, the effects were almost identical regardless of social class (I–II: −1.8%, 95% CI −0.8 to −2.8, p<0.001; III–V: −1.8%, 95% CI −1.0 to −2.7, p<0.001; p value for interaction = 0.78).
As assessment of smoking was fairly crude, final models (model (c) in tables 4 and 5) were repeated for “never smoked” participants, to assess whether residual confounding attributable to inadequately measured smoking may explain the subtle effects associated with poor air quality. These models showed “never smoked” men in poor air quality areas to have FEV1 3.7% (95% CI 2.5 to 4.9, p<0.001, n = 3468) lower than those in good air quality areas, and the equivalent reduction for women was 2.4% (95% CI 1.3 to 3.4, p<0.001, n = 5545). These figures suggest that confounding attributable to inadequate smoking control is unlikely to explain the observed associations, and perhaps suggest that effects may be more profound among non-smokers (although this was not hypothesised in advance).
Logistic regression models constructed to investigate the separate and mutually adjusted effects of air quality and social class on asthma prevalence (in terms of “ever” diagnosis) did not find any increase in odds with either risk factor (see appendix, available on line http://www.jech.com/supplemental).
DISCUSSION
This study has found that, in general, lower social class households live in wards with worse air quality, and hence there is environmental inequity. However, this generalisation is not true for all areas as more rural households showed, if anything, a reverse gradient. This situation has been noted previously, and hypothesised to be related to rural areas including wealthier commuter populations proximal to conurbations and main roads, and more deprived populations in more remote, less polluted, areas.14 From a public health perspective, air quality showed a positive association with adult lung function (worse air quality was associated with worse function) for men and women, although no pattern was seen with self reported asthma. The association between air quality index and lung function was not attenuated by adjustment for social class, smoking status, or other potential confounders. While the absolute effects of poor air quality seemed comparatively modest, they were similar to those seen using adult social class, comparing roughly equal group sizes. Despite observing associations between air quality and lung function, the social gradients in lung function by adult social class (after adjusting for other confounders) were not attenuated after adjustment for air quality.
There are several methodological issues than need to be considered when interpreting our results. The use of a categorised air quality index was essential for the HSE researchers to ensure that we could not identify the ward of residence of participants. This limits analyses to consider air quality in terms of artificially introduced “thresholds”, rather than in a linear fashion that may be more appropriate. Additionally, air quality around the residence of participants at time of interview is assumed to be a reasonable estimate of outdoor air pollution exposure. Bias attributable to exposure misclassification is therefore possible, given that people do not spend all of their time breathing the air at their home location, and the HSE does not include information on how long participants have lived at their present address. This is a common issue in research on air pollution and health, and so long as misclassification is random, it will lead to a dilution of effect estimates. Improvements in exposure estimation have indeed tended to lead to a greater likelihood of finding an association.22
What this paper adds
What is already known on this subject?
-
There is evidence from the UK, and elsewhere, that poorer populations are often subject to poorer local environmental conditions, including poor air quality.
-
Long term air pollution exposure is associated with adverse effects on respiratory function.
-
Lower socioeconomic status is associated with worse respiratory function.
What does this study add?
-
People in lower social class households in England are more likely to live in areas of poor air quality in urban areas, as measured by a national small area environmental index, but this does not apply to rural areas.
-
Using the same index, residence in an area of poor air quality is associated with decreased lung function, but not asthma, and the effect is similar in magnitude to that seen with socioeconomic status.
-
The effects of air quality do not explain the adult social class gradients, which probably reflect cumulative life course disadvantage.
-
For men, there was a suggestion of an interaction between air quality and social class on respiratory function.
Bias may have also been introduced because of missing FEV1, which was associated with both social class and air quality. If such people had worse lung function, then effect estimates should have been greater. The HSE documentation shows that pregnant women and people who had had recent abdominal/chest surgery or had been admitted to hospital for heart complaints or stroke were excluded from lung function measurements. While there is no reason to think that pregnant women would have worse lung function, it is plausible that those people with other morbidity did have worse lung function than average.
The use of a composite air quality index means that this study is unable to show associations between specific pollutants and respiratory function. However, as the pollutants under consideration tend to be closely associated, it is perhaps more realistic to consider them together rather than separately. One issue is that the air quality index excludes ozone, which has been linked with asthma incidence.33 Ozone was excluded because it exhibits very different characteristics and geographical patterns to the other pollutants, and has different environmental equity implications. It is formed as a secondary product by the action of sunlight on other pollutants, it travels long distances, it is scavenged by nitric oxide, and highest levels tend to be distant from source activities. Ozone concentrations tend to be highest in rural areas, and low concentrations in urban areas and near major roads can point to high levels of other pollutants. The index used here may therefore not identify air quality problems particular to rural areas, although overall air quality here does tend to be better. Further to these issues, indoor air exposures may be more important than outdoor exposures,34 although there is evidence that indoor pollution can be directly related to outdoor pollution.35
The lack of association between air quality and asthma is not inconsistent with previous studies, which have produced mixed results. However, there is a tendency for studies with better exposure estimation, especially those looking at ozone, to find an association with asthma incidence. Given that ozone is not considered here, and that exposure estimation errors are probable with respect to long term exposure, the lack of association with lifetime asthma prevalence is perhaps unsurprising.
It is also perhaps unsurprising that the air pollution measure does not attenuate the association between adult social class and lung function. This is presumably because adult social class acts as a proxy for many exposures acting over the life course from pre-natal lung development, post-natal infections, childhood growth and development, and adult smoking behaviours.36 Clearly, contemporary air quality may be acting as a proxy for past exposures, as these are likely to be correlated, and past levels of air pollution would have been much higher than those experienced today.
While the results suggest that social class differences in respiratory function are not explained by air pollution inequity, there was some weak suggestion that, for men, poor air quality interacted with low social class, showing twice the effect seen for men in high social class households. This interaction must be treated with some caution as we did not a priori predict any sex differences, and may have occurred by chance. However, a study in Canada found similar effect modification (although not differentiated by sex) and suggested three possible mechanisms: that (a) low SES was associated with material deprivation and in turn with increased susceptibility to the health effects of exposure; (b) low SES was associated with workplace pollutant exposures, which combined with residential exposure to create a greater effect; (c) low SES was associated with lower mobility, and hence lower error in exposure assessment, reducing bias toward the null.24 These possible explanations also apply here, each of which has important, and different, policy implications.
CONCLUSIONS
Using individual level data combined with a small area air quality index, this study shows that residence in an area with poor air quality is associated with decreased lung function in adults after adjustment for social class and other potential confounders, but not with lifetime asthma incidence. Additionally, for men, low social class may be associated with a greater impact of poor air quality on respiratory health. From a health policy perspective, this is an example of the “inverse air law”, analogous to the inverse care law,37 so that people with the worst lung function tend to live in areas with the worst air quality, and the health effects of air pollution seem to be greatest among those (men) in lower social classes. From an environmental justice perspective, remedial action should be delivered through public health, environmental, and social policy, and local planning processes.
Acknowledgments
Thanks to Elise Whitley, who jointly supervised the doctoral research on which this paper is based, and Rebecca Teers and Richard Boreham at the National Centre for Social Research, who organised anonymous attribution of ward level environmental data to HSE participants. Thanks also to Jan Rigby for comments on a draft.
REFERENCES
Supplementary materials
The appendix is available as a downloadable PDF (printer friendly file).
If you do not have Adobe Reader installed on your computer,
you can download this free-of-charge, please Click hereFiles in this Data Supplement:
- [view PDF] - Appendix: Results from logistic regression models predicting �ever� asthma diagnosis (all models adjusted for age in 10 year bands).
Footnotes
-
Funding: Ben Wheeler received a Medical Research Council PhD studentship that enabled him to undertake this work.
-
Competing interests: none declared.
Linked Articles
- In this issue