Article Text

Abstract
Background Less attention has been paid to mortality trends across income groups than those measured by other socioeconomic indicators. This study assessed the change in life expectancy by income over 20 years in the Finnish general population.
Methods Life expectancy among 35-year-olds by household income quintiles was studied. Change in life expectancy from 1988–92 to 2003–7 was decomposed by age and cause of death. The dataset contained 754 087 deaths by oversample of 80% of all deaths during the period.
Results The gap in life expectancy between the highest and the lowest income quintiles widened during the study period by 5.1 years among men and 2.9 years among women, and in 2007 it stood at 12.5 years and 6.8 years, respectively. Stagnation in the lowest income group was the main reason for the increased disparity for both sexes. Increasing mortality attributable to alcohol-related diseases and increasing or stagnating mortality for many cancers, as well as a slower decline in mortality due to ischaemic heart disease among men in the lowest income quintile, were the most significant factors increasing the gap.
Conclusions The increasing gap in life expectancy was mostly due to the stagnation of mortality in the lowest income quintile and especially because of the increasing mortality in alcohol-related diseases. The increase in disparity may be more extreme when using income instead of occupational class or education, possibly because income identifies a lower and economically more deprived segment on a social hierarchy more clearly. The results identify a clear need to tackle the specific health problems of the poorest.
- Health inequality
- income
- life expectancy
- mortality trend
- mortality si
- social inequalities
- trends
Statistics from Altmetric.com
Growing inequalities in mortality between socioeconomic groups have been reported in several European countries in recent decades.1 2 Most previous studies exploring trends in health inequality use occupational social class1–4 or level of education,1 5 6 whereas income is used less frequently.6–10 Yet, a substantive advantage of applying income in analyses of trends in mortality differentials is that it directly identifies groups of people in the most economically disadvantaged position, such as the poor and the unemployed. The fact that income can be measured on a continuous scale makes it possible to define proportional categories that remain constant over time and to identify concentrated groups of the economically disadvantaged rather than broad categories such as manual workers or those with a low education, which comprise up to 40% of the population in most European societies.
Our focus in this study is on life expectancy among income quintiles as life expectancy is a measure that presents mortality differences in an easily understandable way and is especially useful for studying changes over time. It has previously been used in research on socioeconomic trends in health,3 5 11–14 but to our knowledge this is the first study analysing trends in life-expectancy differences among income groups in the total adult population, and decomposing the changes by age and cause of death with a particular emphasis on the lowest income group. Previous studies using income have concentrated mainly on total inequality indices and relative differences, and have therefore given little attention to the development of mortality in the lowest income group.6–9 15
Tackling the growing mortality differences has been given high priority in health programmes internationally. The WHO Health 21 programme for the European region aims to reduce the gap in life expectancy between socioeconomic groups by at least 25% by the year 2020.16 Accordingly, a similar goal has been adopted on the national level in many European countries,17 including the UK18 and Finland.19 This study also contributes to monitoring the progress towards these goals as the development in life expectancy of income groups may be different than that of indicators used in previous studies.
Data and methods
The data included an 11% sample of all persons residing in Finland between 1988 and 2007. Statistics Finland combined the data from various registers, linking it with death records from the same period by means of personal identification codes. The register data linkage was approved by the ethics committee of Statistics Finland (permission TK-53-1783-96). In order to increase the power of the analyses the dataset also included an over-sample of deaths, which covered 80% of all deaths during the follow-up period. In order to obtain results that would be representative of the population we constructed sampling weights using known sampling probabilities. The analysis included non-institutionalised persons over 34 years of age and emigrants were censored at the end of the year of emigration. The final dataset comprised 754 087 deaths. STATA 10.1 was used for the statistical analyses.
The information on income came from the registers of the Finnish tax administration and social insurance institution. As the indicator of income we used household taxable income, which consists of wages, capital income and taxable income transfers of all household members. This excludes some non-taxable income transfers such as child benefits and certain housing allowances. In order to take account of household composition we adjusted the income measure by dividing the household income by the total number of consumption units in the household using the Organisation for Economic Cooperation and Development (OECD) equivalence scale: the first household member over the age of 17 years corresponded to one unit, all others over that age to 0.7 units, and children under 18 years to 0.5 units.20 21 The income quintiles were calculated with cut-off points derived from the combined data separately for men and women, and for each year partly in order to avoid the effect of inflation and monetary changes.
The cause of death analysis was done using 11 groups of causes of death. The groups were constructed in accordance with the Statistics Finland harmonised cause-of-death classification, which is based on the International Classification of Diseases (ICD) 9th revision for the years 1988–95 and the 10th revision for the years 1996–2007.22 The groups incorporate the most common causes of death and those that are strongly related to behaviour, and also cover all deaths: lung cancer (ICD-10 C32–C34), breast cancer only among women (C50), other cancers (C00–C31, C37–C49, C51–C97), ischaemic heart diseases (IHD; I20–I25), cerebrovascular diseases (I60–I69), other circulatory diseases (I00–I15, I26–I28, I30–I52, I70–I99), respiratory diseases (J00–J64, J66–J99), alcohol-related diseases and accidental alcohol poisoning (F10, G312, G4051, G621, G721, I426, K292, K70, K860, K8600, O354, P043, X45), accidents and violence (V01–X44, X46–X59, X85–Y89), suicides (X60–X84, Y870) and other diseases.
We examined life expectancy at the age of 35 years. We calculated the annual age-specific death rates in 5-year age groups by sex and income group using the previous year's income information. The all-cause death rates were used to calculate the abridged life tables for each income group annually and in two periods combining the first (1988–92) and the last (2003–7) five study years.23 Decomposition by age and cause of death was made comparing the lowest and the highest income quintile. Changes in the life expectancy of 35-year-olds from the first to the last 5-year period were decomposed by age and cause of death in accordance with the method presented by the United Nations Secretariat.24
We conducted sensitivity analysis by using disposable income in calculating similar life-expectancy trends and comparing them with the initial results. Information on disposable household income was available for the period from 1996 to 2007. In comparison with household taxable income it includes non-taxable benefits and excludes paid taxes and therefore also takes into account minor differences in the taxation of pensions and salaries. We also conducted similar sensitivity analyses by using taxable income information 3 years before the mortality follow-up, and also calculating the consumption units using the OECD-modified scale in which the corresponding weights are 1, 0.5 and 0.3 for children under 14 years.20
Results
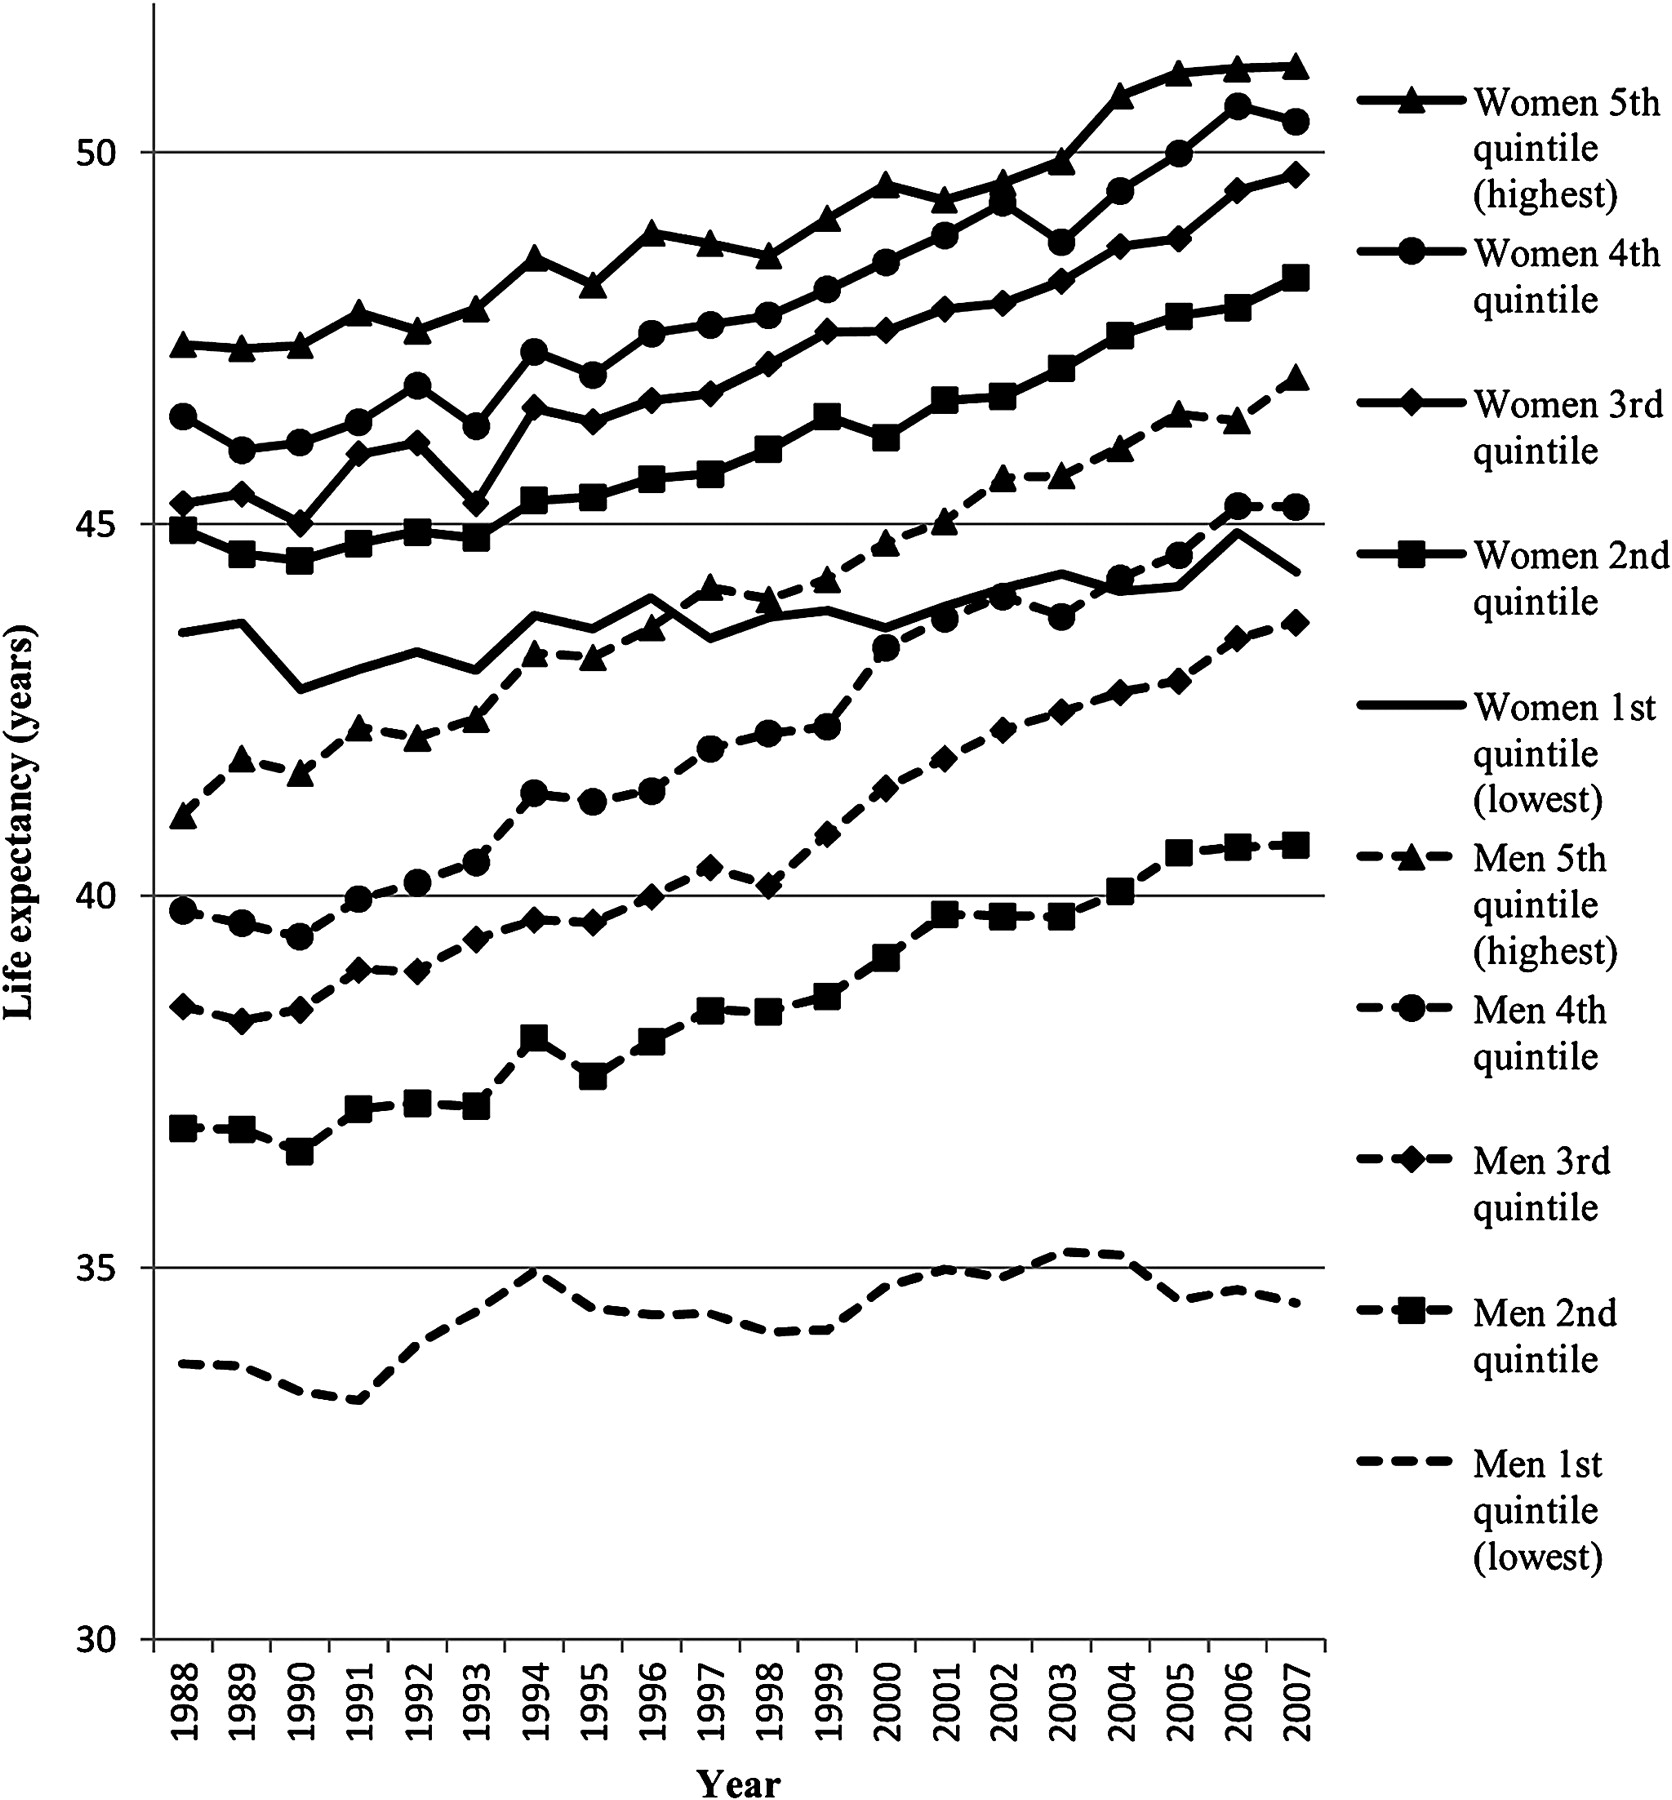
The income gradient in life expectancy at the age of 35 years was clear among both men and women (figure 1). Life expectancy increased in all income groups over the study period, but the increase was stronger in the highest four quintiles and was almost non-existent in the lowest quintile. The gap between the highest and lowest quintiles in 1988 was 7.4 and 3.9 years for men and women, respectively, the corresponding gap in 2007 being 12.5 and 6.8 years. It thus widened by 5.1 years among men and 2.9 years among women over the study period. The gap between the lowest and the second lowest (1st and 2nd) quintiles also increased from 3.2 to 6.2 years among men and from 1.4 to 3.9 years among women.
Life expectancy of men and women aged 35 years by income quintile in 1988–2007.
In further analyses we restricted the comparison to the change in life expectancy between the highest and the lowest income quintiles. Table 1 shows the contribution of the 10-year age groups to the change in life expectancy in the highest and the lowest income quintiles and to the change in between-quintile differences from 1988–92 to 2003–7. Among men, the increase in life expectancy at the age of 35 years was 1.24 and 4.51 in the lowest and highest income quintiles, respectively, and the respective figures among women were 1.12 and 3.26. Men over 65 years contributed positively to life expectancy in both income quintiles but more in the highest one whereas among the under 65-year-olds the increase was restricted to the highest income quintile. The increase in disparity between the lowest and the highest income groups was slightly more prevalent among the under 65-year-olds.
The contribution of 10-year age groups to changes in life expectancy among men and women aged 35 years from 1988–92 to 2003–7 in Finland by income group
Among women the contribution to the increase in life expectancy was clearly larger among the over 65-year-olds than the under 65-year-olds in both income groups. This was very clear in the low income group given the increase in mortality in the younger age groups, which contributed negatively to life expectancy. The younger age groups accounted for approximately two-thirds of the increased discrepancy between the income groups among women.
A decrease in mortality attributable to IHD contributed most to the increase in life expectancy in both income groups and for both men and women (table 2). This increase originated mostly from the older age groups, with the exception of low income men among whom both age groups made an approximately equal contribution. Alcohol-related causes of death made a major negative contribution to life expectancy among both sexes in the lowest income group, virtually all of which was attributable to the younger age group. Increasing mortality due to lung cancer among women in the lowest income quintile also reduced the increase in life expectancy. The category ‘other diseases’ also had a negative effect on life expectancy among both men and women in the lowest income quintile.
The contribution of causes of death to changes in life expectancy (in years) among men and women aged 35 years from 1988–92 to 2003–7 in Finland by income group and two age groups
Alcohol-related causes of death made the most significant contribution to the increasing gap in life expectancy between the highest and lowest income quintiles among both men and women, being responsible for a third (1.08 years) of the total increase among men and over a quarter (0.57 years) among women. Besides the alcohol-related causes of death it was the ‘other cancers’ that increased the gap markedly among men and women by 0.47 and 0.42 years, respectively. Among women all cancers collectively were responsible for a third of the total increase. Despite the large role of IHD in increasing life expectancy among both sexes, it increased the gap between the lowest and the highest income quintiles markedly only among men. For women the third significant source of the increased discrepancy was the heterogeneous category of other diseases (0.29 years). Mortality trends in none of the cause-of-death categories narrowed the gap in life expectancy.
We carried out sensitivity analysis using household disposable income from 1996 to 2007. The trends were similar but the gap between the lowest and second lowest income quintiles was smaller among men and was non-existent among women at the beginning of the follow-up (results not shown). As with household taxable income, the stagnation in terms of mortality reduction in the lowest household disposable income quintile was responsible for the widening of the gap in life expectancy among both men and women. The sensitivity analysis using income information 3 years before the mortality follow-up provided quite similar results to the initial analysis. The life expectancy of the lowest quintile was slightly (on average 0.6 years) higher among both men and women but the trends of all quintiles including the stagnation of the lowest quintile remained unchanged. The sensitivity analysis performed with the OECD-modified consumption unit scale provided nearly identical results to the initial analysis.
Discussion
Statement of principal findings
Our analysis revealed an increasing gap in life expectancy between income quintiles over the past 20 years. The gap between the highest and the lowest quintiles widened by 5.1 years among men and 2.9 years among women from 1988 to 2007. Stagnation in the lowest income group was the main characteristic of the increased disparity for both men and women. The increase in the gap was more prevalent among the under 65-year-old population, especially women. There was an increase in mortality among women aged 35–64 years in the lowest income quintile, and a robust decline among those in the highest income group. Women under 65 years or age thus accounted for approximately two-thirds of the total increase in inequality between the highest and the lowest income quintiles. Alcohol-related causes of death contributed most to the stagnation in life expectancy among both men and women in the lowest income quintile. All of the increase in alcohol-related mortality originated in 35–64-year-olds. However, among women cancers contributed almost as much to increasing the gap as alcohol-related causes, whereas IHD was significant only among older men.
Methodological considerations
The advantages of the register data used are uncontested because of the large sample size and the robustness of the measurement, and because there is no loss to follow-up. The problems in the previous studies attributable to self-reported household income, varying definitions over time and the non-linkage of data with mortality records do not arise and our results are not affected by self-report bias. Compared with other socioeconomic indicators, the classification of income over time is easier than that of occupational social class or education, because income allows for keeping the proportions of groups constant from one year to another. On the other hand, income is more sensitive to short-term fluctuations among those of working age.25 However, our sensitivity analysis showed that if income was measured 3 years before the mortality follow-up the trends and the stagnation of the lowest quintile were unaffected.
Comparisons with previous studies
Blakely et al8 reported an increasing gap in life expectancy between the highest and the lowest income tertiles among men and a slightly narrowing gap among women in New Zealand from the early 1980s to the late 1990s. They also noted the diminishing role of IHD and other cardiovascular diseases and the increasing significance of cancers in the disparity between income groups (see also Fawcett and Blakely).15 However, they used self-reported information on household income and the information was missing for 16–20% of the respondents. Furthermore, cause-specific analysis only covered those up to the age of 77 years with no breakdown by age. Previous studies using absolute or relative measures other than life expectancy to track income inequalities in mortality6 7 9 10 have reported substantial gaps between income groups, but none of them concentrate on the cause-of-death composition of the development among the lowest income group. It was found in a Norwegian study that among those aged 45–59 years mortality stagnated in the lowest income quartile from 1970 to 1990,9 but reliable conclusions were hampered by the fact that the definition of income changed during the study period.
The few studies using income in general report somewhat similar trends in mortality disparities to those using educational groups or occupational social class. According to the results of a study from New Zealand,8 the increase in relative disparity was generally greater between income groups than between educational groups, but the cause-specific composition of the differentials was rather similar. A previous study examining mortality trends by occupational class from 1983 to 2005 in Finland4 reported results that were similar in some respects to ours. However, the differences between the highest and lowest groups are much larger when the focus is on income groups. From 1988–90 to 2003–05 the life-expectancy gap between upper white collar and blue collar workers widened by 0.5 years among men and 0.6 years among women, whereas between income quintiles the change was 3.1 years among men and 2.3 years among women over the same period. Another study5 reported a widening of the life-expectancy gap between basic and tertiary education of 0.66 years among men and 0.56 years among women between 1989–91 and 1998–2000, whereas this study shows that the gap between income quintiles increased by 1.50 and 0.96 years, respectively, during the same period.
In particular, the stagnation in life expectancy we found in the lowest income quintile was not observed among the manual worker and basic education groups, even though there was a slight increase in mortality among women under 55 years of age with a low education or occupational class. The gain in life expectancy originated mainly from the decreased mortality attributable to IHD in all socioeconomic groups.4 5 Before the 1990s the increase in mortality differences between educational groups and occupational social classes largely stemmed from cardiovascular disease mortality and alcohol-related causes of death.3 However, previous studies have reported a minimal contribution of IHD to increasing disparity after the 1990s,4 5 whereas according to our analysis it is still a significant cause of the increasing gap in life expectancy among men. Furthermore, although alcohol-related causes of death have been found to contribute to the increasing gap especially among men,4 5 no previous study has reported as drastic a negative effect for both sexes as identified in this study.
Possible explanations and policy implications
Increasing alcohol-related mortality in the working-age population turned out to be the main reason for the stagnation of life expectancy in the lowest income quintile. The drastic reduction in the price of alcohol due to a change in taxation in 2004 increased alcohol-related mortality particularly strongly among the most deprived groups of the working aged population.26 This may partly explain the large contribution of alcohol-related causes to the stagnation of mortality in the lowest income quintile although the contribution was already strong during the period 2000–4 (results not shown here). Furthermore, given that the positive contribution to life expectancy in the lowest quintile originates mainly from the decrease in mortality due to IHD, it may be that at least some of the increase is attributable to the improved treatment first available in the highest income quintile27 but in the latter period also benefiting the lowest quintile.28 29
In addition, the changed social composition of the lowest income quintile between the first and the last study periods may also partly explain the stagnation of mortality. A deep recession hit Finland during the latter part of the first study period of 1988–92. The proportion of unemployed in the lowest income quintile increased from between 1% and 2% in the first period to nearly 15% in the mid-1990s and declined only slowly after that. There was also a bigger increase in the proportion of single households in the lowest income quintile than in the overall population (preliminary results not shown here). The selection of single and unemployed persons into the lowest income quintile may have adversely affected the mortality decline in that both statuses are associated with increased mortality.30 31 There may also be a more direct selection of people with poor health into the lowest income quintile,7 21 25 and it is unclear whether or not this selection mechanism strengthened over the study period. Overall, the changing composition of the income groups over the study period make a fuller understanding of the trends identified in this study and in preceding studies difficult. A comparison of the mortality trends by income, education and occupational social class accompanied with detailed analyses of compositional change would therefore be welcome.
This study contributes to the monitoring of progress towards the goals set in the WHO Health 21 programme. Socioeconomic differences in life expectancy have grown more rapidly between income groups than research based on other indicators has previously shown. Even though the Health 21 programme defines socioeconomic groups somewhat vaguely, it specifically targets the poor and the unemployed when tackling the increasing health gaps.16 If these economically most deprived groups are to be monitored, then the differences between the income groups should be of special interest. Our results identify a clear need to tackle the specific health problems of the poorest, which relate to alcohol-related harm in particular.
What is already known on this subject
The WHO Health 21 programme target to reduce the gap in life expectancy between socioeconomic groups by at least 25% by the year 2020 is echoed in the national health policy targets in many European countries.
The available evidence based on occupational classes and educational groups points to growing rather than decreasing inequalities in mortality.
Age and cause-of-death-specific composition of the increasing differences concentrating on the lowest income group have not been documented.
What this study adds
Differences between the highest and the lowest income quintiles in the life expectancy of 35-year-olds increased by 5.1 years for men and 2.9 years for women between 1988 and 2007.
Stagnation of life expectancy in the lowest income quintile was the main characteristic of the increasing disparity. The increase originated more from the working-age population, especially among women. The increased mortality attributable to alcohol-related diseases in the working-age population was the single most important cause of the widening gap.
The increase in socioeconomic differences in life expectancy between income groups has been more rapid than research based on other indicators has shown. More attention should be paid to tackle the causes of these adverse changes in the lowest income quintile.
References
Footnotes
Funding The study was supported by the Academy of Finland.
Competing interests None.
Ethics approval This study was conducted with the approval of the ethics committee of Statistics Finland.
Provenance and peer review Not commissioned; externally peer reviewed.