Article Text

Abstract
Study objective: Prior studies have shown that children are particularly sensitive to air pollution. This study examined whether children of low socioeconomic status suffered greater exposure to outdoor nitrogen dioxide than more affluent ones, both at their place of residence and at school, in a country with widespread state intervention for social equity.
Design: Local scale data on outdoor nitrogen dioxide obtained from a validated air pollution model were analysed, along with all school children accurately geocoded to their building of residence and school.
Participants: All 29 133 children in grades one through nine (aged 7 to 15 years) residing and attending school in Malmö, Sweden, in 2001.
Main results: Defining the socioeconomic status of children according to the mean income in their residential building, the spatial scan statistic technique allowed the authors to identify eight statistically significant clusters of low socioeconomic status children, all of which were located in the most polluted areas of Malmö. Four clusters of high socioeconomic status children were found, all of them located in the least polluted areas. The neighbourhood socioeconomic status better predicted the nitrogen dioxide exposure of children than the socioeconomic status of their building of residence. Exposure to nitrogen dioxide at the place of residence and school of attendance regularly increased as the socioeconomic status of a child’s neighbourhood of residence decreased.
Conclusions: Evidence of environmental injustice was found, even in a country noted for its egalitarian welfare state. Enforcement of environmental regulations may be necessary to achieve a higher level of environmental equity.
- air pollution
- child health
- environment
- nitrogen dioxide
- spatial analysis
Statistics from Altmetric.com
Children constitute the largest part of the population that is susceptible to the adverse effects of air pollution.1–3 This environmental hazard is associated with various health problems among children,4,5 and with an increased infant mortality.6 Specifically, nitrogen dioxide (NO2), the focus of this study, has been shown to be associated with low birth weight7 and respiratory difficulties among children, including the severity of virally induced asthma symptoms8 and clinically significant deficiencies in lung function growth.9 Children’s exposure to air pollution is therefore of primary concern, especially in reference to the life course approach that finds health problems during childhood have repercussions on health at later stages of life.10 With growing interest for socioeconomic differences in health, investigating whether low socioeconomic status (SES) groups are more exposed to air pollution has been proposed as a major objective.11 The existence of socioeconomic disparities would contradict the principle of environmental justice, which states that no group should bear a disproportionate share of negative environmental hazards.12–14
Recent literature on environmental justice has been focused mainly on residential proximity to noxious facilities.15,16 Much less work has considered ambient air quality in itself.17 Furthermore, studies that used model based data on pollution, as we did, considered total suspended particulates, which are weak markers for particles that penetrate into the lung. Finally, most previous research has been conducted on an overly broad spatial aggregation level.15,18 To address these limitations, we investigated outdoor exposure to NO2 in Malmö, Sweden (270 000 inhabitants), where concentrations are above World Health Organisation air quality guidelines19 in certain parts of the city, and largely above the annual mean of 20 μg/m3 recently recommended as a long term standard to protect public health (see discussion section for comparison with other European cities).20 NO2 was selected as it is known to be a good indicator of intraurban traffic generated pollution (see discussion section).21
In an international perspective, it is important to find out if environmental injustice may also exist in a country with one of the most advanced welfare states and lowest inequalities in income (as assessed with the Gini coefficient).22 Following a recent review that emphasised the limited generalisability of studies conducted in a specific setting, findings on environmental injustice obtained in the USA cannot be directly applied to the Swedish context. Moreover, as only a few previous studies on environmental justice have done,23 our analysis focuses on children, a subpopulation particularly sensitive to air pollution.3 It expands upon past research by considering outdoor exposure both at place of residence and at school. We also go beyond earlier studies by investigating the issue of environmental justice on a highly accurate spatial scale. Taking into consideration local variations in NO2 estimated from a validated model (fig 1, colour version available on line http://www.jech.com/supplemental), and including all school children in Malmö in our analysis (fig 2</url>), we investigated socioeconomic differences in the exposure of such children to NO2, both at their place of residence and at school, where children spend a significant part of their life.

Roof level annual concentration of NO2 estimated from AERMOD. The median roof level annual concentration for the 6298 residential buildings was 16 μg/m3, and the interdecile range 11–22. We also report ground level concentrations of NO2, as estimated by the Environmental Department of Malmö along the principal streets of the city. Following Swedish regulations (SFS 521:2001), we distinguish between streets with NO2 concentrations that do not require intensive monitoring (those with annual values below 32 μg/m3), streets with intermediate concentrations, and streets with NO2 concentrations above World Health Organisation air quality guidelines (those with annual values above 40 μg/m3).
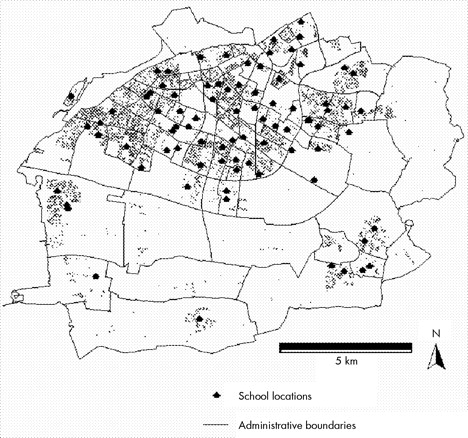
Spatial distribution of the 28 970 children across 6298 residential buildings, and locations of the 91 schools in Malmö, 2001. Each point corresponds to a building where children resided. Administrative boundaries correspond to the 100 administrative neighbourhoods of Malmö.
METHODS
Data and measures
We used individual data on all 29 133 children in grades one through nine (aged 7 to 15 years) who resided and attended school in Malmö, Sweden, in 2001. The database comprised information on school of attendance and spatial coordinates of the exact building of residence. The 91 schools of Malmö were also geocoded (fig 2).
Using the Database for Resource Allocation, we used individual data on pre-tax income to compute the mean annual income of people aged 25 years or older in each residential building where children in the study lived in 2001. In addition to mean income in residential buildings, we computed mean annual income of people aged 25 years or older in the 100 administrative neighbourhoods. The median number of people aged 25 years or older in a building of residence was 2 (interquartile range 2–4, interdecile range 2–43), whereas it was 1484 (interquartile range 884–2572, interdecile range 534–3693) in a neighbourhood of residence. Therefore, the building specific mean income and neighbourhood income probably measure different constructs.
Even if the two variables are contextual in nature (10% of the buildings had 43 or more people aged 25 years or over), it is probable that building specific income is more closely related to the exact SES of children than neighbourhood mean income. Indeed, people within the same building tend to have a much more similar income than people only residing in the same neighbourhood (using multilevel models, we found that the intra-neighbourhood correlation for income was equal to 12%, whereas intra-building correlation was 34%). Moreover, the SES of a person’s building of residence may more strongly define their SES than the SES of that person’s neighbourhood of residence. Geocoding or socioeconomic information was not available for 163 children (0.6%), who were therefore excluded from the analyses.
As represented in figure 1, data on NO2 concentrations obtained from the Environmental Department of Malmö consist in estimations generated by the AERMOD air pollution model.24 The model is founded upon an emission database that includes accurately geocoded information on road traffic, sea traffic, aviation, railroad, industries and energy producers, small scale heating, construction and farming machinery, and loading machines in harbours.25 Hourly information on weather and approximations of hourly emissions were used to estimate spatial variations of the annual average concentration of NO2 in 2001. A dispersion calculation was performed to estimate roof level concentrations at each point on a 100 m grid superimposed on Malmö. However, it should be bourne in mind the inherent inability of AERMOD to simulate concentrations in real life street situations where the layouts and sizes of buildings create airflows that are extremely complex. Models such as AERMOD are likely to perform poorly at specific receptor locations in so called “street canyons”. However, as we report below, validation studies indicated that local predictions in the city of Malmö were of good quality, as average concentrations are largely a function of traffic flow, which is well described in the emission database.
To provide a “temporal validation” of the dispersion model’s predictive accuracy, we computed the correlation between daily concentrations measured at one station in the city and daily concentrations estimated from the model at the same place over the course of 2003. Such a correlation was equal to 0.63 (p<0.0001). Moreover, the ability of the dispersion model to predict spatial variations in NO2 concentrations was assessed in two different ways: (1) We computed the correlation between average concentrations of NO2 directly measured in 2002–2003 at 23 stations in the region of Scania (of which Malmö is the largest city) and concentrations estimated by the model for those locations. The correlation was equal to 0.84 (p<0.0001), indicating that the model’s accuracy was acceptable. (2) To verify its validity on a more local scale, the Environmental Department of Malmö measured outdoor concentrations of NO2 at 11 locations in the city over a few months. Average concentrations over the same period were also estimated from the model. The correlation between measured and modelled values was 0.91 (p = 0.0002), showing the acceptable accuracy of the model in predicting local spatial variations of NO2.
As noted above, AERMOD was used to approximate roof level concentrations of NO2. Such roof level values are below concentrations measured on the ground, and the difference between roof level and ground level values is larger in highly urbanised environments because buildings tend to retain air pollution. Ground level concentrations on the main streets of Malmö were also reported in figure 1.
We attributed to each child the annual NO2 concentrations estimated for the points of the 100 metre grid that were the closest to their building of residence and school of attendance (an extremely high correlation existed in NO2 concentrations between locations 100 metres apart).
Statistical analysis
To find out if buildings of residence of low SES children tended to cluster in the most polluted parts of the city and those of high SES children clustered in the least polluted areas, we used the spatial scan statistic technique.26 In this statistical approach, circles of constantly varying size with their centres at the different residential locations are examined, each circle being a possible candidate cluster. For each circle, a likelihood ratio is calculated to test the hypothesis that there is an increased prevalence of buildings where low SES children/high SES children resided inside the circle, compared with outside it. To assess the statistical significance of clusters—that is, whether they could have occurred by chance or not—the distribution of the likelihood ratio statistic under the null hypothesis is obtained by Monte Carlo simulation.26
The statistical units of analysis were the 6298 buildings of residence of children. In a first step, we searched clusters of buildings of residence of low SES children (that is, children with an SES below the first quartile). In a second step, we searched clusters of buildings of residence of high SES children (that is, children with an SES above the third quartile). The maximum cluster size was defined as a circle with a radius of 250 m (to keep the NO2 concentration rather homogeneous within clusters, the maximum size could not be too large, but could not be too small, so that the clusters could encompass a certain number of buildings of residence of children). Only the 25% of all the buildings of residence with the lowest pollution levels and the 25% of all the buildings of residence with the highest pollution levels were proposed as potential cluster centres, as we were only interested in comparing the clusters identified in the most and the least polluted areas of the city.
We computed mean concentration at place of residence and school of attendance by SES, which was defined first as mean income in residential building, and second as neighbourhood mean income (divided into eight classes). To perform valid statistical tests for the associations, we estimated multilevel models with children nested within the 100 administrative neighbourhoods of Malmö, and with NO2 concentrations as the outcomes. Those outcomes can be thought of as individual level estimates of the outdoor concentrations of NO2 at the place of residence or school (with measurement error); but are specific in that they are completely determined by the place of residence or school children attend (for example, two children residing in the same place do not necessarily have similar health variables, but do experience the same outdoor exposure to NO2 at their place of residence). Accordingly, random effects in multilevel models were used to adjust for correlation within neighbourhoods, rather than to quantify it, which is not of central interest in the present context.
Moreover, in the models, 95% confidence intervals were based on the sandwich estimator (or robust covariance matrix estimator), which provides standard errors for the estimated coefficients that are robust in the sense that they remain consistent under misspecification of the covariance structure. As sex and school grade were not associated with NO2 exposure, they were not included in the models. Firstly, the models included only building specific income or, alternatively, neighbourhood income as a predictor. Secondly, building specific and neighbourhood incomes were simultaneously entered into the models.
RESULTS
Using the spatial scan statistic, we identified eight statistically significant clusters of buildings of residence of low SES children (p<0.05), all of which were located in the most polluted areas (fig 3, colour version available on line http://www.jech.com/supplemental). Using the same approach to identify clusters of buildings of residence of high SES children, we identified four different clusters (p<0.05), all of them located in the least polluted areas.

Locations of clusters of buildings of residence of low SES and high SES children, estimated from the spatial scan statistic technique. The number of children in each cluster is reported at the bottom of the figure.
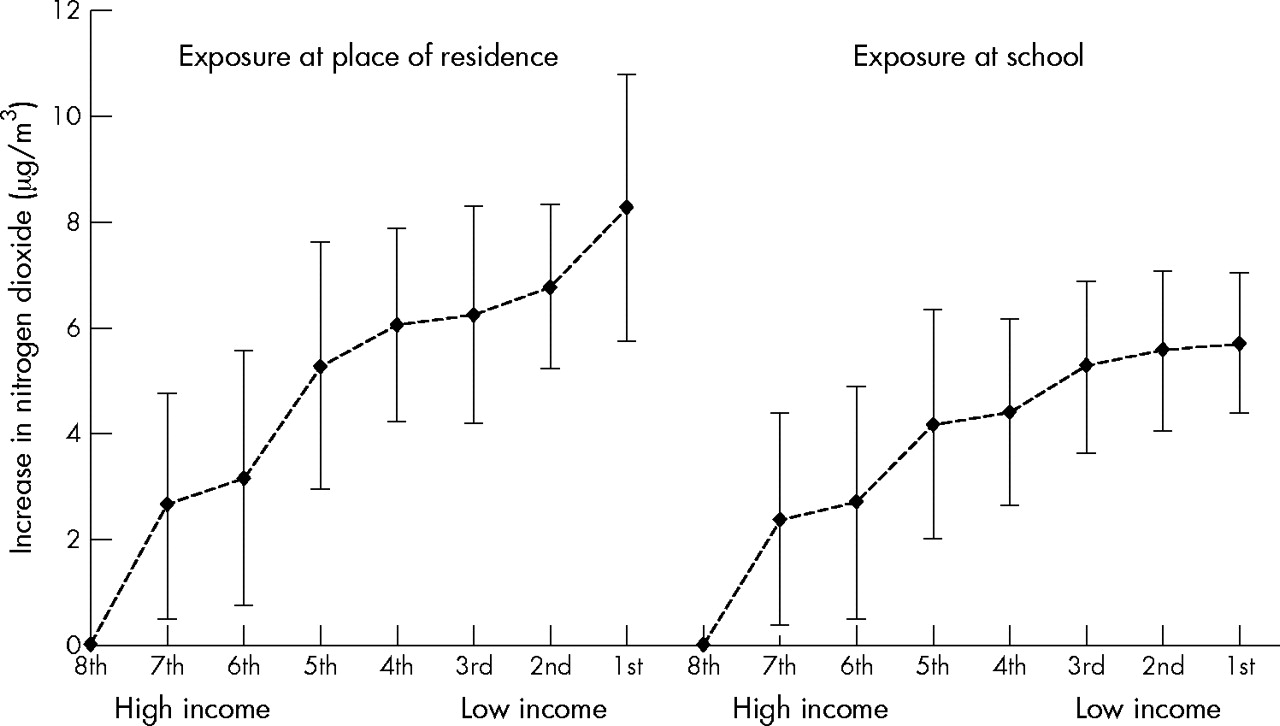
NO2 concentrations at place of residence and school regularly increased with decreasing SES (table 1). Associations were of greater magnitude when SES was measured by neighbourhood mean income, rather than by mean income in residential building. Socioeconomic disparities in exposure to NO2 were slightly more important at place of residence than at school of attendance (low SES children encountered, on average, lower NO2 concentrations at school than at their place of residence). Regression models indicated that children from low SES neighbourhoods faced significantly higher outdoor concentrations, at both their place of residence and school of attendance (fig 4). However, it should be noted that the 95% confidence intervals were rather wide. Associations were also statistically significant when using building specific SES instead of neighbourhood SES (results not shown).
Mean roof level annual NO2 concentration (and standard deviation, SD) in μg/m3 by mean income, divided into eight classes

Increase in roof level concentration of NO2 at place of residence and school, by neighbourhood income, as estimated from a multilevel regression model. Neighbourhood income was divided into eight classes. The values reported here represent the increase in NO2 in each income category, as compared with the highest income group (8th class) used as reference category in the models.
Finally, building specific SES and neighbourhood SES were entered simultaneously into the models. The socioeconomic gradient in exposure was entirely captured by neighbourhood SES (building SES was no longer a significant predictor).
DISCUSSION
In summary, our investigation, conducted on a local spatial scale, showed that children from low SES neighbourhoods were more exposed to NO2, both at place of residence and school, even in a country committed to widespread state intervention for social equity. A strength of our study is that we have combined two sources of data geocoded on a highly accurate spatial scale—that is, NO2 concentrations estimated from a validated model that takes detailed emission sources and meteorological conditions into account, and (2) data on all school children geocoded to their exact building of residence and school.
However, there are limitations to our study. Firstly, we were not able to consider indoor pollution related to the types of heating and cooking appliances used, which is likely to represent the largest part of the total exposure of children to NO2 and may contribute to the socioeconomic gradient in exposure.27 Secondly, estimated rather than measured NO2 concentrations were used in the analyses. However, validation studies showed that the estimated NO2 levels were reasonably accurate. Thirdly, we had no data on the residential history of children, and could not therefore assess their cumulative outdoor exposure in a longitudinal perspective. Fourthly, the exact SES of the households of children was not known. To consider children’s exposure both at their place of residence and school (that is, at two major locations in a child’s average day), we had to use a specific, anonymous database to which household income could not be linked. Instead, we considered mean income in the residential building, which is certainly more closely related to household income than neighbourhood mean income is. However, to be rigorous, one needs to bear in mind that only building specific or neighbourhood SES were measured, rather than directly measuring a child’s individual SES. Finally, only pre-tax income, not disposable income, was available for us in defining the SES variables.
In our study concerned with spatial variations in air pollution between neighbourhoods of Malmö, it was critically important to use a marker of intra-urban traffic generated pollution. Rather than small particles (such as PM2.5 or PM10) that are known to vary in space on a larger scale, we considered NO2, an important inorganic gas in the urban air pollution mixture, which can serve as a good indicator of intra-urban traffic pollution,21,28 which is itself associated with health effects on a local scale.29 Moreover, recent evidence suggests that NO2 exhibits a strong correlation with ultrafine particles (particulate matter <0.1 μm in diameter),30 for which biologically plausible pathways to numerous health outcomes are supported by toxicological evidence. Therefore, the associations between NO2 and respiratory problems among children reported in the literature may result from the underlying effect of ultrafine particles,30 from the synergistic effects of NO2 and particles,31 or from the direct effects of NO2. Based on an extensive review of the toxicological and epidemiological evidence, leading scientists from Germany have recently recommended stricter standards for ambient concentrations of NO2 (an annual mean value of 20 μg/m3). These substantive reasons, combined with the better empirical prediction from our dispersion model for NO2, led to our decision to use this gas as an indicator of exposure to pollution.
What is already known on this topic
Previous research on environmental justice (1) has primarily focused on the general population, rather than on specific groups that may be particularly vulnerable to pollution effects, such as children, (2) has mostly been conducted in countries with a certain level of social inequity, and (3) has relied on data geocoded to a coarse spatial level of resolution.
To compare NO2 levels in Malmö with those found in other European cities, we have used data kindly provided by Steinar Larssen of the European Topic Centre of Air Quality and Climate Change (ETC/ACC) on average annual concentrations of NO2 measured by urban background stations (as compared with traffic oriented stations) in 2000. In that year, Malmö, a city of 270 000 inhabitants, had an annual urban background concentration of NO2 of 24 μg/m3, which is about three times lower than cities such as Paris or London, about two times lower than cities such as Brussels, Warsaw, or Manchester, and about equal to NO2 levels in cities such as Helsinki or Bern. Many places in Malmö exhibit an annual average concentration in excess of 30 μg/m3, and several places a concentration above 40 μg/m3, values that are far higher than the long term mean standard of 20 μg/m3 recently recommended to protect public health.20
In our analyses, the cluster recognition investigation noted no exception to the finding that residential buildings of low SES children tended to cluster in the most polluted areas and buildings of high SES children in the least polluted areas, suggesting that social segregation patterns were closely related to air quality. Regression analyses showed that NO2 concentrations, measured both at place of residence and school, regularly increased with diminishing SES of building or neighbourhood of residence of children. Despite rather wide confidence intervals, statistically significant differences in exposure were found between children in opposed SES classes. It should be kept in mind that the socioeconomic gradient was based on approximate roof level concentrations, and certainly greatly underestimates the true ground level differences existing in the streets (in any case, the exact absolute difference estimated between deprived and affluent neighbourhoods should be interpreted with caution).
We found that neighbourhood SES was a stronger predictor of exposure than building specific SES. When both SES factors were entered into the models, the socioeconomic gradient was entirely captured by the neighbourhood socioeconomic variable, showing that the association operates on a larger scale than that of buildings of residence. It therefore seems that the level of exposure of children is a more direct function of their neighbourhood SES than of their building SES. The association between socioeconomic deprivation and exposure to NO2 may be attributable to the location of polluting facilities and streets with high traffic in underprivileged neighbourhoods—that is, it may operate at the neighbourhood level. Conversely, mean income in the building of residence, as a proxy of household SES, may be a weaker predictor because the socioeconomic rank of a household or building does not exactly correspond to the socioeconomic rank of the neighbourhood where it is situated, because of specific life trajectories and preferences of individuals or local scale variations. Building specific income acts here as a secondary predictor, as low SES children are more exposed to NO2 pollution only to the extent that they tend to live in more impoverished neighbourhoods.
What this study adds
-
Using accurately geocoded data, we found that, even in a country with widespread state intervention for social equity, low SES children were exposed to higher outdoor concentrations of nitrogen dioxide, at both their place of residence and school of attendance, than more affluent children.
-
The SES of the neighbourhood of residence seemed to be a stronger predictor of the level of exposure of children than the SES of their own building of residence.
The associations reported here may hold for intra-urban traffic related pollutants, but cannot be generalised to other pollutants. For example, fine particle pollution varies in space on a larger scale than NO2 concentrations,32 and exposure to ozone has been reported to be higher among wealthier people whose homes are further from traffic sources (attributable to scavenging by NO2).11
The “dose-response” pattern of associations between SES and exposure to NO2 (with SES divided into as many as eight different classes) shows that socioeconomic inequalities were closely translated into an air quality gradient, adding important evidence in support of the notion of environmental injustice. Therefore, taking environmental exposures into consideration, especially during childhood, may help to explain social disparities in health that cannot be accounted for by socioeconomic or psychosocial variables.33 Moreover, as part of the growing literature concerned with the effects of the neighbourhood socioeconomic environment on health,34 it may be useful in specific analytical cases to take air pollution levels into account as well. However, a deeper cross fertilisation than hitherto between social epidemiology and environmental epidemiology may be needed to achieve these objectives.11
Our study suggests that enforcement of environmental regulations may be a necessary step toward achieving environmental justice. Firstly, it has been urged that policymakers persevere in their efforts to reduce motor vehicle emissions, so that exposure can be mitigated at the source.23 Beyond technical improvements to emission controls (use of cleaner fuels, development of very low emission vehicles),3,35 measures may be needed to reduce automobile use, and encourage the use of walking and public transportation in cities by the development of adequate transportation networks.36 Moreover, policymakers may have to target environmental protection programmes for unprivileged neighbourhoods where higher levels of pollution are prevalent.36 Protection measures include vigilant city planning to prohibit the new construction of residential units, schools, day care centres, and parks near major roads or highways, or the construction of highways where the latter already exist. For example, California recently passed a law banning the construction of schools near highways (500 feet buffer). Although not specifically directed at impoverished schools, because the poorer neighbourhoods are the ones most likely to have their schools near highways,23 this measure may improve the distribution of air pollution in relation to SES.
Our findings show that, even in a fairly egalitarian welfare state with widespread state intervention for social equity, social segregation seemed as much linked to traffic related air pollution as in other Western countries.11,12 Decreasing socioeconomic disparities in exposure to air pollution among children may contribute to reducing social inequities in health seen at later stages of life.
Acknowledgments
We thank Steinar Larssen of the European Topic Centre of Air Quality and Climate Change (ETC/ACC), who kindly provided data from the AirBase database on average annual concentrations of NO2 in European cities.
REFERENCES
Supplementary materials
Files in this Data Supplement:
- [view PDF] - Colour figure 1.
- [view PDF] - Colour figure 3.
Footnotes
-
Funding: this study was supported by the French Foundation for Medical Research (BC), and the Swedish Scientific Council and the Swedish Council for Working Life and Social Research (principal investigator: JM). The funding sources had no role in the study design, the interpretation of data, the writing of the report, or in the decision to submit the paper for publication.
-
Conflicts of interest: none declared.
Linked Articles
- In this issue