Article Text

Abstract
Study objective: To describe the population mortality profile of England and Wales by deprivation and in each government office region (GOR) during 1998, and to quantify the influence of geography and deprivation in determining life expectancy.
Design: Construction of life tables describing age specific mortality rates and life expectancy at birth from death registrations and estimated population counts. Life tables were created for (a) quintiles of income deprivation based on the income domain score of the index of multiple deprivation 2000, (b) each GOR and Wales, and (c) every combination of deprivation and geography.
Setting: England and Wales.
Patients/participants: Residents of England and Wales, 1998.
Main results: Life expectancy at birth varies with deprivation quintile and is highest in the most affluent groups. The differences are mainly attributable to differences in mortality rates under 75 years of age. Regional life expectancies display a clear north-south gradient. Linear regression analysis shows that deprivation explains most of the geographical variation in life expectancy.
Conclusions: Geographical patterns of life expectancy identified within these data for England and Wales in 1998 are mainly attributable to variations in deprivation status as defined by the IMD 2000 income domain score.
- GOR, government office region
- IMD, index of multiple deprivation
Statistics from Altmetric.com
Material poverty is the most important single determinant of life expectancy in Europe.1 This relation has been shown in both developed and developing nations2,3 and is the focus of current health policy in the UK.4 A number of studies have shown that mortality also varies regionally in England,3,5,6 Europe,7,8,9,10,11,12 and North America,13–15 although no study has analysed the effect of deprivation and geography simultaneously.
This analysis describes the patterns of age specific mortality and life expectancy in England and Wales in 1998 both by ecologically defined deprivation category and by geographical region, and quantifies the role of deprivation in explaining geographical variability in mortality.
METHODS
Age and period specific mortality rates were calculated and period life tables for 1998 constructed to determine life expectancy at birth. Life expectancy at birth, used in recent health policy,4 provides a useful summary of the contemporary age and sex specific mortality experience of any single defined population that is independent of the population age structure. It is more responsive to changes in young and middle age mortality than rate or ratio measures, because the gain in potential years of life from a reduction in mortality under, say, 60 years of age is proportionately greater than the change in the mortality rate.
The two basic requirements for life table construction are the number of deaths by age and sex for a given year or period, (numerator) and an estimate of the mid-year population by age and sex (denominator). In this study the data were also classified by electoral ward (England) or electoral division (Wales) to enable construction of life tables for both (a) the nine government office regions (GOR) of England and Wales and (b) five groups of the population defined by level of material deprivation in the ward or electoral division.
Data sources
A number of different data sources were used (table 1). Registered deaths for 1997, 1998, and 1999 in each ward of England and Wales were obtained from the Office for National Statistics. We excluded 0.35% of male deaths and 0.20% of female deaths because of missing geographical data. Annual average numbers of deaths registered over the three year period were calculated by age group, sex, and electoral ward or electoral division.
Data sources used to derive deprivation and region specific life tables, England and Wales, 1998
For England, the denominators for the mortality rates were derived from estimates of the electoral ward populations in three broad age bands (0–15, 16–59, and 60 years or more, both sexes combined) for 1998. These were provided by the Social Disadvantage Research Group (SDRG) at Oxford University, which apportioned ONS mid-1998 population estimates for each local authority to its constituent wards on the basis of national administrative statistics, including child benefit records and the electoral register (mean ward population 5883, standard deviation 4213). The SDRG estimates were checked for consistency against local data sources by the local authorities themselves. Full details of this procedure are reported elsewhere.16 We then used local authority populations from the 2001 census to estimate the age-sex profile of each constituent ward.17 These were the most detailed age-sex data available at the time of analysis for a year close to 1998. Each ward retained its total population count from the 1998 estimates for each age band, but within each of the three broad age bands, the 2001 age-sex structure of the local authority containing that ward was applied. This enabled us to estimate the population of each ward by sex, in the conventional age groups: under 1 year, 1 to 4 years, 5 to 9 years … 85 to 89 years, and 90 years or more.
For Wales, the Local Government Data Unit provided counts of patients registered with general practitioners by single year of age and sex from the National Health Service Administrative Register (NHSAR) for each electoral division (mean population 3471, standard deviation 2755).
On a national basis, defining deprivation at the individual level is seldom possible. This study uses an ecological measure of deprivation as a proxy of the deprivation level of the person, as in previous work.3,12,19 The most readily available area based deprivation measure for 1998 electoral wards was the index of multiple deprivation (IMD 2000), which consists of a series of indices referring to six domains of life.16 An equivalent set of indices has been produced for electoral divisions in Wales.18 The income domain, which defines the proportion of people in receipt of any one of five different means tested benefits (income support, job seekers’ allowance, family credit, disability working allowance, and council tax benefit) was selected as the measure of deprivation, because it attempts to quantify material wealth (as against housing, educational, or health deprivation) and is thus similar to measures of material deprivation used elsewhere.20–22 Although the fifth component of the English and Welsh income domain scores are not strictly identical, the misclassification introduced into quintiles of the score by using the Welsh IMD in conjunction with the English IMD was judged to be minimal (Dibben C, personal communication). A full description of how the indices were constructed can be found elsewhere.16,18
The 8444 electoral wards of England and the 865 electoral divisions of Wales were pooled and sorted in rank order according to their income domain score. The 9309 wards were then divided into five groups numbered 1 to 5, representing the most affluent 20% of wards* through to the most deprived 20%.
Life table construction
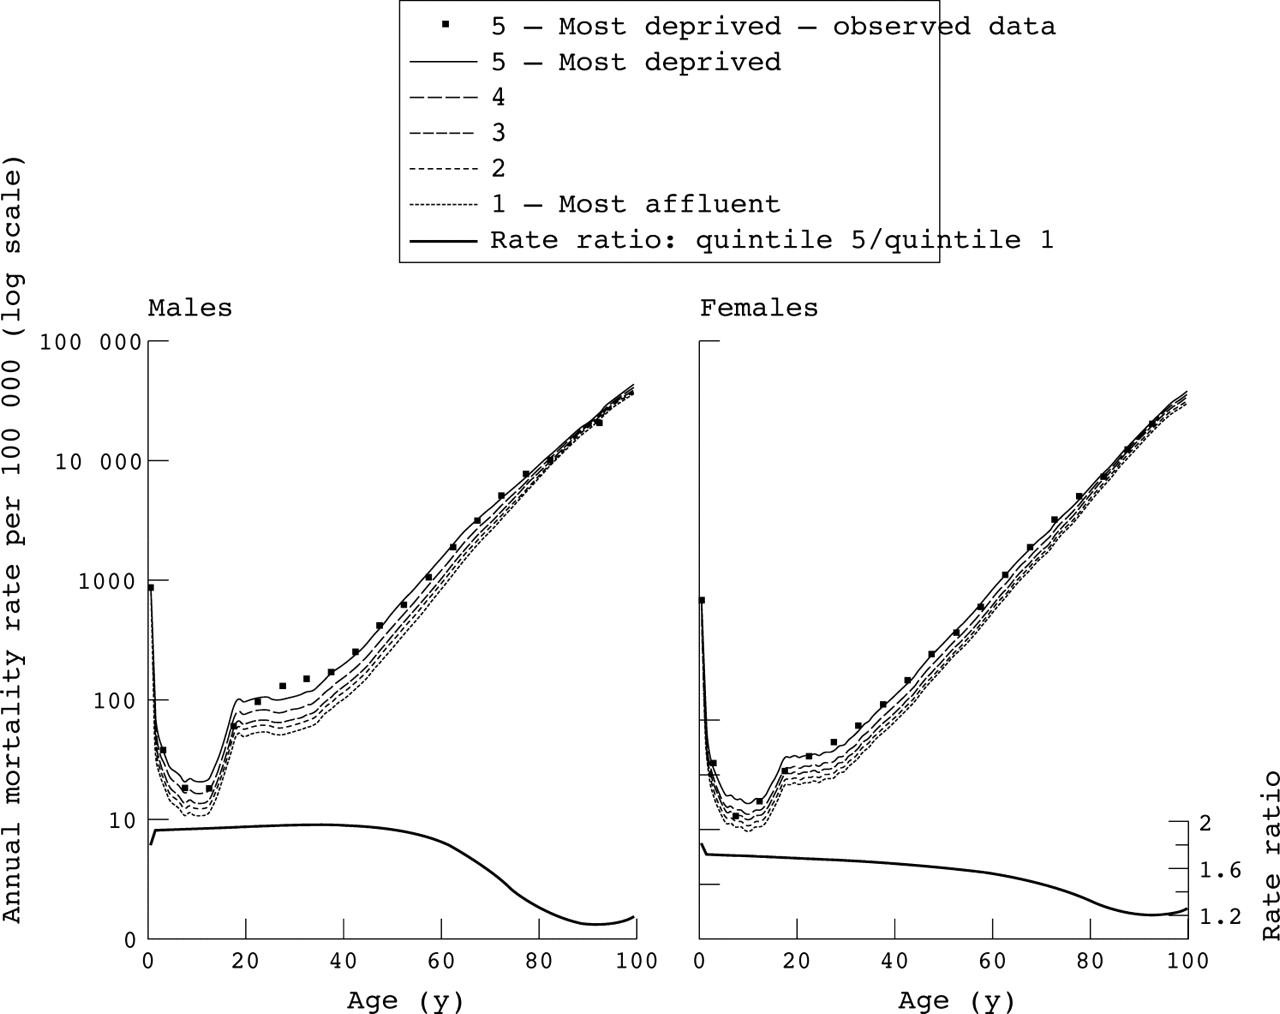
Life tables containing observed age and sex specific mortality rates were then constructed for each region†i, for each deprivation quintile j, and for every combination ij of region and deprivation. These sets of death rates were smoothed and extended into complete (single year of age) life tables up to 100 years of age using a model life table method that compares observed mortality rates in the index population to that of a known mortality “standard” of high quality. We incorporated in this approach the overall mortality, the balance between young age and old age mortality, and the pattern observed among the young.23 The Government Actuary’s Department English Life Table for 1991 was used as the mortality standard.24 The observed, abridged mortality rates and the corresponding smoothed, complete mortality rates for males and females in the most deprived quintile can be seen in figure 1.

Annual deprivation specific mortality rates per 100 000: observed (most deprived only, squares) and smoothed (all quintiles, lines) and the mortality rate ratio between the smoothed rates of the deprived and the affluent (right hand axis), by single year of age and sex, England and Wales, 1998.
Life expectancy at birth was then derived from each of the smoothed life tables, using a standard demographic correction for the mean number of months lived by infants who die before 1 year of age.25
Analysis of mortality and life expectancy at birth
The independent effects of region i and deprivation quintile j on life expectancies at birth eij were evaluated by linear regression, weighted by the estimated populations from which the life tables were calculated. Region and deprivation were modelled as categorical variables. When the interaction between geography and deprivation was examined, deprivation quintile was modelled as a quadratic term, which provided a close fit to the relation predicted by the categorical model (data not shown).
The impact of the intra-regional socioeconomic inequality upon regional life expectancy was also examined with a GINI coefficient.26 As deprivation data were not available for individuals, the coefficients were computed using the income domain score for the ward as a proxy for the income deprivation of people living in that ward. Population weighted linear regression of the resulting coefficients upon sex specific life expectancies for each region ei was performed.
RESULTS
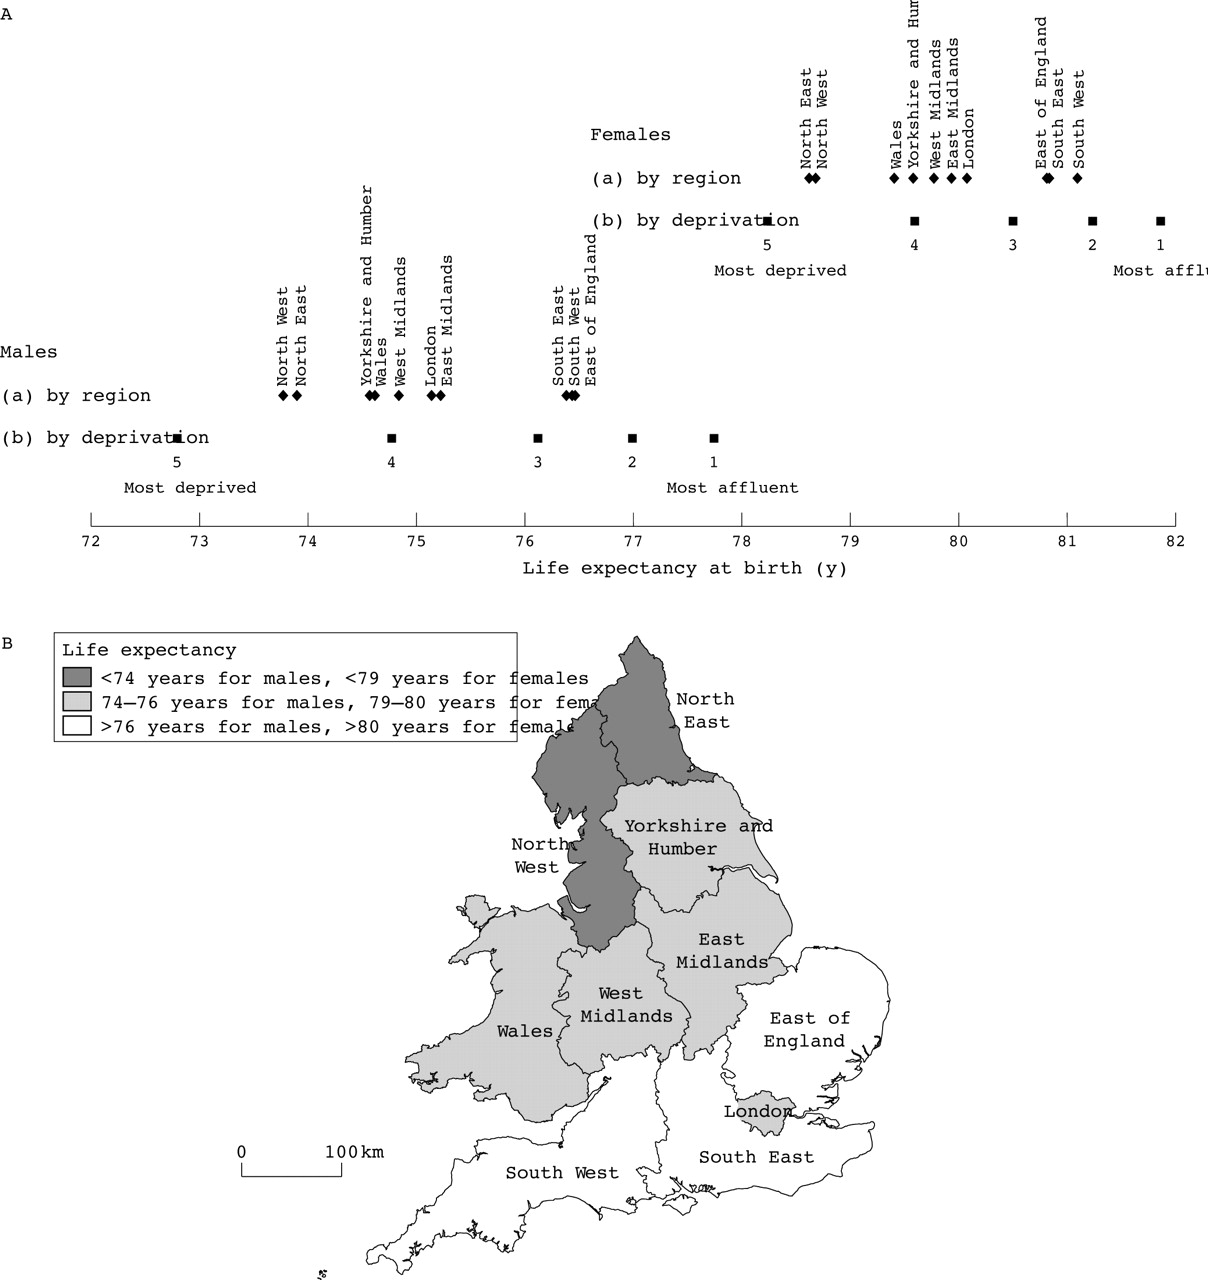
A north-south gradient is apparent in the regional life expectancies at birth, with three distinct groupings (fig 2). This is true for both sexes, but is most evident for males. The first group comprises the South West, East of England, and South East, where life expectancy at birth is notably high (76.5 years in males and about 81 for females). The North East and North West have low life expectancy (less than 74 years for males and less than 79 for females). A third group comprises mid-range life expectancies. Life expectancy also displays a clear trend across the five deprivation categories (fig 2). For males, living in the most affluent fifth of wards affords almost five additional years of life expectancy at birth compared with those living in the most deprived fifth. For females, the equivalent figure is 3.6 years.

Estimates of life expectancy at birth derived from (a) life tables by sex and government office for the region with Wales (diamonds) and (b) life tables by sex and deprivation quintile (squares), England and Wales, 1998 and a map showing their location and grouping, as determined by life expectancy at birth. This map is based on data provided with the support of the ESRC and JISC and uses boundary material that is copyright of the Crown and the ED-LINE Consortium.
The range of life expectancy across deprivation quintiles is much wider than across regions, particularly for males. These differences are the result of substantial differences in age specific mortality (fig 1, top half). For both males and females, mortality is highest in the most deprived areas, successively lower in less deprived areas, and lowest in the most affluent areas. Mortality in the most deprived areas is almost double that of the most affluent areas for males up to 60 years of age, and around 1.6 times higher for females up to age 50 (fig 1, bottom half). Rate ratios are smaller over 85 years, around 1.15 for males and 1.25 for females.
Table 2 shows results from the three linear regressions performed to disentangle the effects of geography and deprivation on life expectancy. Model (a), including only region as a covariate, predicts a range of regional life expectancies of 2.7 years for males and 2.5 years for females, whereas model (b), containing only deprivation, predicts a range of 5.0 and 3.6 years for males and females, respectively. When comparing model (c) to model (a) a strong confounding effect of deprivation can be seen by the decrease in the coefficients for region. In contrast, comparison of model (b) with model (c) shows no such confounding effect of geography. Furthermore, including both geography and deprivation quintile (model (c)), provides only a slightly better fit than the model including deprivation quintile alone (model (b)). In other words, geography explains much less of the variance in life expectancy than deprivation, while deprivation is a confounder in the relation between geography and life expectancy.
Linear regression models of region and deprivation quintile upon deprivation and region specific life expectancy at birth, males and females, England and Wales, 1998
Nineteen of the 20 interaction terms between deprivation and region were not significant, showing that the relation between deprivation and life expectancy did not differ significantly between any of the 10 geographical regions for males, or in nine of the 10 regions for females. Intra-regional income inequality had a similarly low impact, in that the GINI coefficient explained only 2% of the regional variation in life expectancy for both males and females (data not shown).
DISCUSSION
Our analyses indicate that age specific mortality in England and Wales in 1998 was higher and life expectancy at birth lower with higher levels of deprivation, as measured ecologically by the income domain score of the IMD 2000. Regional estimates of life expectancy reveal a clear north-south gradient, but this geographical pattern is predominantly attributable to the distribution of income deprivation.
Our results are consistent with literature on mortality patterns in the UK, elsewhere in Europe and the USA, which show the impact of income level, poverty, or deprivation.12,20,21 In this study, differences in life expectancy seem to be the result of differential survival at all ages from infancy to late adulthood. This suggests that these inequalities might be reduced by public health interventions to decrease mortality before the age of 75, which is mainly attributable to cancer, circulatory disease, and suicide.27 Income deprivation has been shown elsewhere to have a strong association with adverse health behaviour, providing suggestive evidence of a causal pathway.22 Our results also show the importance of adjusting, where possible, for socioeconomic status when analysing differences in population mortality: this has not always been done.8,9,10,11,12,13,14,15
Key points
-
Material poverty is the most important single determinant of life expectancy. Mortality also varies regionally in England, Europe, and North America but no study has analysed the effect of deprivation and geography simultaneously.
-
Differences in life expectancy between deprivation groups are greater than those between the different government office regions of England and Wales. Multivariate analysis shows that deprivation explains most of the geographical variation in life expectancy.
Relative income inequality has been proposed as a partial explanation for international differences in life expectancy.28 This relation has generated much debate during the past decade.29 Our results do not support the hypothesis that relative inequality within the administrative regions of England and Wales could explain the differences in life expectancy observed between them. However, the use of ward level measures of deprivation may have diluted the effect of intra-regional income inequality on life expectancy. It has been suggested elsewhere that this effect may be observed more readily on an national scale or in countries where income inequality is much greater than in England and Wales (for example, the USA). Also, the nationalised nature of the welfare state and other public services in the UK may mean that more subtle measures of social status are required to identify such patterns.30,31
The differentials in life expectancy shown in this study between the most affluent and the most deprived areas of England and Wales are substantial. A recent WHO report ranked its 191 member countries in order of life expectancy at birth. Overall, the UK ranked 21st for males and 25th for females. The mortality experience of the most affluent quintile of England and Wales reported here would rank first among these 191 countries for males and sixth for females. Conversely, the life expectancy of the most deprived quintile is equivalent to the 35th for males and the 37th for females, similar to middle income countries.32
The differentials observed here probably underestimate the underlying pattern, because dividing the data into quintiles on the basis of ward will tend to attenuate the effect. This is because ward populations are quite large and economically diverse, and categorisation of people by ward of residence will dilute mortality differentials between the most deprived and most affluent groups. Therefore, although the correspondence between area based deprivation measures and life events has been shown to be high in England and Wales,33 our results are best considered as a conservative representation of the underlying pattern.
The population denominators for England were based upon estimated counts, but they are unlikely to be consistently biased as they underwent extensive consultation during development.16 Applying the age structure of each local authority from the 2001 census to its constituent wards assumes that each ward has a similar population structure, and that it is a good estimate of the 1998 structure. Inaccuracies where this assumption is breached can be shown to be greatest at the boundaries of each age band (data not shown). However, the method used to smooth the observed mortality rates will have minimised both this error and the impact of under-registration of infants in Wales (Chamberlain K, personal communication). The recognised inflation of population counts in Wales at ages above 1 year (Chamberlain K, personal communication) will tend to reduce the observed mortality, but only differential inflation by deprivation quintile would compromise the observed deprivation differences. Mortality rate ratios between the most affluent and deprived groups for Wales suggest that population under-counts in the most deprived quintile would need to exceed 10% for men and 20% for women to nullify the patterns observed (data not shown).
Policy implications
The poverty focus of current health policy to reduce geographical differentials in mortality is appropriate, but should be aimed at those under 75 years of age. The estimates provided in this paper offer a baseline against which the effects of this policy can be evaluated in due course.
Our results are consistent with separate data sources such as a recent analysis of the England and Wales longitudinal study,34 where estimated life expectancy at birth for 1997–1999 was only three months lower than ours, for both sexes, while the deprivation specific estimates reported here are contained within the range of their reported life expectancies by social class.
We have shown that mortality in England and Wales varied by region in 1998, but that this geographical variation can be largely explained by the distribution of deprivation. Current health policy in the UK is focused upon the impact of poverty: it aims “to reduce, by at least 10 per cent, the gap between the … areas with the lowest life expectancy at birth and the population as a whole” by 2010.4 The pronounced differences in life expectancy and mortality presented here support the poverty centred focus of this policy framework, suggest that it should be aimed primarily at those under 75 years of age, and provide a baseline against which it can be evaluated.
Acknowledgments
The authors are grateful to Dr Chris Dibben and Professor Michael Noble at the Social Disadvantage Research Group, Oxford University, Kate Chamberlain at the Local Government Data Unit for Wales, Cardiff, and Dr Mike Quinn and Nicola Cooper at the National Cancer Intelligence Centre, ONS, for providing necessary data.
REFERENCES
Footnotes
-
↵* For simplicity, from here on we will use the term “ward” to refer to the electoral wards in England and the electoral divisions in Wales.
-
↵† Henceforth the term “region” will be used to refer to the nine government office regions (GOR) of England and Wales.
-
Funding: Cancer Research UK grant no C1336/A2990: Trends in socio-economic inequalities in cancer survival, England and Wales, up to 2000.
-
Conflicts of interest: none declared.
-
Ethical approval: data in public domain.
The complete set of life tables is available in electronic form from the authors.