Article Text

Abstract
Study objectives: To examine if social networks with children, relatives, friends, and confidants predict survival in older Australians over 10 years after controlling for a range of demographic, health, and lifestyle variables.
Design: Prospective longitudinal cohort study (the Australian longitudinal study of aging)
Setting: Adelaide, South Australia.
Participants: 1477 persons aged 70 years or more living in the community and residential care facilities.
Main results: After controlling for a range of demographic, health, and lifestyle variables, greater networks with friends were protective against mortality in the 10 year follow up period. The hazard ratio for participants in the highest tertile of friends networks compared with participants in the lowest group was 0.78 (95%CI 0.65 to 0.92). A smaller effect of greater networks with confidants (hazard ratio = 0.84; 95%CI = 0.71 to 0.98) was seen. The effects of social networks with children and relatives were not significant with respect to survival over the following decade.
Conclusions: Survival time may be enhanced by strong social networks. Among older Australians, these may be important in lengthening survival.
- mortality
- social networks
- social environment
Statistics from Altmetric.com
Over the past quarter century, epidemiological studies conducted in the USA,1,2,3,4,5,6,7,8,9,10 Europe,11–16 and Asia17,18 have generally, but not always,19–23 shown that social relationships have beneficial effects on survival in adults. The convergence in findings is impressive given that the follow up time in these studies has ranged from two17 to 17 years,6 sample sizes have ranged from several hundred2 to more than 17 000 participants,11,12 and the participants’ ages have varied from 18 to 94 years. Despite the general consensus of positive effects of social relationships upon survival, several questions remain unanswered concerning the effects of social relationships on mortality in older people.
Firstly, it is unclear if all social relationships are equally beneficial to survival among older people or if specific types of relationship are more advantageous. Research by Seeman et al6 suggested ties with close friends or relatives, or both, may protect against mortality in older people. However, this work did not distinguish between ties with friends compared with relatives. Little other research has distinguished between the effect of kin and non-kin, or discretionary, social relationships on mortality.
Secondly, most research concerning social relationships and mortality has been conducted in North America. Four studies cited above that found no effects of social relationships on survival used Australian data.19–22 Some of these studies were small19 or used a narrow range of measures of social relationships,20 so it is possible that their findings were attributable to methodological features rather than the true absence of an effect of social relationships upon mortality. For example, a comprehensive study by Korten et al21 included variables concerning social integration and availability of attachments, but did not differentiate between types of social relationships. Similarly, McCallum and colleagues22 considered emotional social support and social participation as potential predictors of survival over seven years of follow up, but again did not consider different types of social relationships.
Thirdly, some authors have reported a threshold of social relationships above which little survival advantage is gained.1–4 We have found no research that has formally tested the hypothesis of threshold effects of specific types of social relationships upon mortality, and only one study that considered threshold effects included older participants.2
Finally, social relationships have been defined in many ways.24 Many studies have used single variables that purport to measure social relationships, but do not capture the wider social integration of an individual. Four composite measures of social networks were recently developed by Glass et al25 using data from a large US longitudinal study of aging. These specific social network measures incorporated the structure and specificity of network ties with children, other relatives, friends, and confidants. The measures were designed to aid in identifying the most “health-beneficial” social relationships for older people,25 and to overcome many of the problems inherent in epidemiological studies that have examined the effects of social relationships upon health.
We validated the measurement model developed by Glass et al using data from the Australian longitudinal study of aging (ALSA).26 The resulting measures of specific social networks are used in this study. The aims of this study were to (1) assess the effects of specific social networks on 10 year mortality in older Australians and (2) test for the existence of a threshold effect of different types of social networks on 10 year mortality.
METHODS
We drew data from the ALSA that began in 1992 in Adelaide, South Australia. ALSA’s major objectives were to assess the effects of social, biomedical, behavioural, economic, and environmental factors upon age related changes in the health and wellbeing of older persons.27 The study has been described in detail elsewhere.28,29 The primary sample was randomly selected from the South Australian electoral roll, and stratified by local government area, sex, and age group (70–74, 75–79, 80–84, and ⩾85 years). Older men were over-sampled to ensure sufficient numbers of men for longitudinal follow up. Persons were eligible for the study if they were resident in the Adelaide Statistical Division and aged 70 years or more on 31 December 1992.
Seven waves of data have been collected to date. Interviews with participants were held annually for the first four years and then roughly every three years. The relevant ethics committee approved the study, and each participant gave written informed consent.
Of the original sample of 3263 persons, 2703 were eligible for inclusion in the study and 1477 (55%) of these persons agreed to participate. Those who refused were slightly older and more likely to be female than the participants.29 We used data from the 1477 participants who completed a wave 1 interview. The retention of participants over the decade after wave 1 interview in the study was excellent, with more than 75% of surviving participants interviewed at wave 6.
Covariates
Social networks
Social networks with children, other relatives, friends, and confidants were hypothesised as predictors of survival. The derivation of these variables has been described25 and validated previously.26 The children network combined information on the number of children, proximity of children, and frequency of personal and phone contact with children. The relatives network was calculated from the number of relatives (apart from spouse and children) the participant felt close to, and the frequency of personal and phone contact with these relatives. The friends network captured the number of close friends, personal contact, and phone contact. The confidant network reflected the existence of confidants and whether the confidant was a spouse. A total social network score was calculated as the sum of the children, relatives, friends, and confidant network scores. All component variables were standardised before the derivation of the social network variables.
We included the social networks variables as either continuous or categorical in subsequent analyses, dependent on the analyses being undertaken.
Demographic, health, and lifestyle variables
To control for confounding in the analyses, the effects of demographic, health, and lifestyle variables upon mortality were also considered. These covariates were derived from self reported wave 1 data. Demographic variables included age group, sex, and geographical area of residence. Place of residence was classified as community or residential care. Current marital status was classified as married/partnered or not married. Annual household income was coded as less than or equal to $A12 000, more than $A12 000, or missing. This cut off point for income was similar to the single persons’ aged pension rate in 1992. The age at which the participant left full time education was categorised as less than or equal to 14 years of age or more than 14 years of age. This cut off point for education was chosen as about half of the sample left school aged 14 years of less; there was no legal minimum school leaving age for this cohort. Other analyses of ALSA data have used these education and income cut off points (for example, Andrews et al29).
Physical and mental health status were also incorporated in the analyses. Self rated health was classified as excellent/very good, good, and fair/poor. The number of chronic conditions was derived from self reported information on whether each participant had ever suffered from 10 common conditions.30 Disability was assessed via mobility.31 Participants were defined as having no mobility disability if they reported they were able to walk up and down a flight of stairs and walk half a mile without help. If either or both of these activities could not be completed, they were classified as having a mobility disability.30 Self reported hearing and visual difficulty were also included. Depressive symptomatology was assessed using the 20 item CES-D scale,32,33 with scores of ⩾17 out of a possible 60 suggesting symptoms of depression. Cognitive function was measured using a subset of items from the mini-mental state examination.34,35
Health behaviours were also considered. Participants were classed as current, former, or never smokers based on their responses to questions concerning smoking. Participants were classified as having a hazardous drinking problem if their score on the 10 item AUDIT scale was eight or more.36 Participants were classified as exercisers or sedentary based on questions about the exercise undertaken in the previous fortnight.28
Statistical analyses and data linkage
Survival status was ascertained by searches of official death certificates conducted by the Epidemiology Branch of the Department of Health in South Australia, and deaths were confirmed by the South Australian Births, Deaths and Marriages bureau. Full name, date of birth, and last known address of ALSA participants were used in the data linkage with the deaths database. If no direct match was made, the electoral roll was checked for errors in birth dates, changes or errors in recorded name, and changes or errors in recorded address. The few participants who died interstate or overseas could not be identified through this method, as the deaths database only includes deaths that occur in South Australia. Informants nominated by ALSA participants at wave 1 were contacted if participants could not be located at subsequent interviews. The date of death supplied by informants was used if a participant died outside of South Australia. These methods of death ascertainment for ALSA participants have been validated previously.37
The response variable was the number of days to death from wave 1 interview for decedents and 3653 days for participants who survived 10 years after their initial interview.
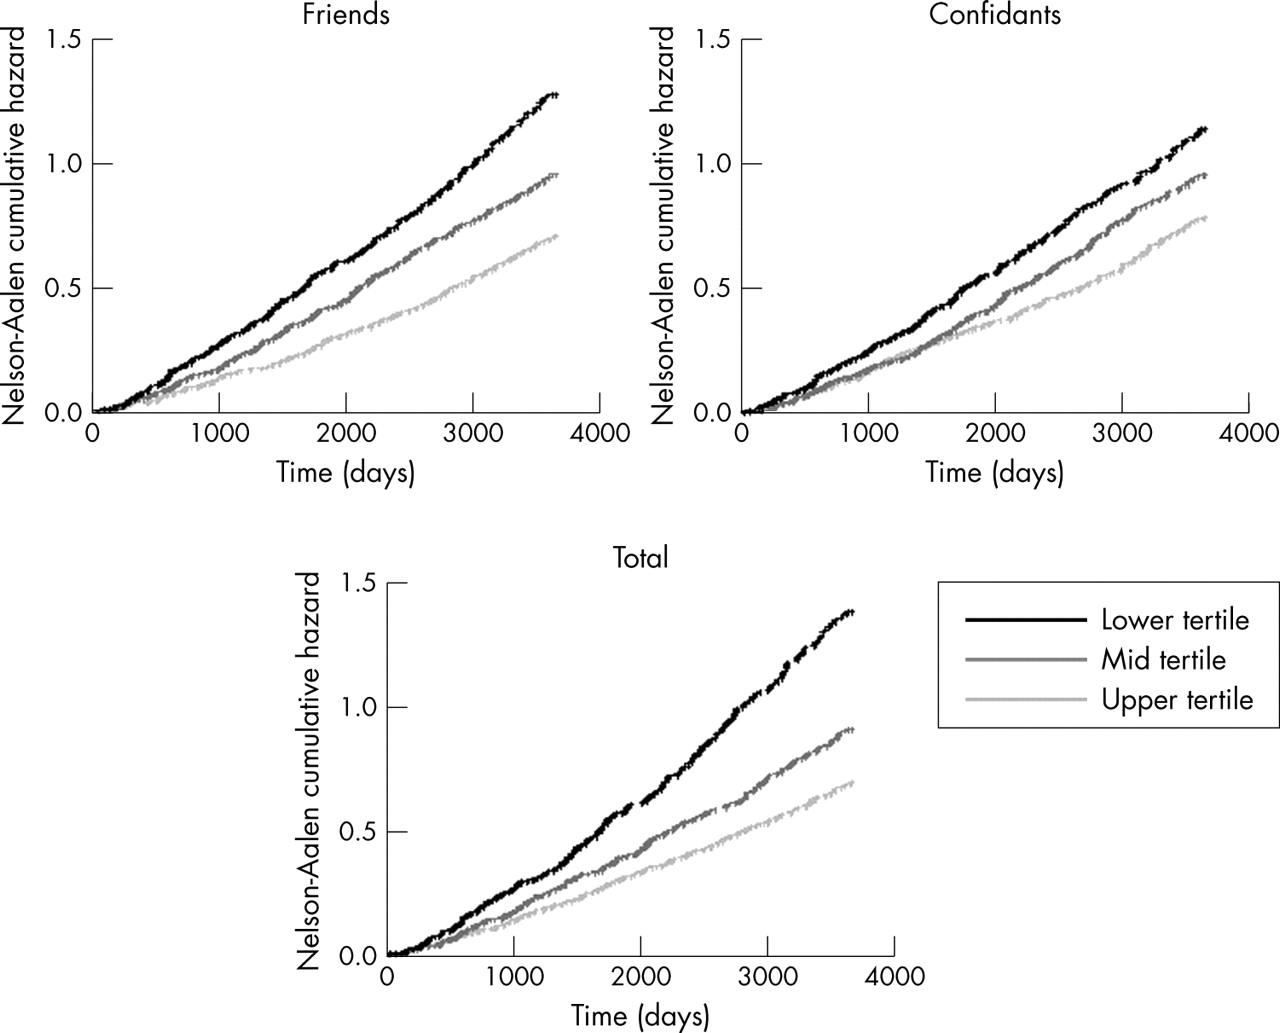
The cumulative hazard of death over time was compared graphically for the centile based classification of each social network type using the Nelson-Aalen cumulative hazard estimator.38,39 Broadly, a higher cumulative hazard curve indicates a greater risk over time.
For each type of social network, a separate Cox proportional hazards model was fitted to the data,40 controlling for the demographic, health, and lifestyle covariates. The Efron method was used to correct for ties in the time to death.41
The existence of threshold effects was investigated within the framework of the proportional hazards model. For each of the social network variables, we considered separately thresholds corresponding to the tertiles. For example, to test for a threshold at the 33⅓rd centile, a dummy variable showing whether the social network observation lay above this centile point was included in the proportional hazards model along with the original continuous variable. A significant dummy variable indicated a threshold effect.
Backward elimination was used to remove non-significant covariates from the regression equations. The fit of models was assessed using graphical methods based on martingale residuals.42,43 The assumption of proportional hazards was assessed by regressing the scaled Schoenfeld residuals against the log of time and testing for zero slope. A non-zero slope provided evidence against proportional hazards.44 Stata version 8.0 was used in all analyses (Stata Corporation, College Station, TX).
RESULTS
Table 1 shows the characteristics of the 1477 participants at wave 1 of ALSA. At the 10th anniversary of the wave 1 interview, 570 participants (326 male; 57%) were alive and the remaining 907 participants (602 male; 66%) had died. The mean specific and total network scores were higher for the participants who survived 10 years after the wave 1 interview than for the participants who died in the intervening decade. Tables detailing the relation between each type of social network and the covariates are available from the first author upon request.
Summary statistics for 1477 participants in wave 1 of ALSA
Age group, sex, local government area, place of residence, number of morbid conditions, cognitive function, self rated health, and smoking status were significant predictors of survival when the effects of the other covariates were considered, and all subsequent analyses adjusted for these variables. Table 2 presents the hazard ratios associated with these variables. Non-proportional hazards were evident for mobility disability, and therefore all analyses were stratified by disability status.
Adjusted hazard ratios for effect of covariates on 10 year survival*
The continuous social network variables were fitted and the results are summarised in figure 1. Plots of martingale residuals against the respective social network variables confirmed that a linear functional form was appropriate for these variables. There was a significant protective effect of larger friends and total social networks against mortality. The effect of networks with confidants was marginally significant, and again showed a protective effect. The effects of social networks with children and relatives were not significant.
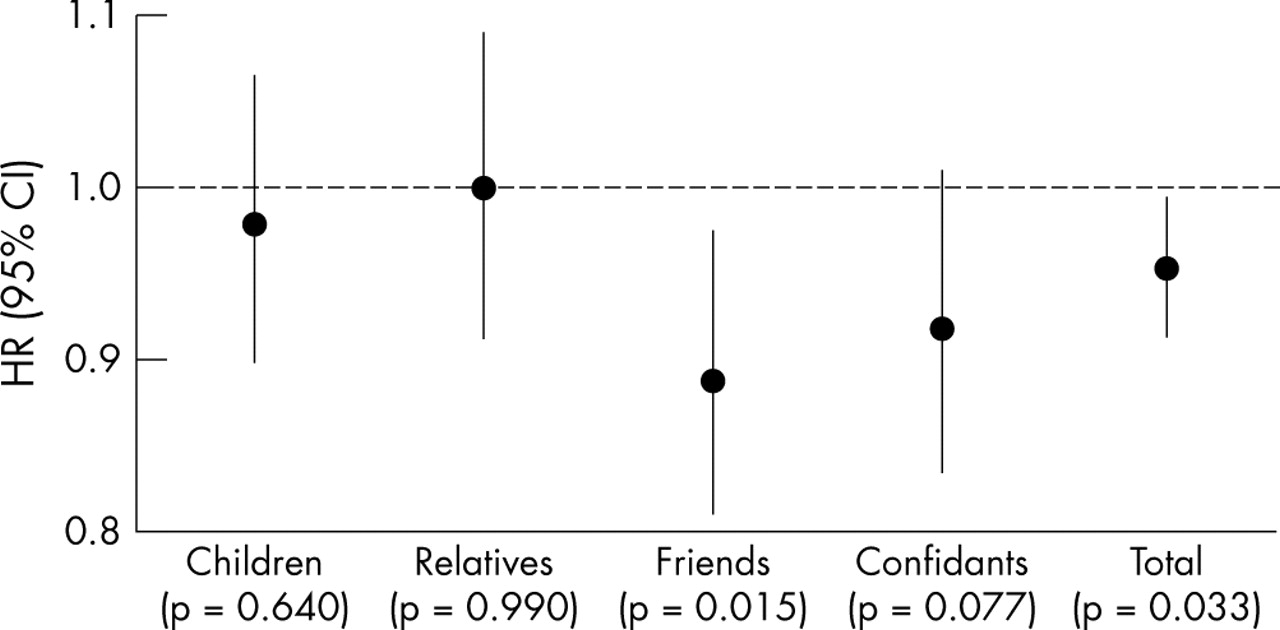
Summary of adjusted hazard ratios (HR) and 95% confidence intervals (95%CI) from Cox proportional hazards models for specific and total social networks.
The existence of a threshold effect of social networks was investigated using the dummy variables corresponding to the tertiles, and were not significant in any analyses.
The hazard ratios corresponding to the tertile groupings are shown in table 3 for friends, confidant, and total social networks. The table shows a gradient in terms of the social network variables. The effect of the friends network on survival was greatest for those with the greatest networks of friends (that is, in the upper tertile of the friends network distribution). The effect of the confidant network was beneficial to survival for those in both the middle and upper tertiles of confidant networks.
Summary of adjusted hazard ratios for categorised social network variables
Figure 2 shows the observed Nelson-Aalen cumulative hazard estimates in days from the wave 1 interview for friends and confidant networks and total social networks. In each case, the groups defined by stronger networks have a lower cumulative hazard and hence a lower risk of mortality over time.

Nelson-Aalen cumulative hazard estimates by type of social network.
DISCUSSION
This study builds on previous work concerning social relationships and mortality. Most other studies have used ad hoc measures of social networks. Furthermore, there is a paucity of research that has examined the effects of specific social networks upon mortality. Through the use of objective measures of specific social networks, developed originally for a US sample and validated in ALSA, we have shown that greater social networks with friends and confidants had significant protective effects against mortality over a 10 year follow up period. Networks with children and relatives were not significant predictors of mortality over the same follow up period. This highlights the importance of disaggregating kin and non-kin networks, rather than relying on measures of total social networks.
Key points
-
Better social networks with friends and confidants predict survival over the following decade in older Australians.
-
No effect of social networks with children or relatives upon survival was found.
-
We did not find a threshold effect of specific social relationships upon survival.
The finding that total social networks are protective against mortality suggests overall social integration is important, and reinforces findings from other studies of older people.2,6,15,16,18 Previous Australian studies19–22 have not shown an effect of social networks on mortality. However, these studies were generally smaller or did not consider the specific types of social networks that were investigated in this study. Differences in the definitions of social relationships and different analyses may have contributed to the disparities in previous reports.
Earlier research has shown social relationships with close friends and/or relatives were protective against mortality in older adults,6 and subsequent research45 also pointed to the importance of a confidant in the perceived adequacy of social support. By differentiating between friends, children, and other relatives, we were able to show that it is friends, rather than children or relatives, which confer most benefit to survival in later life. Our finding of a marginally significant effect of confidants upon survival suggests that discretionary relationships, with friends and confidants, as compared with relationships where there is less choice concerning interaction, with children and relatives, have important positive effects on survival. This is consistent with the socioemotional selectivity theory proposed by Carstensen and colleagues,46 in showing that with age, one’s social choices may become more selective as a means of regulating emotions.
The results from this study raise important questions about how social networks with friends in particular impact upon mortality. The causal relationship between social networks and health is not well understood.47 A recent review48 proposed culture, socioeconomic factors, politics, and social change condition the extent, shape, and nature of social networks. In turn, social networks provide opportunities for “psychosocial mechanisms” that include social support, social influence, social engagement, interpersonal contact, and access to financial and health care resources. Psychosocial mechanisms may have an impact upon health through behavioural, psychological, and physiological pathways.48 If we consider social networks within this framework, networks with friends may exert an influence upon health behaviours such as smoking, alcohol consumption, and exercise, variables that were controlled for in our analyses. Friends possibly also encourage health seeking behaviour, which in turn can affect survival. Friends can have effects on depression, self efficacy, self esteem,49 coping and morale,50 or a sense of personal control,51 possibly through social engagement by reinforcing social roles48 or because interactions with friends stem from choice52 or selectivity.46
Policy implications
Strong social networks of discretionary relationships are important in ensuring longer survival. Strategies to promote the establishment and maintenance of such relationships in later life deserve further attention.
The effects of specific social networks upon mortality in our study were of a similar magnitude to those we have seen for self rated health and number of morbid conditions. Furthermore, social network variables exerted an effect on mortality 10 years after they were measured. For the effects to be sustained over this long period suggests social networks are powerful factors in protecting against premature death. These baseline effects persisted even though many other changes may have occurred for participants in the decade after the wave 1 interview, including widowhood, deaths of friends, siblings, children, or geographical relocation of some members of their overall social network. Future work is planned to assess changes in social networks among ALSA participants, and the impact of any changes upon mortality.
The findings from this study must be interpreted with several caveats. A wide range of covariates were included in the analyses, but complete data were unavailable for some potentially important factors, such as diet. However, given that diet contributes to overall health, our covariates indirectly capture this potential effect. ALSA was not explicitly designed to examine the effects of social networks on mortality, and the analyses are based on self reported data and adjust for covariates measured at baseline. However, these same limitations are true of most studies that have considered social relationships and mortality in older adults. The non-respondents to ALSA may have been more socially isolated than participants, although non-response bias has generally been shown as minimal in other analyses of ALSA data.29,53,54 We believe these restrictions are balanced by ALSA’s strengths, which include the richness of the baseline data, the Australian setting, and the inclusion of residents in aged care facilities. ALSA included a more heterogeneous population sample than many other longitudinal studies of aging.
In summary, we have shown that better social networks with friends and confidants predict survival over the following decade in a large cohort of older Australian men and women. Strong social networks of discretionary relationships may be important in ensuring longer survival.
Acknowledgments
We thank the participants in the Australian longitudinal study of aging, who have given their time over many years, and without whom this study would not have been possible. Sabine Schreiber of the Centre for Ageing Studies, Flinders University, and the Epidemiology Branch of the Department of Health in South Australia are also thanked for their assistance with tracing participants and identifying deaths.
REFERENCES
Footnotes
-
Funding: this study was supported in part by grants from the South Australian Health Commission, the Australian Rotary Health Research Fund, and the US National Institute on Aging (grant no AG 08523-02).
-
Competing interests: none declared.
-
Ethics approval: ethics approval for the study was granted by the Committee on Clinical Investigation, Flinders Medical Centre, South Australia.