Article Text

Abstract
Study objectives: (1) to develop an indicator of socioeconomic position based on the social standing of the habitat (SSH), that is, the residential building, its immediate surroundings, and local neighbourhood; (2) to assess the relation of SSH to two usual markers of socioeconomic position (education and occupation) and a known, socially determined health outcome (hypertension).
Design: Population survey measuring SSH, detailed educational and occupational histories, and blood pressure. The SSH is a standardised assessment of the external and internal aspects of someone’s building (or house), and of the characteristics of its immediate surroundings and local neighbourhood.
Setting: A sample of participants to the Bus Santé survey between 1993 and 1998, in Geneva, Switzerland.
Participants: 588 men and women, aged 35 to 74.
Main results: The SSH index was highly reproducible (κ=0.8). Concordance of SSH with education or occupation was good for people of either high or low socioeconomic position, but not for those with medium education and/or occupation. There was a higher prevalence of hypertension in the lowest compared with the highest groups, defined on the basis of education or occupation, but the SSH was the only indicator that showed a higher prevalence of hypertension among people in the middle of the social spectrum.
Conclusions: People of medium education or occupation are heterogeneous with respect to their habitat. Those living in habitats of medium social standing may be most affected by hypertension but this association could not be revealed on the basis of education and occupation alone. The habitat seems to capture different aspects of the socioeconomic position compared with the usual indicators of social class.
- social standing of the habitat
- socioeconomic position
- hypertension
Statistics from Altmetric.com
Education, occupation, and income are commonly used to measure a person’s socioeconomic position but have well known limitations.1 The educational level cannot measure changes in adult life2 and a higher education has become more prevalent.3 The current or longest occupation cannot fully describe the person’s occupational history, and increasing numbers of people spend time outside the workforce.4–6 Income questions have high non-response7 and often do not include inherited wealth, ownership of assets, savings, benefits, and earnings from the informal economy.8 These multiple sources of misclassification tend to bias the real magnitude of inequalities. In addition, each indicator captures a different aspect of the socioeconomic position.9–13
There is a need for developing indicators that overcome or at least compensate these limitations. The place where the person lives, called hereafter habitat (defined as the residential building, its immediate surroundings and local neighbourhood14), has the potential to reflect aspects of someone’s effective socioeconomic position that are not captured by traditional markers. Imagine for example a person of modest social origin, who did an apprenticeship before finishing high school, has been employed in a medium level occupation but lives with a partner who has a larger income. The habitat of that person is more likely to reflect the effective socioeconomic position of the household while variables such as education and occupation may underestimate it. In most societies, the habitat is more than just shelter. It is a societal marker for achievement, acceptance, and recognition,15 reflecting the person’s and their household’s social position, preferences, and priorities.16,17 Indeed, there is a growing interest for measuring area and neighbourhood characteristics that are markers of socioeconomic position at the group level.18–21 In that perspective, the habitat may delimit a socially more homogenous population compared with measures based on census or other administrative criteria.22
We postulate that the social standing of the habitat synthesises the contribution of several socioeconomic markers, such as occupation, education, household income, and area characteristics, to determine someone’s socioeconomic position. In this paper, we describe the methodology used to develop the social standing of the habitat (SSH) indicator, and assess its relation to two usual markers of social status (education and occupation) and to a known, socially determined health outcome (hypertension).
METHODS
Sample
A random sample of 600 men and women was selected among the 6729 who participated in annual surveys of cardiovascular risk factors conducted in Geneva between 1993 and 1998.23 The sample was stratified by level of education (three categories), level of current occupation (four categories with currently non-working people in a separate group), gender, and the year the person participated in the health survey. We excluded people living in buildings that no longer existed (n=11) or in a hotel (n=1).
SSH
To characterise the habitat’s socioeconomic standing we assessed three separate aspects: the building where the person lives, its surrounding area (defined as the immediate area around the building or house, the contiguous streets and the elements that would characterise them, for example, the presence of a park or an industry nearby) and, the neighbourhood where the building was located (using lay people’s boundaries). These three levels of assessment permitted a fine classification. For example, similar buildings located in areas with different social characteristics could have different final SSH grade.
In a pilot study we prepared lists of morphological characteristics that differentiate buildings in Geneva,24 jointly with lists of characteristics that described the socioeconomic aspects of buildings and areas. We reduced these lists to the aspects more often found and that allowed to differentiate the social standing of habitats. The goal of the SSH indicator being to capture socioeconomic position, these characteristics were not necessarily disease risk factors in themelves.
The SSH form
The form to evaluate the social standing of the habitat was divided into three sections corresponding to (1) the neighbourhood, (2) the streets and area surrounding the building, including stores, green areas, traffic, suburbs or satellite cities, dirtiness, graffiti, etc, and (3) the external and internal aspects of the building such as material used for construction, sumptuousness, degree of dirtiness, graffiti, etc.
To standardise the procedure throughout the habitats, each section of the form contained the list of items and descriptors obtained in the pilot study. There was additional space to write free notes for specific characteristics that helped classifying a particular habitat. Each item was graded in a scale of five levels: high, medium-high, medium, medium-low, and low. The final classification summarised the grades given to all items, although there was no systematic procedure to add or average the grades across sections, as not all characteristics were necessarily present or had the same weight in each habitat. To minimise subjectivity two raters independently measured each habitat and decided on the final grade by consensus. An additional visit to the building was done in case of disagreement. Digital photographs were taken and stored in a database and were used during this reviewing process. Appendices 1 and 2 display photographs of the immediate surroundings and internal aspects of buildings belonging to habitats classified as high, medium, and low SSH (see journal web site).
The computerised database of the housing department provided information on the buildings that received governmental subsidies. Eligibility for a subsidy depends on the household income, the number of people living in the apartment and the number of rooms in the apartment. Based on these criteria subsidies can be high, medium, and low.
Reliability study
To evaluate the reliability of the SSH index an independent rater re-evaluated 60 habitats (10% of the original sample).
Bus Santé Survey
Each subject of the sample had previously participated to the Bus Santé survey, an ongoing, community based survey of lifestyle risk factors conducted continuously since 1993.23
The educational history was categorised as low (up to eight years of schooling), medium (9 to 12 years of schooling) and high (13 or more years of schooling including people who obtained the Swiss baccalaureate). Occupational history assessed up to three occupations held at different times. Current occupation was used for those currently working at the time of the survey and the longest occupation ever held for those not currently working. All occupations were grouped in three categories using the British Registrar General’s Scale25: high (I and II from the original British classification: professional and intermediate professions), medium (III-N: non-manual occupations), and low (III-M, IV, and V: manual or lower occupations).
Systolic and diastolic blood pressures were measured corresponding, respectively, to the first and last Korotkoff sounds. Hypertension was defined as systolic blood pressure≥140 mm Hg and/or diastolic blood pressure≥90 mm Hg and/or receiving treatment for hypertension.26
Statistical analysis
The reliability of the SSH index was assessed with weighted κ.27 Weights of 1 were given for complete agreement and we performed several computations with weights of 0.6, 0.7, and 0.8 for disagreements within one contiguous level. Disagreements of more than one level were given a weight of 0 in all computations.
Differences in the distributions of the educational and occupational groups by levels of the social standing habitat were tested with the χ2 test of homogeneity of proportions. A cell significantly contributes to the statistical significance of the global χ2 test if it has a value of 3.84 (95th centile of χ2 with 1 df) or more.28 That is, the observed number of subjects in this cell is higher or lower than would be expected assuming similar distribution of habitat levels across educational or occupational groups.
The associations of SSH index with occupation and education levels and with hypertension were estimated using the odds ratio (OR) and 95% confidence intervals (CI).
RESULTS
The weighted κ between the two ratings of 60 habitats was 0.8 for weights of 1.0, 0.8, and 0. The corresponding κ values were 0.7 for weights of 1.0, 0.7, and 0; and 0.65 for weights of 1.0, 0.6, and 0. All disagreements between the two ratings were within one level.
People living in buildings of middle social standing were slightly younger (p value =0.02) and had more often changed address (table 1). Lower social standing buildings were more subsidised. A higher proportion of single, widowed, or divorced women lived in lower standing habitats (not statistically significant).
Descriptive characteristics of the participants by the social standing of the habitat where they lived. Geneva, Switzerland, 1999
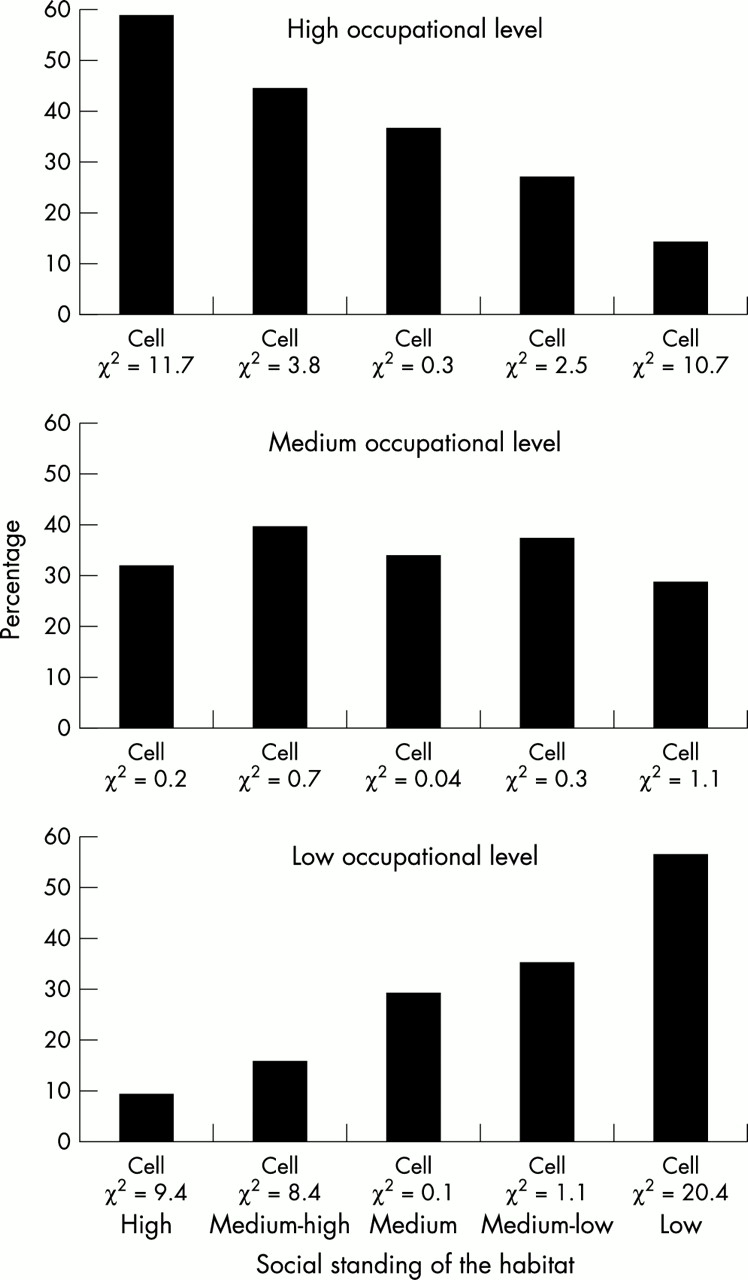
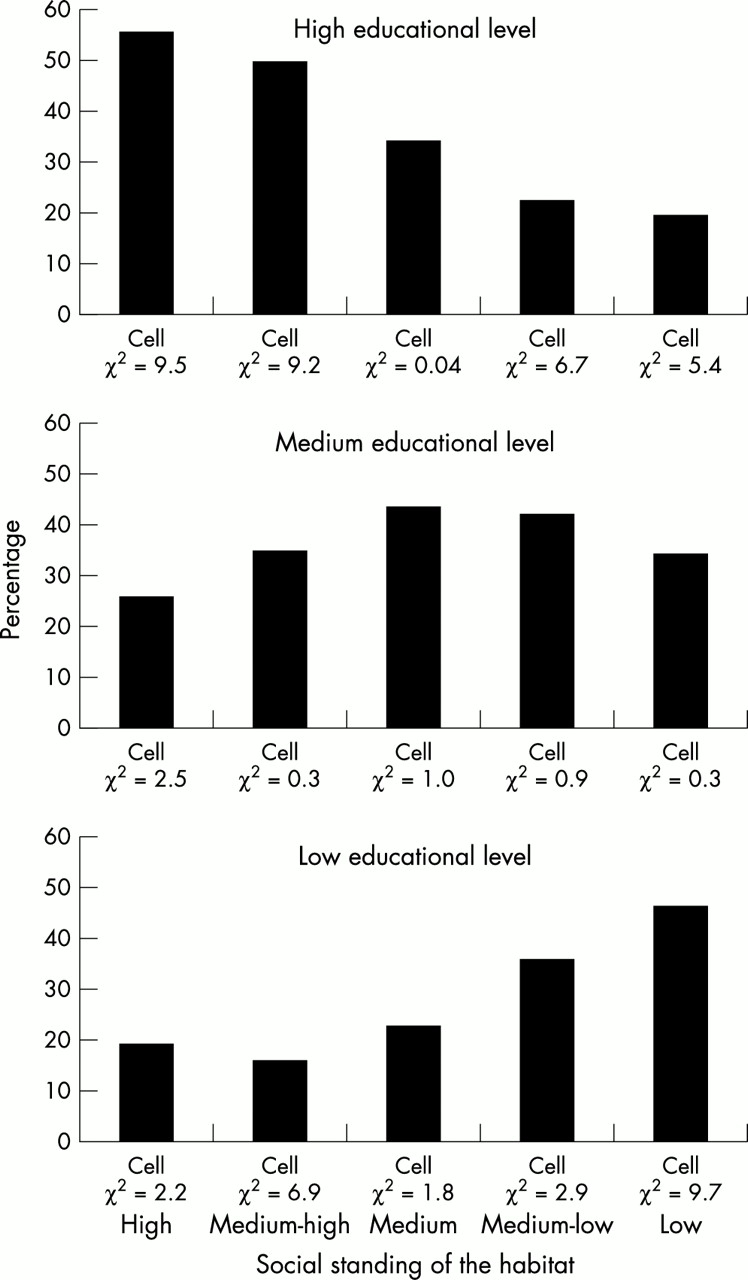
Almost 60% of people living in habitats of high SSH had a high occupational level, significantly exceeding what would be expected if similar number of people lived in all type of habitats (cell χ2=11.7) (fig 1). Most inhabitants of low standing habitats were of low occupational level (cell χ2=20.4). In contrast, all habitats had a similar proportion of people with medium occupation (cell χ2≤1.1). Similar results were found for education (global χ2=59.3, 8 df, p<0.0001) (fig 2).

Distribution of occupation (current or longest occupation if not currently working) by the social standing of the habitat*. Geneva, Switzerland 1999. Global χ2 = 70.8, 8df, p value < 0.0001; “cell χ2” indicates the contribution of each cell to the global test. Proportions add to 100% by categories of SSH.

Distribution of education by social standing of the habitat*. Geneva, Switzerland, 1999. Global χ2 = 59.3, 8df, p value < 0.0001; “cell χ2” indicates the contribution of each cell to the global test. Proportions add to 100% by categories of SSH.
The OR of having medium compared to high occupation increased with decreasing SSH (OR trend p = 0.006) (table 2). The ORs of having low occupation were 2.2, 4.9, 8.1, and 24.2 for medium-high, medium, medium-low, and low habitats, respectively (trend p<0.0001) (reference category: high SSH). Similar results were found for medium and low education. The ORs of having low education increased from 0.9 for medium-high to 6.9 for low habitats (trend p< 0.0001). These associations were not modified after adjusting for other sociodemographic variables (results not shown).
Association of the occupational and educational level with the social standing of the habitat. Geneva, Switzerland 1999
The proportion of people with hypertension was highest in habitats of medium social standing (adjusted prevalence = 56.7%) but within each level of the habitat, those with low education had the highest prevalence (fig 3). Similar results were obtained with the occupational level. Even though education and occupation predicted hypertension, they did not reflect the higher prevalence in medium social standing habitats (table 3).
Prevalence of hypertension*, odds ratio (OR) of having hypertension by social standing of the habitat (SSH), education, and occupation. Geneva, Switzerland 1999

Prevalence of hypertension* by social standing of the habitat and education. Geneva, switzerland, 1999. *Adjusted for age, gender, and whether the person lived in a subsidised building.
We repeated these analyses classifying the SSH in three levels (several groupings were tried) but the medium group remained always with the highest levels of hypertension compared with the high and low SSH (results not shown).
Using a more severe definition of hypertension (systolic blood pressure≥160 mm Hg and/or diastolic blood pressure≥95 mm Hg, and/or receiving treatment26) yielded weaker associations. The adjusted ORs (95% CI) for medium-high SSH were 0.6 (0.2 to 1.8), for medium 2.6 (1.0 to 7.1), for medium-low 2.6 (1.0 to 6.3), and for low 2.0 (0.7 to 5.6) compared with high level of SSH. The adjusted ORs for medium and low compared with high education were 1.1 (0.6 to 2.1) and 2.0 (1.1 to 3.9) respectively.
DISCUSSION
We showed that people of medium education and occupation, in contrast with those with high and low levels, are an heterogeneous group living in habitats of very different social standing. Despite the fact that lower education and occupation were associated with higher prevalence of hypertension, they could not reveal that the association was stronger among people living in habitats of medium social standing.
The SSH as an indicator of socioeconomic position
We postulate that the social standing of the habitat reflects the achieved socioeconomic position. The habitat is closely related to income, especially in urban populations where land is scarce.29 In European countries and the US a third of the income is spent in providing the family household.17,30 It is of note, that the SSH is highly dependent of the general wealth of the study population and the individual aspects of the SSH scale need to be adapted for each population.31 For example, aspects measured in studies of more segregated areas (broken windows, abandoned cars, etc)17,31,32 would not have been relevant to capture social variability in our study population.
Key points
-
The social standing of the habitat reflects the achieved socioeconomic position crystallising individual and area socioeconomic characteristics.
-
Characterising the “middle class” in more homogeneous subgroups may provide a key to understanding the health risks of 30% to 50% of the population.
-
People living in habitats of medium social standing are most affected by hypertension but this association could not be revealed on the basis of education and occupation alone.
The educational and occupational level may also be expressed in the SSH. The educational level is established in young adulthood and determines the potential level someone may achieve. The occupation reflects social position during adult life and has the ability to reflect someone’s social trajectory if several occupations are measured. In addition, the SSH included area socioeconomic characteristics, which have an independent role in predicting health.33–37
An important finding of this study is that the heterogeneity of the “middle class”, an increasing segment of the population,38 may not be reflected by the usual measures of socioeconomic position. Thus, using an indicator able to categorise them in more homogeneous subgroups may provide a key to understand the health risks of 30% to 50% of the population.
Despite the efforts to evaluate habitats in a standardised manner, the SSH indicator might still be a subjective indicator. However, the repeatability was high and all disagreements were within one level of SSH.
Measuring the SSH requires the training of two experienced raters. Training is easy but the data collection can be time consuming if the study design does comprise a home interview. We are working on developing a self administered questionnaire, which may not be as objective as the current indicator but will be applicable to most surveys. The latter could be combined with aerial pictures to assess the surroundings.
Hypertension and habitat
In our study, hypertension was more prevalent among people living in habitats of medium social standing, although, in all types of habitats those with lower education had the highest prevalence.
People with low individual socioeconomic position may have had more hypertension39–41 and if they were eligible for government subsidies they could have had access to medium SSH. However, after excluding all subsidised buildings the OR of hypertension for medium-high, medium, medium-low, and low social standing habitats were respectively, 1.9, 11.8, 6.0, and 4.9. Indeed, it was among non-subsidised buildings that the association of medium social standing habitats with hypertension was stronger.
The SSH could be a confounder if a non-measured factor causally related with hypertension was at the same time associated with medium SSH. Geographical studies relating the location of medium SSH compared with the other habitats could help elucidating whether an environmental, structural, or other factor could explain these results. For example, medium SSH could be located in the suburbs, where facilities are less accessible, resulting in more stressing commuting times.
Finally, this association may be real but missed by other measures of socioeconomic position, because people living in medium habitats are an amalgam of people with upward and downward mobility in the social scale, with heterogeneous levels of education and occupation. Although previous studies report higher hypertension in low socioeconomic areas31,42 none evaluated the habitat as a unit of analysis. How social class impacts on blood pressure is unclear43,44 but the relation does not need to be monotonous across low, medium, and high groups. In our sample, people living in medium SSH were younger and had more often changed address. Such hypothesis needs to be tested in different populations with a study specifically designed for this purpose.
Habitat is more than a measure of socioeconomic position
We have focused on habitat as a measure of socioeconomic position, but habitat can be more than that.45,46 Satisfaction with one’s house is an important criterion of wellbeing47,48 and includes aspects such as ownership, location, space, appearance, surrounding buildings, neighbours, and furnishings. In Great Britain, a study measuring different dimensions of quality of life found “finances/ housing/ standard of living” to be the item most often mentioned and the most important in a person’s life for 10% of the participants.49
The habitat reflects the prestige and commodities of an area, the children’s schools, the level of security against violence or vandalism, the existence of associative life and social support (for example, number and quality of contacts with neighbours, social pressure to live up to the standards of the area), which are important determinants in choosing the place where to live.36,50–53
Environmental studies have used housing characteristics and related them with specific health disorders.46 For example, physical or chemical exposures,54 biological exposures such as dampness and molds,55 physical characteristics of the house such as indoor air quality,56 or lack of toiletry.57 Thus, different aspects of the habitat can measure different concepts depending on the goal of the study.
Conclusion
Social inequalities in health have been long described and quantified but few attempts have been made to complement the traditional indicators or the information provided by administrative databases. This study shows that measuring the social standing of the habitat can classify an heterogeneous middle class and can offer new hypotheses into the nature of social inequalities affecting health.
Acknowledgments
The authors are indebted with Javier Nieto, Bruce G Link, Christoph E. Minder, Ana Diez-Roux and Michael C Costanza for their comments to an earlier version of this paper; Martine Bernstein for coordinating the data collection of the Bus Santé Survey; and Caterina Giovinetti and Olivier Bugnon for the data collection of the SSH study.
REFERENCES
Supplementary materials
. Web-only Appendices
Appendices 1 and 2 display photographs of the immediate surroundings and internal aspects of buildings belonging to habitats classified as high, medium, and low SSHFiles in this Data Supplement:
- Appendix 1: - Low Social standing of the habitat
- Appendix 1: - Medium Social standing of the habitat
- Appendix 1: - High Social standing of the habitat
- Appendix 2: - Low Social standing of the habitat
- Appendix 2: - Medium Social standing of the habitat
- Appendix 2: - High Social standing of the habitat
Footnotes
-
Funding: this study was supported by the Swiss National Research Fund (FNRS numbers 32-31.326.91, 32-37.986.93, 32-47219.96, 32-49847.96, 3200-054097.98, 32-57104.99).
-
Conflicts of interest: none.
Linked Articles
- In this issue