Article Text

Abstract
Study objective: This study investigates variation in management and treatment of lung cancer patients and determines the impact of any variation in treatment on survival.
Design: A retrospective study of population based data held by the Northern & Yorkshire Cancer Registry and Information Service (NYCRIS), comparing active treatment rates for lung cancer with survival by districts.
Setting: The then 17 districts in Yorkshire and South Humber, England.
Patients: 22 654 patients registered with lung cancer between 1986 and 1994 and followed up until end of 1996.
Results: The overall rates of active treatment (surgery, radiotherapy, and chemotherapy) varied between districts from 37% to 56%. One year survival (with 95% CI) was significantly better in the districts with highest rates of active treatment 23% (22% to 24%) compared with 19% (17% to 20%) for those with lowest treatment rates. Non-small cell lung cancer patients (55%) in the districts with highest active treatment rates had an age adjusted relative risk of death during the follow up period, relative to risk of death in the districts with the lower treatment rates of 0.88 (0.83 to 0.92). Clinically diagnosed patients (34%) had an age adjusted RR of 0.92 (0.86 to 0.96). RR in small cell cancer (11%) was not significant.
Conclusion: This study has shown wide variations in the rates of active treatment for lung cancer patients within districts across one large region of England. Active treatment was strongly associated with improved survival, especially in non-small cell lung cancer.
- lung cancer
- active treatment rate of district
- survival
- NSCLC, non-small cell lung cancer
- SCLC, small cell lung cancer
- ASI, age standardised incidence
Statistics from Altmetric.com
Lung cancer is the commonest cause of cancer death in the world, with about 37 000 cases being diagnosed in the UK each year.1 The survival statistics are among the worst for any malignancies, and have not improved in recent years.2 The median survival overall in the UK is between four and six months, with a five year survival of 5%.2–5 Five year survival in those receiving surgical treatment was 32% in Yorkshire and over 50% in more recent USA studies.6,7 Higher overall survival rates have been reported from many other European countries (Eurocare II study) and these differences have been ascribed to differences in health care.8
Lung cancer is the commonest cause of cancer death in the world
Lung cancer is a highly symptomatic disease, a feature that, when combined with the poor survival figures, makes prompt referral and good teamwork essential at every stage of management. Despite little change in the overall survival, many advances have the potential to improve standards of care. Many of these advances demand a high degree of specialisation and multidisciplinary care. Such recommendations appear in recent guidelines (SMAC, 1994; SIGN, 1998, NHSE, 1998; BTS, 1998 and 2001).9–13 Currently in the UK most patients present to their primary care practitioners and are then referred to hospital for diagnosis and treatment. An audit in Yorkshire found less than 50% presented with chest symptoms and a positive chest radiograph, but that such patients were more likely to be under the care of a lung cancer specialist (chest physician, thoracic surgeon, or oncologist). About 20%–25% of patients were managed by a variety of other specialists including medicine for the elderly, other physicians or surgeons, with only 9% having no lung cancer specialist opinion at all.14,15
Despite the large scale of the problem very little has been published on management and survival in lung cancer in a comprehensively studied population. A hospital based audit from Scotland (1991–92) showed variation in referrals and management of lung cancer patients treated by chest physicians and thoracic surgeons.3 A registry based study from 1995 from Scotland showed insufficient treatment of patients.5 A study from Merseyside, UK showed increased survival in patients who were actively treated for their lung cancer between 1974 and 1986.16 This study compares survival in relation to active treatment rates at a district population level.
METHODS
A retrospective study of population based data taken from the records of individual cases held by the Northern & Yorkshire Cancer Registry and Information Service (NYCRIS) was undertaken. Data collected for the former Yorkshire Region have been analysed in this report as this region has very high completeness of registration and the data are of demonstrably high quality.6 The population of this region of England is socially diverse but stable at about 3.6 million. The main bulk of the population lives in the old industrial areas of West Yorkshire or Humberside, with a large relatively sparsely populated, mainly agricultural area surrounding it.
All lung cancer patients diagnosed between 1986 and 1994 were included, with the exception of those patient subgroups where management data were known to be incomplete, which were excluded from the study. These were those cases registered by their death certificate only (1562 cases, 6.4%), those managed outside the then Yorkshire Region (192 cases, 0.8%; with 98 from Northallerton district—a district known to refer a high proportion of patients extra regionally), and those solely managed by GPs or in private practice (172 cases, 0.7%).
A diagnosis of lung cancer was accepted if there was a histological or clinical diagnosis of lung cancer. Clinical diagnosis of lung cancer is made from a combination of history and examination, particularly by chest radiograph. Although clinical diagnosis is less accurate than histological diagnosis it is generally accepted as correct.17,18
Age standardised lung cancer incidence rates were calculated to compare subgroups of interest, using the direct method of standardisation and the European standard population.4 Variation in histological confirmation, specialist management, and active treatment rates were analysed by patients' district of residence. Specialist management was defined as being formally (that is, not referred for opinion only) under the care of a chest physician, thoracic surgeon or clinical or medical oncologist. Active treatment rates (ATRs) were defined as the proportion of patients in each district who received any of the main treatment modalities. These were surgery (lobectomy or pneumonectomy), all chemotherapy, and either radical or palliative radiotherapy (if given as part of the initial treatment plan). Palliative radiotherapy was the commonest modality.
There were 17 health authority districts in Yorkshire region. These were divided into four groups on the basis of their overall rates of active treatment for lung cancer (ATR<42%; 42%–48%; 48%–54%; >54%). Survival was from date of diagnosis to date of death or censoring (1 January 1997). Survival at 6, 12, 18, and 24 months was assessed for each of the four district active treatment groups before and after adjusting for cell type using the Kaplan-Meier method. The impact of district active treatment rate upon relative risk of death was then calculated by Cox's proportional hazards regression 19 for all lung cancer, then separately for small clell lung cancer (SCLC), non-small cell lung cancer (NSCLC), and clinically diagnosed lung cancer. These analyses were repeated after adjusting for several factors (age, sex, socioeconomic status, disease extent, tumour type, period of diagnosis, district of residence, district standardised mortality rate, histological confirmation rate of district, treatment, and specialist management) and the relative risk of death was examined using Cox's proportional hazards regression.19 The proportionality assumption was tested at each covariate level. The baselines for comparisons are given in table 4. The reference entity is given a risk of 1.00, and is generally the factor that is considered to have the lowest risk.
RESULTS
The age standardised incidence rate fell from 104 to 84 cases per 100 000 in men but rose from 45 to 51 cases per 100 000 in women over the time period 1986–94. The age standardised incidence (ASI) was strongly correlated with socioeconomic status (Socio-Economic Profile Classification-10 Super Profile Groups 4). It varied from 100 lung cancer cases per 100 000 population in the most deprived group to around 40 lung cancer cases per 100 000 in the more affluent groups. ASI varied by district of residence being significantly above the Yorkshire average in four densely populated districts of the region, and with significantly lower incidence rates in five more rural districts in the region. The ASI was 61 cases per 100 000 varying from 42 to 80 across different districts (see fig 1). Adjusting for socioeconomic differences reduced the range from 52 to 76.
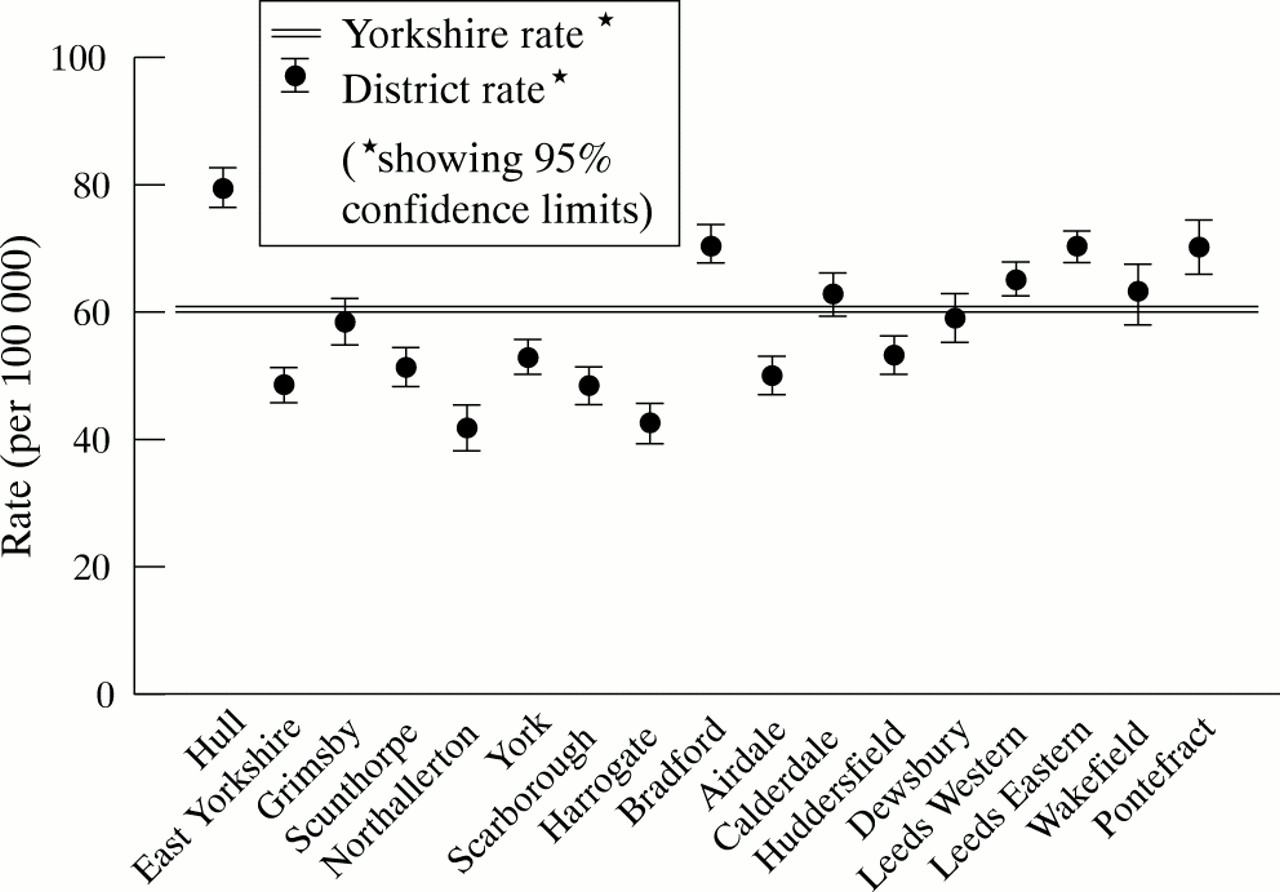
Age standardised incidence by district of residence.
A total of 22 654 cases were eligible for the study. Altogether 12 570 cases (55.5%) were histologically confirmed NSCLC, 2448 (10.8%) cases were histologically confirmed SCLC, 7636 cases (33.7%) were clinically diagnosed, and the proportions of NSCLC to SCLC in this group are unknown.
The proportion of cases by sex, age, and diagnosis is shown in table 1. Some 67% of cases were male and 31% of cases were over 75 years. The proportion of cases over 75 years within the 17 districts ranged from 26% to 39%. The proportion clinically diagnosed was 33.7% (district range 27.3% to 43%). The proportion diagnosed as NSCLC was 55.5% (range 45.3 to 60.4 %) and as SCLC 10.8% (range 3.2% to 13.8%).
Proportion of lung cancer cases by sex, age, and diagnosis 1986–94
The proportion of histologically confirmed cases was 66.3%. The histological confirmation rate varied by district, ranging from 57.0% to 72.7%. The proportion increased over the time period from 1986 to 1994. Sixty two per cent were histologically confirmed in 1986–88, compared with 69.8% in 1992–94.
Treatment rates varied by histological group with confirmed NSCLC having the highest rates of surgery (19.1%), and radiotherapy (44.8%) and confirmed SCLC having chemotherapy in 55.1%, and 28.3% having radiotherapy. Some 21.4% of clinically diagnosed lung cancer cases received no active treatment. There was no difference in ATR by sex but a clear gradient of decreased treatment by age of all histological groups. Treatment practices differed little by socioeconomic group. The most affluent group with NSCLC had 19.1% surgery and the least affluent had 18.6% surgery. With confirmed SCLC the most deprived group had more chemotherapy (56.8% to 52.1%) and radiotherapy (39.5% to 37.1%) than the most affluent group.
Treatment varied by district of residence. The proportion of patients having surgery was 11% (range 8.1% to 16.6%) The proportion of patients having chemotherapy was 9.5% (range 5% to 12.9%). The proportion of patients having radiotherapy was 35.9% (range 23.4% to 41.2%). Overall active treatment rates were 49.4% (range 36.9% to 56.1%). Treatment rates are shown in table 2.
Active treatment rates by district of residence (all lung cancer)
Specialist management also varied by district of residence. Overall a specialist managed 74.5% of cases (range 63.3% to 82.8%). The type of specialist varied by district with 21.1% being managed by a cardiothoracic surgeon (range 9.9% to 56.1%). The percentage managed by a chest physician was 53.6% (range 14.4% to 71.9%). The percentage managed by a clinical oncologist was 44% (range 25.8% to 53.6%). Over this period medical oncologists managed only 0.7% cases. Specialist management increased over the time period rising from 70.7% in 1986–88 to 78% in 1992–94.
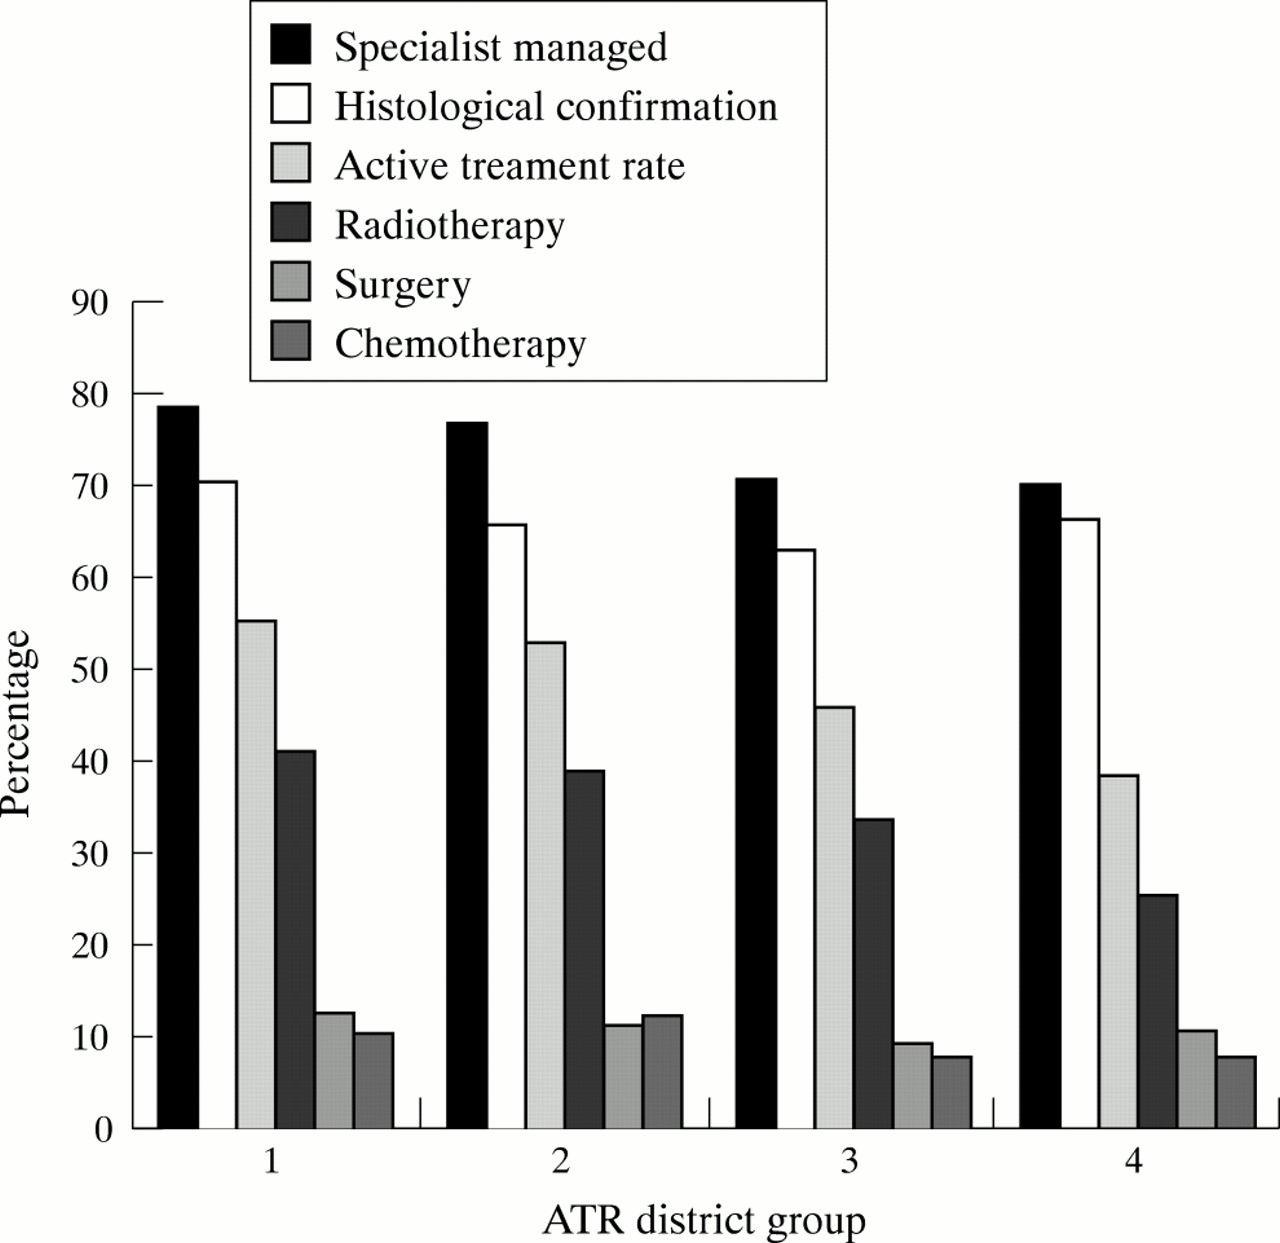
Treatment rates, histological confirmation rates, and specialist management rates by district group are shown in figure 2.
Active treatment rates by district of residence group.
Overall survival was 20.9% at one year and 4.4% at five years. Over the three time periods there were slight improvements in survival in all three groups from 1986–88 to 1992–94, though none of these reached significant levels. There was little difference in survival between socioeconomic groups, but the relative risk of death rose from 1 in socioeconomic groups 1–3 to 1.05 (1.01 to 1.1) in socioeconomic groups 8–10. This significant difference remained after adjusting for other factors.
Survival varied by tumour type being 27.6% at one year, and 7.1% at five years in NSCLC; 17% at one year and 1.8% at five years for SCLC; and 11.2% at one year and 0.9% at five years for clinically diagnosed cases. Survival varied by district of residence by histological type being 18%–31% in NSCLC, 10%–21% in SCLC, and 7%–18% in clinically diagnosed cases at one year and 7%–18%, 0%–8%, and 2–8% respectively at five years.
Survival was significantly improved in all histological groups treated by surgery and radiotherapy at one and two years, and in histologically confirmed cases treated by chemotherapy. Survival was significantly improved in those managed by at least one lung cancer specialist.
Survival varied with the active treatment rate of the district as shown in table 3. The greatest survival differences between the four groups of districts were observed at six months. At six months, the survival of non-small cell patients in the districts with the highest active treatment rates was 6% higher than that of the districts with the lower active treatment rates (49% compared with 43%) which is a statistically significant difference.
Survival by active treatment rate (ATR) of district
Adjusting for case mix factors (age, sex, and disease extent) in table 4 the relative risk of death (RR) rose higher with age being 1.91 (95% CI 1.76 to 2.06) in those over 75 compared with 1.00 in those under 50. There was a slightly higher RR of death in more deprived groups but this was barely significant being 1.05 (95% CI 1.01 to 1.10) in the most deprived group. RR of death decreased over the three time periods being 0.92 (95% CI 0.89 to 0.95) in 1992–94 compared with 1.00 in 1986–88. RR of death was better in those districts with active treatment and those with specialist management, both 0.37 (95% CI 0.36 to 0.38) compared with 1.00 without. Districts with a higher SMR (100+) for chronic obstructive pulmonary disease and ischaemic heart disease did worse (1.05, 95% CI 1.02 to 1.08) than those with a lower SMR (<100). RR of death was generally lower in districts with higher histological confirmation rates being 0.91 (95% CI 0.88 to 0.95) in districts with >70% compared with 1.00 in districts with <62% histological confirmation. The RR table (table 5) shows significantly lower relative risk of death for patients in those districts with the higher active treatment rates. This is both before and after adjusting for age differences (RR 0.88, 95% CI 0.85 to 0.91) for districts with higher active treatment rates of 54.1% and over, compared with districts with those in which rates were lowest (assigned a baseline RR of 1.00). The analysis was repeated separately for confirmed small cell, confirmed non-small cell, and the clinically diagnosed patients. This showed that districts with a more active treatment policy had significantly better outcomes for their histologically confirmed non-small cell patients and the clinically diagnosed group than those districts with lower rates of active treatment.
Relative risk (all lung cancer, including clinically diagnosed)
Relative risk of death by active treatment rate of district
DISCUSSION
Survival varied between different histological groups as expected. Small cell cancer has a poorer survival rate than NSCLC with 50% of those treated by surgery in the latter group surviving two years. The low survival of the clinically diagnosed group suggests that a proportion of this group were not histologically diagnosed nor actively treated because of the late presentation of the illness, with about half dying within three months of diagnosis. Histological group had little effect on survival after two years where both clinically and SCLC survival lines converge whereas NSCLC cases remain on a higher survival curve. Survival was significantly better in districts with higher active treatment rates. The reasons for the variation in active treatment rates between districts were not entirely clear. District group histological confirmation rates did not follow the trend of overall active treatment rates. The four active treatment groups had similar trends in district specialist management rates and radiotherapy rates was similar to the active treatment rates, but there was less concordance with surgery and chemotherapy.
In general, high radiotherapy rates were the main contributor to high active treatment rates (see fig 2). This finding may be in keeping with the greatest survival differences between groups of districts being found at six months. It is likely that variation in radiotherapy rates have had more effect on early survival given that average surgical rates were 11% and average radiotherapy rates were 36%. Our data made no distinction between palliative and radical radiotherapy but these results indicate that any radiotherapy may bring modest survival benefits. In addition palliative treatments are likely to improve patients' quality of life.20–22
“The therapeutic nihilism that has characterised the attitude of many health-care providers for lung cancer should be consigned to the past.”
Variation in case mix may have caused some survival differences on a district basis but adjustment by age made little difference to the results. The percentage excluded from the dataset varied by district from 2%–35%, mean 9.85%. When the ATR rates were reworked using the excluded cases along with those cases in the study as a denominator there was no difference in the position of the four groups, with the range being slightly narrowed to 53.5% in group 1 to 39% in group 4. No data were available for ethnicity but during this time period it is likely to have been low given the younger profile of the ethnic minority population in Yorkshire. We were not able to adjust for comorbidity or performance status, which would have given a better adjustment for case mix. In the overall RR tables age was the only factor apart from treatment and specialist management that varied RR by more than a small amount. Difference in histological type showed the effect was strongest in NSCLC. SCLC treatment rates were very high overall and it is therefore not clear that the overall active treatment rates used to classify districts are relevant for SCLC and that this is why results are not significant. It is probable that disease extent, particularly nodal involvement is less accurate in clinically diagnosed patients compared to those with a histological diagnosis. Deprived areas had a higher age standardised incidence of lung cancer as has been noted elsewhere.23 However there was no association between districts with high active treatment rates and districts with less deprivation. Similarly there was little difference in treatment between different socioeconomic groups. There was a slight worsening of survival with deprived social groups, which was not found in South Thames region, whereas it was found in a Dutch population based registry study.24,25
Key points
-
Active treatment of non-small cell lung cancer with surgery, radiotherapy, or chemotherapy was strongly associated with improved survival.
-
There are wide variations in active treatment rates for lung cancer patients within districts across one large region of England.
-
One year survival was significantly better in districts with high rates of active treatment compared with districts with low treatment rates.
The reasons for variations in active treatment rates were not established. Variations in treatment between different clinicians have been noted previously.3 There may have been some therapeutic nihilism on the part of some doctors in this period.26–28 That is, the prognosis of lung cancer is so poor that some doctors may have thought that it was not worth treating many patients actively, or referring them on to a second specialist. There is some evidence that both chest physicians and thoracic surgeons vary in their beliefs about treatment and survival.29 It may also be that where more than one specialist is involved in a patient's treatment a more positive outlook is engendered. This positive effect, if true, is likely to be increased by multidisciplinary working, which is one of the recommendations of the Calman-Hine reforms.30
We have shown that survival in lung cancer in a regional population is related, to a degree, to active treatment rates. There is a probable benefit from having more than one specialist involved in the care of lung cancer patients so that the full array of treatment modalities is considered for each patient. This is consistent with national guidance on lung cancer.12 As a recent review states “The therapeutic nihilism that has characterised the attitude of many health-care providers for lung cancer should be consigned to the past.”26
Policy implications
-
Negative or nihilistic attitudes to the treatment of lung cancer among health care professionals should be countered by positive messages. As more appropriate care is provided, direct treatment costs are likely to rise.
-
The task of determining the most appropriate management of individual patients requires the input of specialists in lung cancer from a range of disciplines. All patients should have their management determined by a multidisciplinary team of lung cancer specialists, regardless of their age or mode of presentation.
-
The “Improving Outcomes” Guidance and the Manual of Cancer Service Standards provide clear frameworks for the delivery of modern multidisciplinary lung cancer services in the UK. Under the NHS Cancer Plan implementation should be a priority.
REFERENCES
Linked Articles
- In this issue