Article Text

Abstract
STUDY OBJECTIVE Attitudes and practices concerning weight control in British adults were examined to test the hypothesis that variation in concern about weight and deliberate weight control might partly explain the socioeconomic status (SES) gradient in obesity. Higher SES groups were hypothesised to show more weight concern and higher levels of dieting.
SETTING Data were collected as part of the monthly Omnibus Survey of the Office of National Statistics in March 1999.
PARTICIPANTS A stratified, probability sample of 2690 households was selected by random sampling of addresses in Britain. One randomly selected person in each household was interviewed at their home.
MAIN RESULTS As predicted, higher SES men and women had higher levels of perceived overweight, monitored their weight more closely, and were more likely to be trying to lose weight. Higher SES groups also reported more restrictive dietary practices and more vigorous physical activity.
CONCLUSIONS The results are consistent with the idea that part of the protection against weight gain in higher SES groups could be a higher frequency of weight monitoring, a lower threshold for defining themselves as overweight, and a greater likelihood of deliberate efforts at weight control.
- socioeconomic status
- weight control
- obesity
Statistics from Altmetric.com
In most Western countries, women of higher socioeconomic status (SES) are thinner than women of lower SES.1-11 In England for example, data from the 1996 Health Survey showed that the prevalence of obesity increased from 14% in women from social class 1 to 25% in social class 5.10 The pattern for men is less clear, but many surveys find lower body mass index (BMI) at the extremes of the SES distribution, whether SES is indexed by education4 7 or occupation.12 However, recent results suggest that the SES-obesity association in men may be becoming more like that in women.7 13
There is considerable interest in the mechanism for this social differential, both because it could lead to a better understanding of the development of obesity and because it may provide insights into how to reduce the level of obesity among lower SES groups. Social mobility, especially among women, is likely to play a part, as thinner women seem to be more economically and educationally successful, and are more likely to make upwardly mobile marriages.14-16Accumulation of a genetic predisposition to obesity in lower SES groups, resulting from downward social mobility, is also likely to contribute to the social differential, although the absence of social class differences in obesity in childhood argues against this being the only factor involved.17 Aspects of lifestyle such as smoking, physical activity and diet are certainly important influences on weight gain, but the associations with social class are not straightforward.18 Smoking is usually more prevalent in lower SES groups, while occupational physical activity is higher in people with manual occupations. Both of these factors would tend to promote a lower BMI in lower SES groups. On the other hand, participation in leisuretime physical activity is associated with higher SES, strikingly so for women. Associations between either total energy intake or dietary fat intake and SES are variable,19-22 but almost all studies find higher levels of fruit and vegetable intake in higher SES groups.12 20 21
Another possible factor contributing to SES differences in weight could be different attitudes to weight gain, and differential utilisation of weight control practices.23 Dieting has been found to be more common in higher SES adolescents24 25 and two studies in the US found higher levels of dieting in higher income adults.27 28 Eating disorder prevalence also shows a degree of social gradient,26 which may reflect the cost side of higher levels of weight concern. SES differences in attitudes to weight have never been investigated in population representative samples, and no studies of this kind have been carried out in the UK. The aim of this study was therefore to examine attitudes and practices concerning weight control in a representative sample of British men and women. Higher SES groups were hypothesised to espouse a lower “ideal weight”, monitor their weight more closely, be more likely to identify themselves as overweight, be more likely to try to lose weight, and use more recommended weight control strategies.
Methods
Data were collected as part of the monthly Omnibus Survey of the Office of National Statistics in March 1999. In the Omnibus surveys, a stratified probability sample of women and men is selected each month by random sampling of addresses on the Postcode Address File of private households in Great Britain. Business and non-inhabited addresses are excluded (usually around 12%) and remaining households are visited by a trained interviewer. One randomly selected member of each household is selected for a computer assisted interview. (For details of the methodology see ONS Omnibus Survey).29 From a target sample of 2690 eligible addresses, 583 respondents refused to be interviewed and 213 were unable to be contacted after three attempts, so 1894 (70%) interviews were achieved.
MEASURES
Socioeconomic status
Occupational social class, based on the Registrar General's classification of the person's current or last occupation was used as the principal index of SES. People who have never worked are not classified in this scheme. Other demographic data recorded are shown in table 1.
Demographic characteristics of the four social class groups
Weight, height and perceived overweight
Weight and height were self reported and BMI calculated. Overweight status was defined as a BMI between 25 and 29.99, and obesity as a BMI over 30. Respondents were also asked to evaluate their weight on a scale from “very underweight”, through “somewhat underweight”, “about right”, and “somewhat overweight”, to “very overweight”.
Weight attitudes
Ideal weight was ascertained by asking respondents “What would you ideally like to weigh?”. Ideal BMI was calculated as the ratio of ideal weight and reported height. Frequency of weighing was used as an index of the level of weight monitoring.
Weight control behaviour
Respondents were asked to say which of the following descriptions applied best to them: “not bothered about my weight”, “watching my weight to avoid putting on weight”, “trying to lose weight”, or “none of the above”.
Health behaviours and restrictive dietary practices
Smoking status was assessed with the single question “Do you smoke cigarettes at all nowadays?”. Vigorous physical activity was also asked with a single question (Do you regularly do vigorous activity for at least 20 minutes, 3 times a week?). Early in the interview, before any mention had been made of weight control, respondents were asked whether they regularly practised any of a list of seven restrictive dietary habits. The dietary habits (“limit the amount of food you eat at meal times”, “limit the amount of desert, cakes and sweets that you eat”, “avoid or limit snacks between meals”, “avoid or limit fat and fatty foods”, “avoid or limit sugar and sugary foods and drinks”, “avoid or limit fried foods” and “choose low fat or diet versions of foods where possible”) had been shown to load on to a single factor in a factor analysis, identified as a “restrictive dietary habits” score.30
ANALYSIS OF RESULTS
Results were analysed using analysis of variance and logistic regression from SPSS (version 7.4.1) for the continuous and categorical variables respectively, to compare anthropometric, attitudinal and behavioural differences between social class groups. As appropriate, age, smoking status and BMI were controlled for in the analyses. Interactions between gender and SES, and age group and SES were examined in the logistic regressions by including the interaction terms in the model.
Results
key points
-
Obesity prevalence is higher in lower SES groups in Britain.
-
The prevalence of feeling overweight and trying to lose weight are lower in lower SES status groups.
-
Part of the protection against weight gain in higher SES groups might be the greater utilisation of deliberate attempts at weight control.
SES AND WEIGHT
Table 1 shows the demographic characteristics of the sample in relation to the SES groupings that are used in the subsequent analyses. Some occupations are not well classified in this system (for example, armed forces), people who have never worked are not classified, and in other cases information was missing, so data from 104 cases were not included in the SES analyses. In analysing the results, data for social classes 1 and 2 are combined, as well as 4 and 5, because of the smaller samples sizes. Few respondents were from ethnic minority groups, and the proportion did not vary by SES, so ethnicity was not included as a factor in the analyses.
Age, self reported weight and height, BMI (kg/m2), and the proportions of the sample who are defined as normal weight (BMI below 25), overweight (BMI 25 to 29.99) and obese (BMI greater than 30) by social class are shown in table 2 separately for men and women. In univariate analyses, there was a significant linear association between SES group and BMI in women (F(1,848) = 6.5, p = 0.01), and a significant linear trend across SES groups for the prevalence of obesity (Mantel-Haenszel χ2 = 12.09, p < 0.001). Among women, the odds of being obese in the lowest SES category compared with the highest were 2.8 (95% C1=1.6, 82). Among men, BMI was lowest in the lowest SES group and there was no significant association between SES and the prevalence of obesity.
Anthropometric characteristics of men and women by social class group
The four social class groups also differed in relation to smoking prevalence and age, and as both of these are associated with weight, they were included as control variables in a multivariate analysis of the risk of obesity. With age and smoking status entered first as control variables, women in the lowest SES category were even more likely to be obese (OR = 3.2; 95% CI = 1.7, 5.9) than those in the highest SES category. No significant association between SES and obesity prevalence emerged for men.
SES AND ATTITUDES TO WEIGHT
Weight related attitudes and behaviours are shown in tables 3 and4. Table 3 shows the proportions of men and women endorsing each option. Table 4 gives the odds ratios and 95% confidence intervals from logistic regressions controlling for age, gender and BMI, for each of the main outcome variables expressed in a binary form, with the highest SES group as the reference group. Where the confidence intervals do not include 1, the odds ratio is significantly different from the reference group. Data for men and women are combined in table4, as this maximises sample size and thereby improves the precision of the effect size estimates. Before combining the gender groups, we tested for interactions between gender and SES. The only significant effect was a marginal effect for perceived overweight (p=0.02) that emerged because men in group 3M had a lower perceived weight than the reference group, whereas women did not. There were no significant interactions with gender among the other variables. We also examined age group by SES interactions, and there were no significant interactions.
Weight related attitudes and behaviour among men and women
Odds ratios (with 95% CI) for weight related attitudes and behaviours in relation to SES (controlling for gender, age and BMI)
As Table 3 shows, our prediction that ideal weights or ideal BMIs would vary systematically across social classes was not supported. In women there was a hint of an effect, with the lowest ideal BMI in the highest SES group, but in men the lowest ideal BMI was in the lowest SES group.
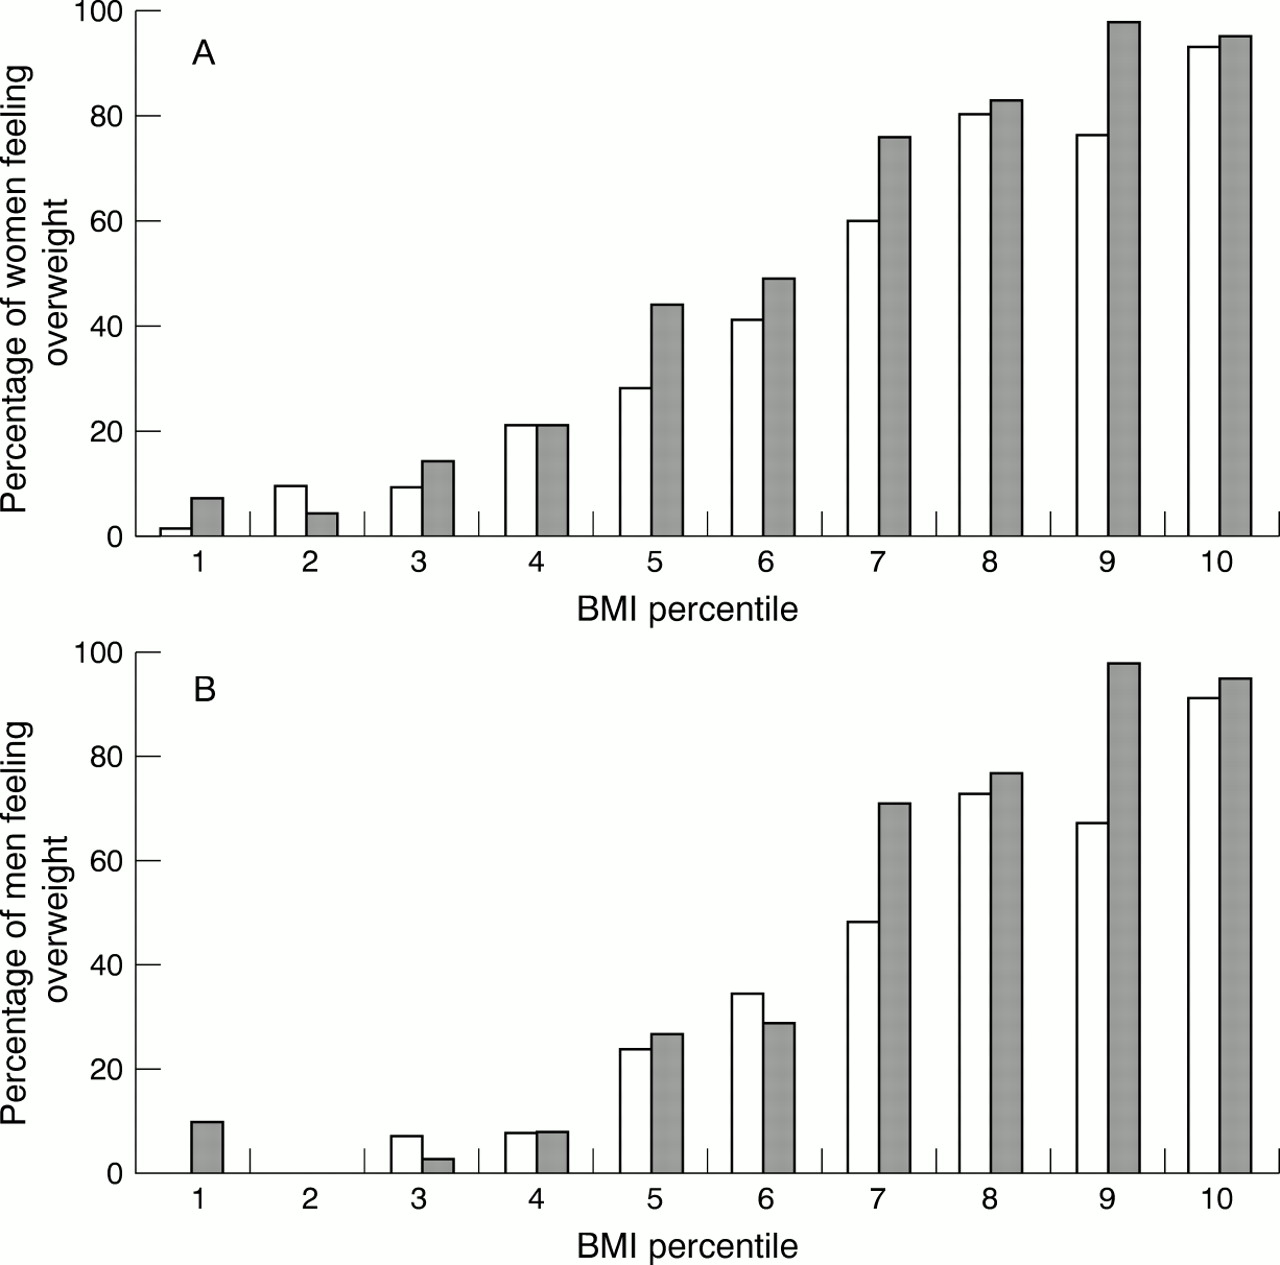
Table 3 shows that half of the women (51%) and slightly fewer men (42%) felt that they were overweight. The proportion describing themselves as overweight was lowest in the lowest SES group among both men and women, but the linear association was significant only for men. The results of a multivariate logistic regression are shown in table 4(column 1), which controlled for gender, age and BMI. The lowest SES groups were significantly less likely to feel overweight than the reference group (the highest SES group), with intermediate odds ratios for the non-manual and skilled manual groups. The SES difference in perceived overweight is illustrated in figure 1A (women) and 1B (men), with respondents being divided into percentiles of BMI.

Percentages of women (A) and men (B) who perceived themselves as overweight or very overweight, in relation to BMI percentile and occupational social class. Darker bars represent data from the non-manual social class groups (1, 2 3NM) and lighter bars the manual groups (3M, 4, 5).
Regular weighing (defined as at least monthly) was slightly less common among men than women and was less common in the lower SES groups (see table 3). The adjusted odds ratios (see table 4, column 2) indicate that the lowest SES group was significantly less likely to be monitoring their weight regularly, with graded odds ratios for the intermediate groups.
SES AND INTENTIONAL WEIGHT CONTROL
For both men and women, there were more who were “trying to lose weight” and fewer who were “not bothered about their weight” among the higher social class groups (see table 3). This difference is all the more striking in view of the lower prevalence of obesity in the higher SES women. Results in table 4 (column 3) show that, after controlling for gender age and BMI, there was a significant graded effect across SES categories in the odds of trying to lose weight. These effects are illustrated in figure 2A and 2B.

Percentages of women (A) and men (B) who reported trying to lose weight, in relation to BMI percentile and occupational social class. Darker bars represent data from the non-manual social class groups (1, 2 3NM) and lighter bars the manual groups (3M, 4, 5).
“Watching your weight” seemed to be a commonly reported habit in the present sample, which did not differ across SES groups in univariate analyses. However, analysing data just from those whose BMI is below 25 (for whom weight watching might be a prudent practice) showed significant social class variation. Some 41% of normal weight men and 51% of women in the highest SES group were watching their weight, compared with 30% of men and 44% of women in the lowest SES group.
More women than men carried out each dietary practice, so the overall “restrictive dietary habits” score was significantly higher in women (3.6; 95%CI 3.5, 3.7) than men (2.8; 95%CI 2.5, 2.9; t = 8.1, p < 0.001). Table 3 shows that restrictive habits were also strongly related to social class, with a significant linear effect for the restrictive habits score among both men (F = 12.7, p < 0.001) and women (F = 56.6, p < 0.001) in the univariate analyses. Multivariate analyses showed that the odds of practising at least three restrictive habits had a graded association with SES (see table 4).
Some 32% of men and 23% of women reported regular vigorous physical activity (see table 3). There was little SES variation among men, but much higher levels of exercise in the highest SES women than the other three groups. In the multivariate analyses, the odds of regular exercise was significantly higher in the highest SES group than the other three groups.
Discussion
This is one of the first studies to use a nationally representative sample to evaluate the association between SES and attitudes and practices in relation to weight control. The results give some support to our prediction that men and women from higher SES groups would be more likely to try to control their weight, with many of the effects being graded across occupational categories. Higher SES men and women were more likely to perceive themselves overweight and monitored their weight more frequently despite their lower BMI and lower prevalence of obesity. They were also more likely to be trying to lose weight and reported more restrictive dietary habits and more regular physical activity.
We had hypothesised that higher SES men and women would espouse a lower ideal weight, which we anticipated might “drive” the attitudinal and behavioural differences, but there was no evidence for this. Ideals for weight or BMI did not vary systematically across the SES groups for either men or women, so this could not explain the other differences. Given that higher SES groups were more likely to perceive themselves as overweight, this perception would not seem to derive directly from their view of ideal weight. One possible alternative explanation is that weight norms vary by SES because they come from the weights of people in the immediate social environment—family members, friends and colleagues—who are likely to come from the same SES group, and therefore likely to have a similar weight distribution.
The finding that higher SES men and women are more likely to monitor their weight, to feel overweight and to try to lose weight is supportive of our prediction that attitudes and behaviour in relation to weight control could play a part in generation of the SES differences in obesity. These results are consistent with other studies that find higher levels of dieting in adults with higher levels of education or income.27 28 31 They are also consistent with the idea that eating disorders,26 or at least the individual clinical features of eating disorders,32 which are often seen as the consequence of excessive dieting, seem to show an SES gradient. Of course, we have to consider the possibility that there is a SES bias in reporting of weight control attitudes behaviours. In the present dataset this cannot be ruled out, but it is worth noting that the gradient for physical activity in women is consistent with other data,3 while the findings for healthy dietary habits accord with other observations of healthier food choices in higher SES adults in the UK.12 31 34
Assuming that the observed SES differences represent real variation and not just biased reporting, then they raise the question of how these differences emerge. What could make higher SES people more weight concerned and more likely to take active steps in weight control? The work on social mobility in relation to weight, especially for women, attests to the high social value placed on weight, and suggests that higher SES groups are more rejecting of overweight.35 The sociological work of Bordieu describes social class differences in lifestyle that include the extent to which the control of body shape is seen as a viable and worthwhile life project, with middle class women being “ . . .disposed to sacrifice much time and effort to achieve the sense of meeting the social norms for self-presentation”.36
There is one paradox in the results, namely that observed SES differences in weight control were almost as striking for men as women, yet the social patterning of weight is negative only for women. One explanation is that in men with lower SES, other factors protect against weight gain. Occupational physical activity is a strong contender at present, as it is relatively higher in male manual than female manual occupations. However, this protection is likely to diminish as more work tasks become automated, and the SES distribution of obesity for men is likely to shift to being more like that in women.
An important methodological issue emerges from using cross sectional data to examine causal hypotheses—in this case that either deliberate weight control, or variation in lifestyle, are the causal factors in SES differences in weight. Some of the published analyses of the causes of social variation in weight have tried to examine the mediation hypothesis by controlling statistically for lifestyle differences, and seeing if this reduces the magnitude of the SES difference in weight.27 28 Not surprisingly, this has failed to yield positive results because weight control efforts emerge as a consequence of being (or feeling) overweight, and hence in cross sectional studies are bound to be positively associated with weight. As such there is little chance that any mediating effect would be demonstrable. Longitudinal studies in which weight change is evaluated in relation to weight control practices, are needed to find out whether active weight control efforts really do reduce the weight gain that might otherwise be expected.
The findings of this study are limited by it being based on self reported information both on dieting behaviour and weight. Self reported weights and heights tend to result in under-estimations of weight, especially among women, and over-estimations of height, especially in men, which in both cases would tend to underestimate BMI. Comparisons with data from the Health Survey for England,10 which uses measured weights and heights, suggests that this bias was shown in the present data. The average BMI in the present study was 24.7 in women and 25.3 in men, compared with 26.0 for women and 26.3 for men in the HSE. However, as the focus of the present study was SES differences, and the patterning of weight by SES was comparable in this dataset and the HSE, the shortcomings of reported weights and heights are not likely to materially affect the conclusions. Generalisation of the results is also limited by the fact that the response rate for the survey was around 70%, which is typical for the Omnibus surveys in the UK. Comparisons with census data suggest that there is slight under-representation of young people (between the ages of 16–25 years) and those of lower SES, which reflects the general trend within survey data that these groups are less available or willing to participate in government surveys.29 It is not immediately obvious how this would bias the social class comparisons, though it may over-estimate the overall level of weight concern in the population, if some of the less weight concerned sectors are under-represented.
The study has the advantage of using interviews rather than a questionnaire, so it is probable that there was a more accurate ascertainment of the answers. All respondents were asked about the behaviours that might be relevant to weight control, so that it is possible to look at variation in weight control behaviours in relation to SES in the full sample. The sample was also large and fairly representative of the UK population, so within the limits of the method, it would seem reasonable to conclude that SES differences in weight attitudes and practices may play a part in SES differences in weight. The results certainly suggest that the issue deserves further study to establish the physiological significance of the observed behavioural differences, and to try to understand how the SES differences in attitudes to weight emerge in the first place.
References
Footnotes
-
Funding: this work was supported partly by a grant from the Economic and Social Research Council as part of the Health Variations Programme.
-
Conflicts of interest: none.