Article Text

Abstract
STUDY OBJECTIVE Simple measures of inequalities in health are proposed to facilitate the work of health policy makers and to build on the understanding of health differences between populations. In addition, it is aimed to make these measures applicable for comparisons of small populations and subgroups.
METHODS Inequalities in health or health deficiencies were quantified as the difference between the life expectancy of the subgroup of interest and that of the national population. Health deficiencies were divided into disease specific components by partial application of cause eliminated life table methods. To manage small numbers and to depict time trends, locally weighted regression smoothing was applied. Confidence intervals were constructed through Monte Carlo simulations.
APPLICATIONS AND COMPARISONS The proposed approaches were applied to the health situation in Cape Breton County, Nova Scotia, Canada, and disclosed the significance of different diseases and distinct patterns between communities. The proposed measures were also compared with the traditionally used standardised mortality rates and ratios. Here, the proposed measures appeared beneficial in that they are easier to comprehend and that they provide time trends and more robust estimates.
CONCLUSIONS The above advantages make the proposed approaches beneficial to health policy makers and epidemiologists. The approaches may also be incorporated in economic evaluations as well as in more sophisticated public health models.
- epidemiological methods
- health status indicators
- mortality
- chronic diseases
- cancer
Statistics from Altmetric.com
Investigations of inequalities in health generally focus on health deficiencies as they may occur in all kinds of geographical, ethnic and socioeconomically determined subgroups.1 The identification of these subgroups is crucial to health policy makers in their planning of prevention and intervention activities. The identification of these subgroups is also important to epidemiologists to build on the understanding of health differences between populations. In this regard, several epidemiologists have recently called for restoration of this population perspective.2-4
In epidemiological comparisons of populations and subgroups, health is usually expressed in terms of incidence and mortality rates, most commonly, gender and age standardised incidence and mortality rates.5 6 These rates, however, are not easy to comprehend,7-10 and depend on the choice of the standard population.5 6 In addition, rates are generally unsuitable as an impact measure as they give little weight to the age at which morbidity or death occurs.7 8 In contrast, mortality at younger ages is fully reflected in life table derivatives such as life expectancy and cause eliminated life expectancy.11 12 Life expectancy is an easy to interpret summary measure of health that characterises an “imaginary average individual” who carries all the living conditions of the study population in a defined calendar year. The difference between life expectancy in a particular subgroup and the concurrent national life expectancy is a meaningful quantification of the possible health deficiencies of that subgroup.13 Alternatively, the difference between life expectancy and life expectancy after elimination of specific causes of death is an insightful quantification of the relative importance of these causes of death.11Integrating the two latter measures, one can also quantify the relative importance of specific causes of death for health deficiencies of particular subgroups.13
Investigations of inequalities in health will often involve small subgroups. Here, comparisons are hampered by large variation between years. Researchers generally approach this difficulty by compiling observations of several calendar years, although this changes the interpretation and limits the ability to disclose time trends. Alternatively, one may want to fit a regression line through the annual observations. However, the justification of the underlying regression assumptions is difficult. For example, when evaluating five decades of observations, it is difficult to justify the importance of health observations in the 1950s for the health estimates in the 1990s. In contrast, in locally weighted regression smoothing, the fit of the line depends only on observations in a particular year and some specified, under-weighted, neighbouring years.14 As such, one manages annual variation and is able to describe time trends without the limitations of the other approaches.
To facilitate the work of health policy makers and to build on the understanding of health differences between populations, we here propose some alternative approaches to measure inequalities in health that are also suitable for comparisons of relatively small populations and subgroups. Time trends add to the interpretation of health comparisons and are therefore incorporated. To illustrate the proposed approaches, we apply them to the health situation in Cape Breton County, Nova Scotia, Canada, on which we reported earlier.13 15 And finally, we validate the proposed approaches against commonly used measures.
Methods
We quantified inequalities in health and health deficiencies as the difference between the life expectancy at birth of the subgroup under study and that of the national population in the concurrent calendar year. In this regard, we used standard period life table methods.11 We divided the difference in life expectancy into disease specific components by applying cause eliminated life table methods12 to the difference in disease specific mortality between the group of interest and the national population. In other words, we here eliminated the excess cause specific mortality of the group of interest relative to that of the national population, whereas applications commonly eliminate a cause of death entirely.12
We calculated life expectancy and health deficiencies for a series of calendar years. To depict the time trend, we smoothed these series using locally weighted regression smoothing.14 For the construction of confidence intervals around the smoothed curves, we conducted Monte Carlo simulations.16 17 A detailed description of this procedure is included in the.
We applied the above approaches to the geographies of Cape Breton County. We obtained annual disease specific mortality counts by gender, age, and geographical location from Statistics Canada for the years 1950 to 1995. During these years the International Classification of Diseases (ICD) has been revised four times. Table 1 presents the ICD codes of diseases included in the present contribution. We also obtained census data on population size by gender, age, and geographical location from Statistics Canada for the years that the census was held—once every five years. We estimated intercensal population sizes using cubic splines,5 as described and applied elsewhere.13
The international classification of diseases coding, 1950–1995
We validated the proposed approaches against two commonly used measures. Firstly, we made comparisons with gender stratified and age standardised mortality rates, which were calculated following the direct method and using the Canadian population in census year 1991 as the standard.6 Secondly, we made comparisons with age standardised mortality ratios, which were calculated using the indirect method and the concurrent Canadian population as the standard.6
Applications and comparisons
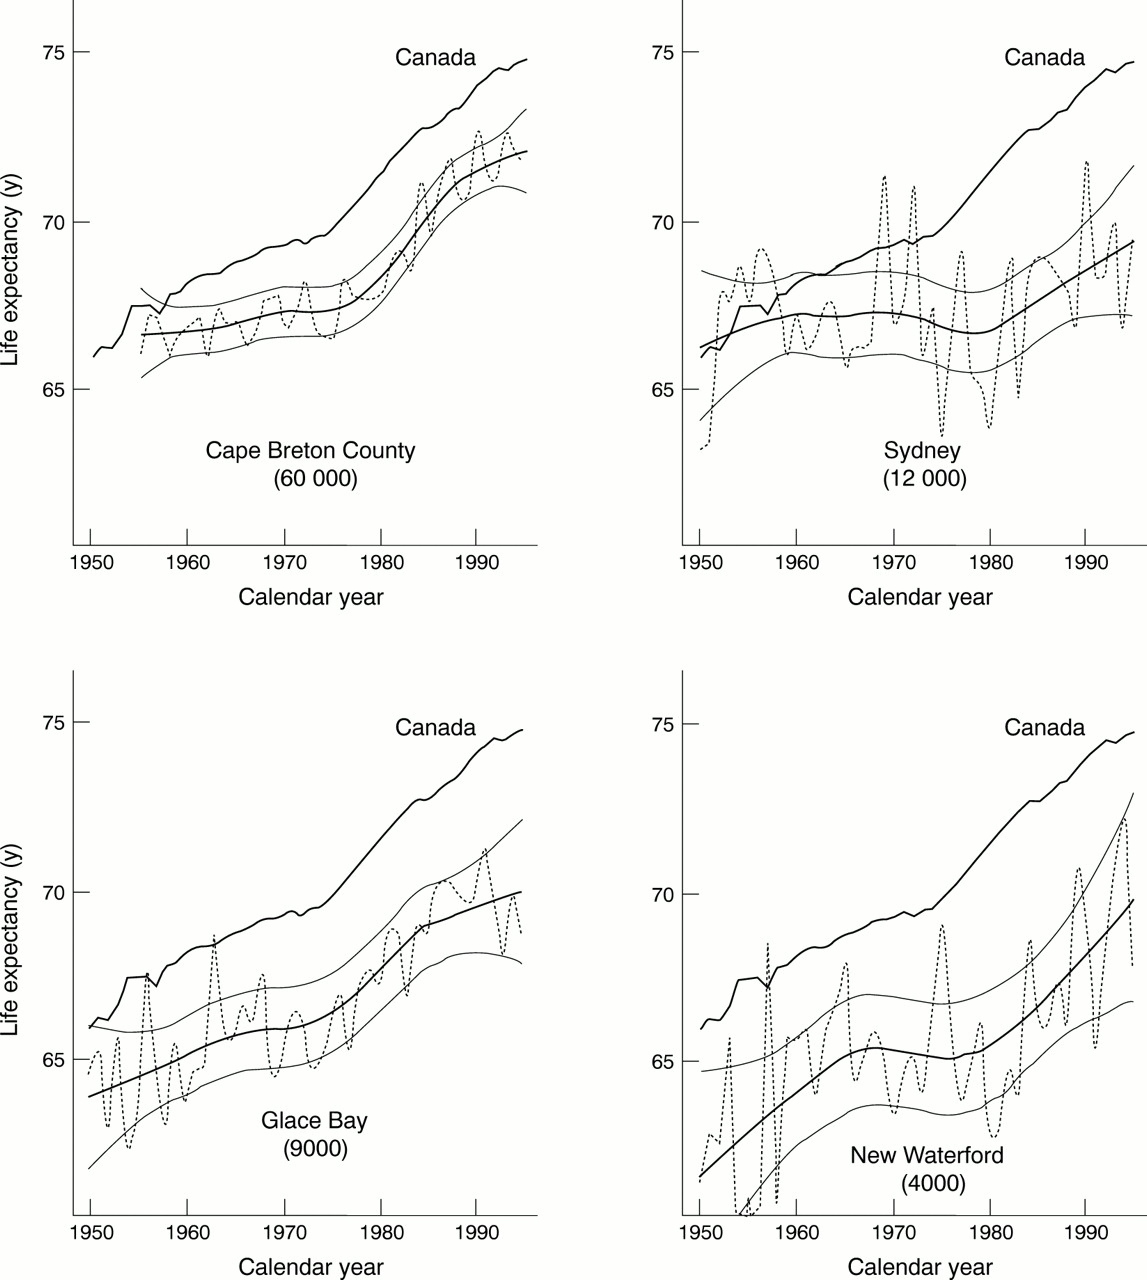
Figure 1 presents annual estimates and smoothed curves with 95% confidence limits of life expectancy for men in Cape Breton County and its municipalities of Sydney, Glace Bay, and New Waterford. Yearly variation increases with smaller population size, but the smoothed curves and confidence limits allow meaningful judgements even if the number of residents is as small as 4000. As a reference, we included the life expectancy of Canadian men of whom we only displayed annual estimates as the yearly variation is small and confidence intervals narrow. Health deficiencies of the municipalities of Cape Breton County, being the differences between local life expectancies and that of Canadians, increase to over five years in most recent years (fig 1). In this respect, one may also note the distinct trend of Sydney: until the 1960s it was an affluent steel producing community, but has since been troubled by economic recessions. This is in contrast with the trends of both coal mining communities, Glace Bay and New Waterford.
key points
-
Inequalities in health are quantified in terms of the anticipated increase in life expectancy if prevention and interventions are successful in reducing local mortality to that of the concurrent national level.
-
Judgements of the importance of inequalities in health are benefited by the display of time trends with confidence bounds .
-
The proposed measures are suitable for small area comparisons.
-
Applications of the proposed measures are beneficial to health policy makers and the evaluation of screening programmes.

Life expectancy at birth of men in Cape Breton County, Nova Scotia, Canada, 1950–1995. Bold lines indicate smoothed estimates of local life expectancy and thin lines the 95% confidence limits. The dotted lines represents annual estimates of local life expectancy. Annual estimates of life expectancy of Canadian men are indicated as a reference in each of the plots. Numbers in parentheses refer to the approximated local population size in the 1990s.
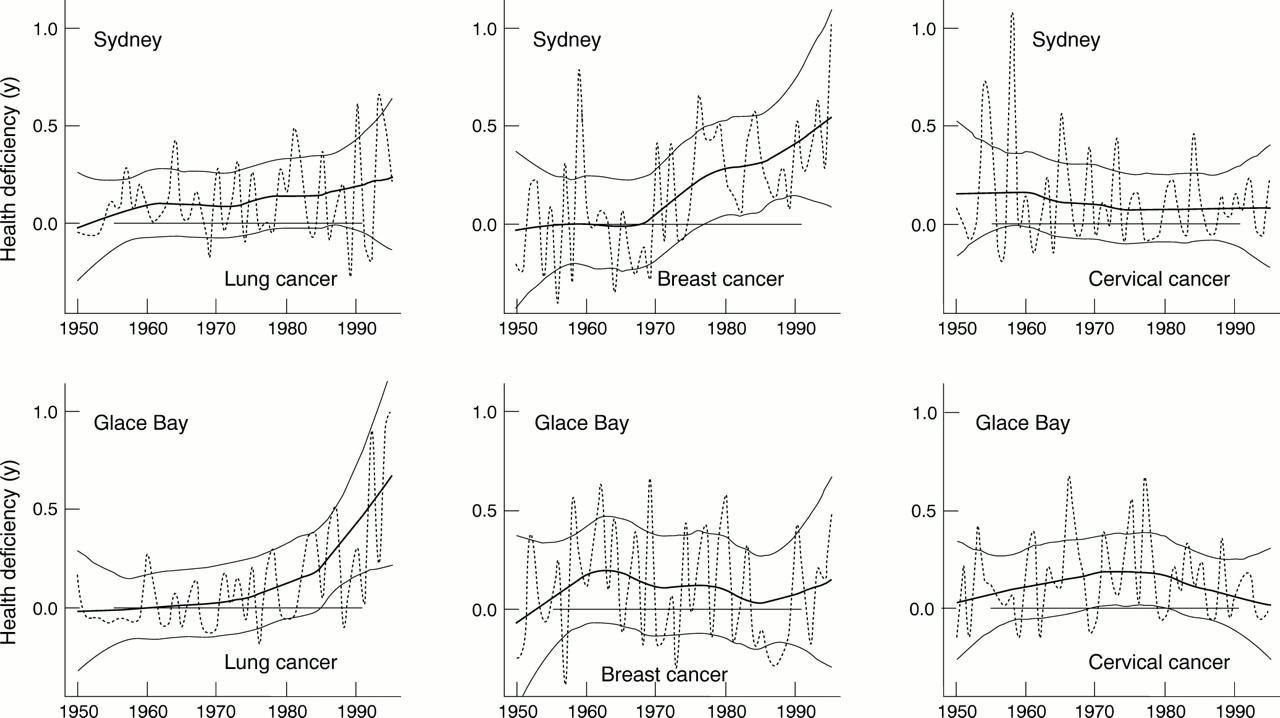
The health deficiencies of Sydney and Glace Bay are grouped into cardiovascular disease, cancer, and infant mortality (fig 2). Both for Sydney and Glace Bay, the health deficiencies resulting from cardiovascular diseases stabilise after an initial increase at a level of approximately two years. Thus, life expectancy of all men living in these municipalities will, on average, increase with approximately two years, if prevention and interventions are successful in reducing mortality from cardiovascular disease to that of the national level. Health deficiencies resulting from cancer and infant mortality follow distinct patterns for the two municipalities. Infant mortality has a large impact on life expectancy but its contribution to health deficiencies does not exceed that of chronic diseases (fig 2). Although the number of residents is relatively small, the proposed approaches allow further subgrouping as demonstrated for site specific cancers among women in Sydney and Glace Bay (fig 3). Health deficiencies resulting from breast cancer are of increasing importance to Sydney women. This observation is in agreement with the higher breast cancer incidence18 as well as lower screening participation rates.19 The increase in lung cancer coincides with an increase in mortality from respiratory conditions (data not shown) and one may want to speculate on an association with environmental and occupational exposures within this coal mining community, in addition to the low socioeconomic status and high smoking rates.20 21
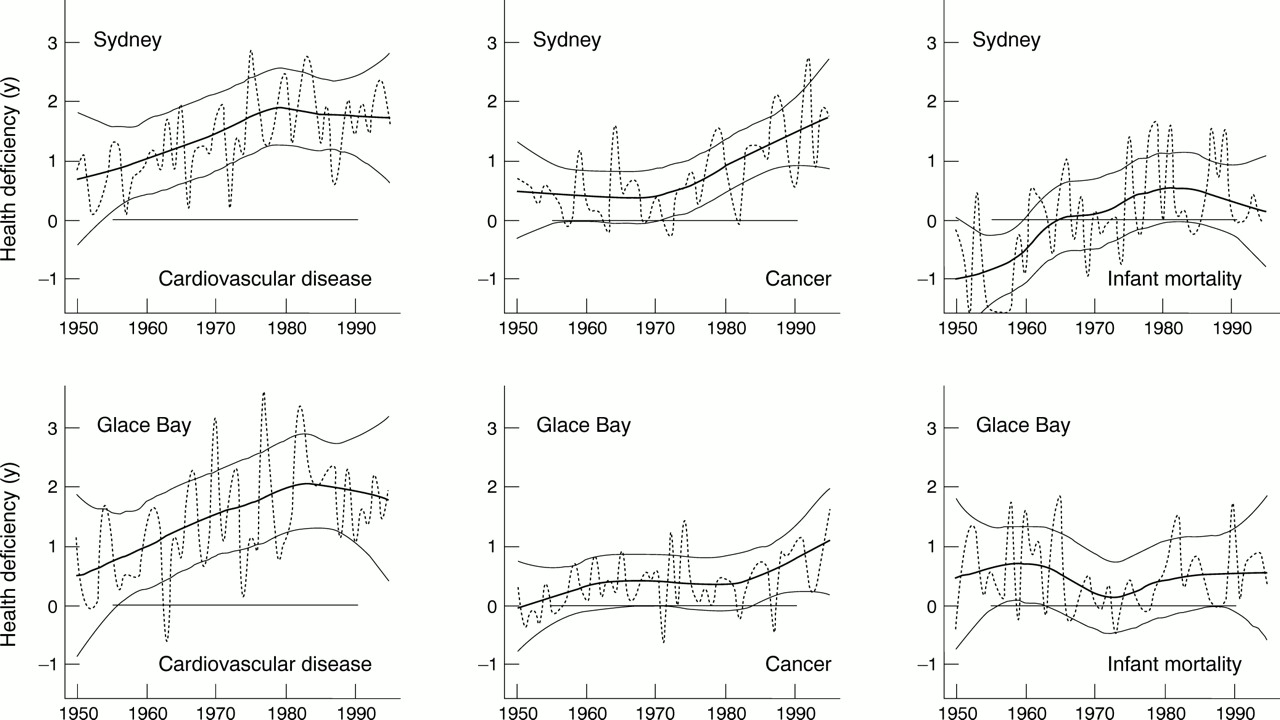
Health deficiencies resulting from cardiovascular disease, cancer and infant mortality among men in Sydney and Glace Bay, Nova Scotia, Canada, 1950–1995. Bold lines indicate smoothed estimates of health deficiencies and thin lines the 95% confidence limits. The dotted lines represent annual estimates of health deficiencies. Negative values indicate that mortality from these conditions is less in the population under study than nationally.

Health deficiencies resulting from lung, breast and cervical cancer mortality among women in Sydney and Glace Bay, Nova Scotia, Canada, 1950–1995. Bold lines indicate smoothed estimates of health deficiencies and thin lines the 95% confidence limits. The dotted lines represent annual estimates of health deficiencies.
In figure 4 we compare the proposed measures with the traditionally used standardised mortality rates and ratios. Whereas the three measures depict similar patterns for breast cancer mortality, they differ with respect to the ease of comprehension. The interpretation of the proposed measures of health deficiencies is most convenient: because of excess breast cancer mortality, Sydney women in 1995 have an estimated six month reduction in life expectancy. The interpretation of the rate is as follows: between 1990 and 1995, the annual breast cancer mortality rate in Sydney is approximately 70 per 100 000 female residents considering that their age distribution is the same as that of Canadian women in 1991. For the ratio, the interpretation is as follows: the breast cancer mortality rate of Sydney women between 1990 and 1995 is approximately twice that of all Canadian women in this period considering their age distribution is adjusted to that of women in Sydney between 1990 and 1995. For cervical cancer mortality the three measures depict rather different patterns. Unstable ratios result from low rates in the reference group (fig 4, centre panel). The 17 deaths from cervical cancer in Sydney between 1980 and 1989 gave rise to a standardised mortality ratio of almost 3, whereas its impact, in terms of health deficiencies, is marginal.

Health deficiencies, standardised mortality rates and ratios of breast and cervical cancer among women in Sydney, Nova Scotia, Canada, 1950–1995. Bold lines indicate smoothed estimates of health deficiencies and thin lines the 95% confidence limits. The dotted lines represent annual estimates of health deficiencies. The standardised mortality rates and ratios are calculated decade wise and depicted at the decade midpoints. The vertical lines in the right panels indicate 95% confidence limits of the decade estimates.
Discussion
To facilitate the work of health policy makers and to build on the understanding of health differences between populations, we have proposed measures of inequalities in health that are easy to comprehend. As they characterise an “average individual” in the population under study, one can conveniently express and compare health in terms of months or years of life expectancy. In contrast, traditionally used rates and ratios characterise the “study population at large” and require standardisation to allow comparisons. The proposed measures estimate the expected increase in life expectancy if prevention and interventions are successful in reducing mortality to the concurrent national level, which is a practical public health objective. The a priori knowledge of this increase in life expectancy provides the best guidance to health policy makers in priority setting and planning of prevention and interventions as part of their efforts to diminish inequalities in health. Furthermore, the proposed approaches are suitable for health comparison of small populations, and the incorporated time trends with confidence bounds are beneficial to the judgements of the significance of the health deficiencies.
Inequalities in health have many dimensions and can be quantified in various ways. Risk factor prevalence and disease incidence are accurate in providing insight in the nature of health inequalities, but such information is not as ready available as mortality statistics. Using the latter data resources, the most commonly applied analytical methods are standardised mortality rates and ratios of which limitations have been addressed by several investigators.6-10 As a result, varying improved methods have been developed to quantify specific phenomena such as premature death, societal or economic costs, functional loss, and standardised lifetime risk.7-9 22Here, we proposed a method that is designed to quantify inequalities in health and that has overcome the limitations of standardised mortality rates and ratios. The proposed approach is partially based on cause eliminated life table methods.12 These methods are criticised in that they ignore interdependency of different causes of death. In this regard, Mackenbach et al 23 recently reported that the impact of cardiovascular and respiratory disease on gains in life expectancy is overestimated as compared with neoplasms, when eliminating these causes of death entirely. As for the proposed approaches, causes of death are only partially eliminated, the above bias will apply to a lesser extent. Nevertheless, one should be aware of potential bias when judging on the relative importance of health deficiencies resulting from different diseases.
We have presented applications using 46 years of observations, but the proposed approaches also performed well in data series of 15 to 20 years (data not shown). The applications disclosed the significance of different diseases and distinct patterns between communities. Such applications are beneficial to the work of health policy makers. Local health policy makers may be assisted by depicting the complete spectrum of relevant diseases in their municipality or county. Programme evaluations, such as of breast cancer screening programmes, may be facilitated by depicting health deficiencies resulting from breast cancer throughout the entire region, province or country. All the above applications characterise geographical inequalities in health, where the proposed approaches are as suitable for other health comparisons such as of ethnic and socioecomonic subgroups. The proposed measures express health deficiencies conveniently in terms of months or years of life expectancy. These measures, therefore, will be suitable in effectiveness and economic evaluations.24 25 In addition, they should also be considered in sophisticated public health modelling such as in scenario-based forecasting,4 and in the development of “instruments for evidence based policy.”26
Acknowledgments
We thank Dr Murray G. Brown, Patricia Griffith, Dr Hajnal Molnav-Szakacs and Michael Pennock for their helpful assistance.
Appendix
For the construction of confidence intervals around the smoothed series of life expectancies or health deficiencies, we considered two sources of standard error. These include sampling error in the life expectancies and health deficiencies, and error resulting from the smoothing procedure. To integrate these two sources, we conducted Monte Carlo simulations,16 17 where the iterative process (n=1000) consisted of the following four steps: (1) The random assignment of mortality to each age group in each calendar year considering the observed mortality and population size. (2) The calculation of life expectancy or health deficiencies for each calendar year using the figures generated in the first step. (3) Locally weighted regression smoothing of the series of annual measures resulting from the second step. (4) Random draws of each of the annual estimates resulting from the third step. As such, for each measure in each calendar year, this simulation generates 1000 estimates of which the 50th percentile approximates the mean and the 2.5th and 97.5th percentiles represent the 95% confidence limits.
References
Footnotes
-
Funding: financial support for this study is provided to Dr Paul J Veugelers through a Dalhousie Faculty of Medicine Research Committee Intramural Grant and by the Canadian Foundation for Innovation, with matching funding from the Dalhousie Medical Research Foundation, the Dalhousie University Medical Research Services, and the Nova Scotia Government. Dr Judith Read Guernsey receives funding by Electric Power Research Institute, Inc, Palo Alto, California, USA (contract no WO5305–01).
-
Conflicts of interest: none.