Article Text

Abstract
Background Socioeconomic differences in health are a major challenge for public health. However, realistic estimates to what extent they are modifiable are scarce. This problem can be met through the systematic application of the population attributable fraction (PAF) to socioeconomic health inequalities.
Methods The authors used cause-specific mortality data by educational level from Belgium, Norway and Czech Republic and data on the prevalence of smoking, alcohol, lack of physical activity and high body mass index from national health surveys. Information on the impact of these risk factors on mortality comes from the epidemiological literature. The authors calculated PAFs to quantify the impact on socioeconomic health inequalities of a social redistribution of risk factors. The authors developed an Excel tool covering a wide range of possible scenarios and the authors compare the results of the PAF approach with a conventional regression.
Results In a scenario where the whole population gets the risk factor prevalence currently seen among the highly educated inequalities in mortality can be reduced substantially. According to the illustrative results, the reduction of inequality for all risk factors combined varies between 26% among Czech men and 94% among Norwegian men. Smoking has the highest impact for both genders, and physical activity has more impact among women.
Conclusions After discussing the underlying assumptions of the PAF, the authors concluded that the approach is promising for estimating the extent to which health inequalities can be potentially reduced by interventions on specific risk factors. This reduction is likely to differ substantially between countries, risk factors and genders.
- Health behaviour
- health impact assessment
- international health
- mortality
- social inequality
- demography
- epidemiology
- social inequalities
- social epidemiology
- public health
- eastern Europe
- geography
- inequalities
- ageing
- methodology
- elderly
- health expectancy
Statistics from Altmetric.com
- Health behaviour
- health impact assessment
- international health
- mortality
- social inequality
- demography
- epidemiology
- social inequalities
- social epidemiology
- public health
- eastern Europe
- geography
- inequalities
- ageing
- methodology
- elderly
- health expectancy
Introduction
Inequalities in health between socioeconomic groups are increasingly recognised as one of the main challenges for health policy.1 Studies from Europe have shown that health inequalities are substantial but that there are important variations between countries in the magnitude of health inequalities,2–4 suggesting great scope for reducing health inequalities. However, it is currently unknown to what extent they are actually modifiable, which is a serious barrier for effective policy making, because it hinders priority setting and the formulation of realistic quantitative targets.
We know that inequalities in risk factors between socioeconomic groups are larger in some countries than in others and that countries with smaller inequalities in risk factors have smaller inequalities in mortality.4 Until recently, however, methods to quantify the impact of changing risk factor distributions have not been applied to proximate risk factors and social inequalities in health. We do that by linking risk factors to health outcomes through the population attributable fraction (PAF). The PAF, first introduced for a single dichotomous risk factor,5 has since been used to quantify the contribution of risk factors to disease burden, also for multiple and continuous risk factors, and for comparative risk assessment as input for public health interventions.6–9
We demonstrate how the PAF can be applied to socioeconomic inequalities in mortality on the basis of a counterfactual scenario using example data from three European countries. The scenario implies that the prevalence of four risk factors, single and combined, is reduced to the level currently seen among the highest educated. This scenario is first analysed for its impact on mortality and consequently in terms of its impact on educational differences in mortality in order to show the usefulness of the proposed method and the potential for reduction of health inequalities.
Data
To illustrate our approach, we use data that have previously been collected for the Eurothine project.4 It allows differentiation by gender, five age groups (30–44, 45–59, 60–69, 70–79 and 80+ years), three educational groups (ISCED 0–2, ISCED 3–4 and ISCED 5–6), all-cause mortality and three causes of death (ischaemic heart disease, cerebrovascular disease and lung cancer) for Norway, Belgium and the Czech Republic. These countries have different welfare arrangements10 and differ by educational structure as well as in the prevalence of risk behaviours (see web-only files).
The data needed for calculating PAF are (1) prevalence data and (2) mortality rate ratios (RRs) for all categories of the risk factors: information on risk factor prevalence is based on national health surveys from Belgium (1997), Norway (2002) and the Czech Republic (2002), and mortality data were obtained from the national statistical offices of Belgium (1991–1995), Norway (1990–2000) and Czech Republic (1999–2003). All data sets are harmonised for international comparability, that is, categories of risk factors are made comparable as far as possible.11 The RRs are gender and age specific and come from systematic reviews with statistical meta-analysis (see web-only files).12 ,13 The relative risks are assumed to be the same for all countries.
Methods
We adapt the PAF in order to estimate the impact of counterfactual distributions of risk factors on the magnitude of health inequalities. The PAF is an estimate of the proportion of a population health outcome that would be reduced if exposure to a risk factor were changed (equation 1 in box 1).14–17 We calculate the PAF for four proximate risk factors separately and combined. This impact is analysed separately for each educational group and then combined in order to calculate the scenario's impact on mortality in the total population and on mortality differences between educational groups.
Population Attributable Fraction
-
n = number of exposure categories
-
Pi = proportion of population currently in the ith exposure category
-
-
RRi = RR of disease-specific mortality for the ith exposure category
Many diseases are caused by multiple risk factors. In order to estimate the combined impact of more than one risk factor on the occurrence of mortality, equation 2 is used to calculate an attributable fraction that takes into account multicausality.17
PAFi = the proportion of the disease preventable by reducing exposure to the ith risk factor.
The product of all (1− PAFi ) represents the fraction of disease not preventable through interventions on any of the n risk factors.
In order to obtain accurate estimates of the impact of our scenario on inequalities in mortality, we stratified the analysis by gender, age and cause of death. For example, there are substantial differences between men and women in how educational status relates to health18 and in the determinants of educational inequalities in health.19 Also, the impact of risk factors on mortality is different at different ages and according to different causes of death.20 ,21 The age-specific results (not shown) are used to calculate PAFs for all ages by summing up the saved deaths over age categories.
Results
The impact of the scenarios will be addressed in two ways: first by calculating the PAF showing the reduction in mortality achieved by a social redistribution of risk factors and second, the impact of such redistribution on inequality in mortality.
The potential avoidance of deaths in the total population
Table 1 presents estimates of the expected decrease of cause-specific and all-cause mortality, given that the exposure to physical activity, alcohol, smoking and body mass index (BMI) would change to the level among the higher educated.
The PAF (in per cent) of cause-specific and all-cause mortality in the total population given the scenario that the prevalence of physical activity, alcohol consumption, smoking and BMI (separately and combined) would be found at the level currently seen in the high educational group
A change in the exposure of all risk factors would cause the largest reduction of all-cause mortality among Norwegian men (16.9%) for which smoking seems to contribute the most (10.6%). However, looking at Belgian women, the overall PAF of all-cause mortality is only 7.1 in which smoking and alcohol do not contribute much (1.4% and 0.2%, respectively). In order to understand these results, it is noteworthy that the magnitude of the PAF depends on two components: first, the difference in prevalence between educational groups and second, the impact of a risk factor on mortality. Smoking seems to be most important for men, while for women, physical inactivity is most important (except from Czech Republic).
The potential reduction of inequalities in mortality between educational groups
Table 2 shows how our scenario reduces inequality in all-cause mortality, and table 3 shows the same for three single causes of death. In both tables, we first present original mortality RRs for educational groups, with the highest educational group as the reference group, and second, scenario RRs with percentage reduction of inequality. The scenario RRs result from reducing the original levels of mortality in each educational group by the PAF values presented in table 1.
All-cause mortality (RR) by educational group for men and women in three European countries, and scenario RRs (with percentage reduction of inequality as compared to the original RRs) based on the assumption that the prevalence of physical activity, alcohol consumption, smoking and BMI (both separately and combined) would be distributed as in the highest educational group
Cause-specific mortality (RR) by educational group for men and women in three European countries and scenario RRs (with percentage reduction of inequality as compared with the original RRs) based on the assumption that the prevalence of physical activity, alcohol consumption, smoking and BMI (both separately and combined) would be distributed as in the highest educational group
The reduction of inequality is expressed in percentages, that is, how much the excess mortality (RR-1) is reduced. Increasing the level of physical activity has a comparatively large effect in Norway. The resulting reduction of inequality is 17% and 20% for Norwegian men and women, respectively. A similar change in the pattern of alcohol consumption would hardly alter the RRs. However, a change in the smoking pattern seems to be associated with a large decrease of inequality in some countries and mainly with respect to Norwegian men where a 44% reduction of inequality is observed. This substantial reduction occurs because the social smoking gradient is particularly high among Norwegian men and even more so in the higher ages where most deaths occur. With regard to the scenario RRs of BMI, it seems that inequalities in health would be reduced only modestly by a redistribution of BMI but still slightly more than for alcohol. The combined impact of all four risk factors would reduce inequalities in health in all countries, particularly for men but still substantial for women. Reductions of inequality between lowest and highest educated groups are between 26% (Czech men) and an almost total elimination of inequalities among Norwegian men (94%). With regard to the cause-specific results in table 3, we see that the scenario on physical activity has an almost equal impact on inequality in ischaemic heart disease and cerebrovascular disease, alcohol on ischaemic heart disease, smoking on lung cancer and BMI on ischaemic heart disease.
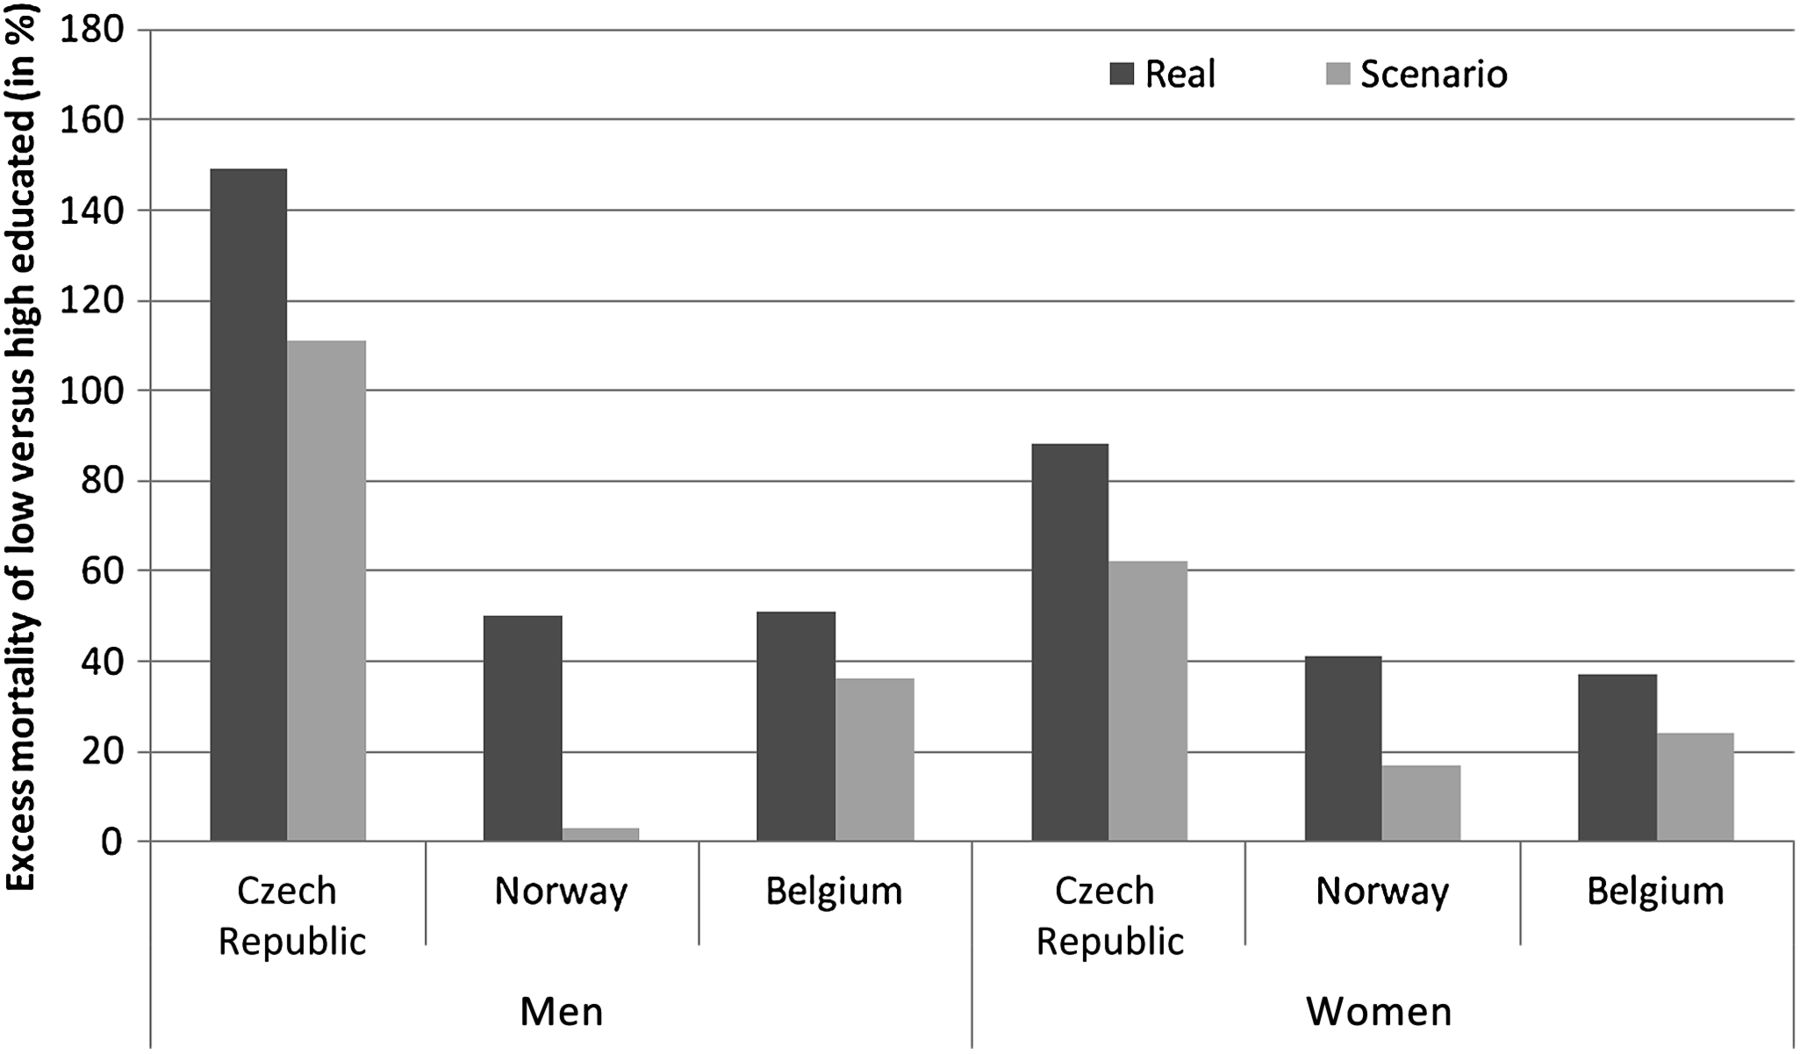
Figure 1 provides a graphical presentation of the impact of our scenario on social inequality in all-cause mortality. It presents the excess mortality of the low compared with the high educated in per cent (y-axis), and this for the original RRs (real) and the adjusted RRs (scenario). The graphical presentation confirms that the results described above suggesting that inequalities in all-cause mortality can potentially be reduced substantially in all countries for both men and women by a redistribution of the four risk factors. In the case of Norwegian men, this scenario may be sufficient to almost eliminate social inequality in mortality.

The potential reduction of health inequalities given the scenario that all educational groups have the same behaviour as the higher educated in terms of physical activity, alcohol consumption, smoking and body mass index.
Discussion
We have shown how the PAF approach can be used to calculate the impact of changes in the social distribution of proximate risk factors, first on mortality and second on the magnitude of socioeconomic inequalities in mortality in different countries. The fraction of all-cause mortality preventable by a redistribution of physical activity, alcohol consumption, smoking and BMI to the level observed among the higher education is typically above 10% for men and below 10% for women. There are large variations between countries, gender and risk factors, Norwegian men being the group with the highest fraction of avoidable deaths, mainly due to smoking. Inequalities in all-cause mortality can potentially be reduced for both men and women by a redistribution of risk factors by education but in most cases not sufficiently to totally eliminate them. Although the highest inequality in mortality exists in the Czech Republic, we see the highest potential reduction in Norway due to a higher impact of physical activity and smoking.
Although not exactly comparable, other studies show results of a similar order of magnitude: levelling both smoking behaviour and physical activity could reduce inequality in mortality by 25% for men and women combined in the Netherlands22 and smoking behaviour alone reduces inequality by 32% in England.23 Laaksonen et al 24 show that levelling physical activity could reduce inequality for both lowest and middle educated by 14% among men and 9% among women and levelling smoking behaviour reduces inequality for the lowest educated by 28% among men and 22% among women. It should be mentioned that our choice of the highest socioeconomic group as the counterfactual prevalence implies that the percentage reduction in the excess RR will be the same as that in the absolute mortality rate. This would not be the case if an even more optimistic scenario was used, for example, total elimination of smoking. In the following, we will discuss specific limitations of our study, assumptions inherent to the PAF methodology and a comparison of the PAF approach to a regression analysis.
Limitations
First, the categories used in the prevalence data and the categories for which the RRs are found in the literature sometimes differed between countries and could not always be perfectly harmonised. Second, we used risk factor data that were measured at the same time or after the mortality data were registered. Ideally, the mortality outcome would be measured after the risk factor, including a risk factor-specific latency time. Depending on the trend of social differences in risk factor prevalence by country and risk factor, our PAFs may be overestimated or underestimated. We made sensitivity analyses based on Norwegian data from the cross-sectional Health Surveys conducted by Statistics Norway in 1975, 1985, 1995, 1998, 2002 and 2005. Overall, the trends in risk factors between 1975 and 2005 were similar between educational levels. Among men, social difference in alcohol consumption slightly widened, while they narrowed among women. In the first case, our PAF estimates would be too high and in the second too low. On the contrary, social differences in physical activity narrowed among men and widened among women. Finally, social differences in smoking behaviour increased, also implying an overestimation of the PAF estimates. However, most of these differences were marginal. By far the most differential trend occurred for smoking among women where the prevalence of persons who do not smoke daily decreased by 1.7% for low educated and increased by 5.2% for high educated every 10 years. A similar exercise with Belgian data of ever/never-smokers by birth cohort revealed similar trends for different educational groups. Because this problem in principle limits the substantial interpretation of the results,25 we would like to stress that this article is driven by illustrative purposes on how to apply the PAF method to socioeconomic differences in mortality. Third, for the same reason, we also did not calculate CIs for the results. This would be possible by calculating SEs for the normal distributions of log-rate-ratios and for the multinomial distributions of prevalences, using number of deaths and sample sizes, respectively. Given the necessary background data, one could obtain the SE and CIs of the resulting PAF distribution with bootstrapping. However, data gathering and computational effort are beyond the scope of this article.
The first fundamental assumption of the PAF approach is that the relative risks used in the PAF calculation accurately reflect the causal effects of the risk factors on mortality.7 ,9 We consider the assumption of causality from the proximate risk factor to mortality to be unproblematic because we relied on systematic reviews that have tried to filter out the causal relationship between risk factors and mortality. For example, the relative risks collected by the GBD study were adjusted for correlation between risk factors, confounding and mediation.26 The more uncertain causality from education to risk factors does not have to be assumed here because we simply show the effect of redistributing risk factors but we do not interpret our results as an explanation of health inequalities.
Second, the relative risks for the proximate risk factors are assumed to be the same for all three countries.8 This assumption is necessary for practical reasons, simply because there are no high-quality literature reviews on the impact of risk factors for each country. Here again, we rely on the Global Burden of Disease project. There is an increasing body of evidence stating that, when the metric of exposure is comparable, the RRs are similar across populations in different world regions.26
Third, the relative risks of the proximate risk factors are assumed to be the same for all educational groups. Whether a RR of, for example, smoking can be regarded as a biological constant or whether the impact of smoking differs between socioeconomic groups is still an open question.27 Evidence from the Whitehall II study suggests that smoking is more harmful for those placed lower in the social hierarchy,28 and evidence from New Zealand shows that the impact of smoking on mortality varies over time and by ethnicity29 but again there is no systematic data on how the impact of proximate risk factors differs by socioeconomic group.
Finally, the multicausal relationship in equation 2 is based on the assumption that exposures to risks are uncorrelated. In the present paper, we can account for the correlation with education by stratifying the analysis by educational group. Equation 2 also assumes that the effect of one risk factor is not mediated through another risk factor.30 In reality, it is likely that changing the distribution of one risk factor will also affect the distribution of other risk factors. As noted above, this potential bias has been partly corrected by adjusted RRs. For the close relation between physical activity and BMI, there remains uncertainty whether all bias has been removed because we had to use RRs from several studies (see web-only material) using different correction methods.
The PAF approach compared with the conventional regression approach
The research questions of this study may also be addressed with other methods, such as regression analysis.19 We therefore find it important to evaluate whether the PAF approach differs from a conventional Poisson regression in the quantification of the impact of a risk factor on social inequality in mortality. The cohort study GLOBE31 provides individual data that can be exploited for a regression analysis as well as for the PAF calculation explained above. The categories for the variables are the same as in our PAF calculation above. Table 4 includes (1) the current situation (first three rows with data), (2) a scenario where the smoking prevalence of the high educated is assumed for the whole population and (3) a scenario where the risk factors smoking, high BMI and low physical activity are completely eliminated. The left part of table 4 contains the regression results: we first estimate the effect of education on mortality. Then, we adjust for smoking status in order to show how much levelling social differences in smoking would change social inequality in mortality. By controlling for smoking inequality in mortality between the highest and the lowest educational group decreases from 1.72 to 1.69. The right part of table 4 shows the PAF approach: mortality rates and PAF values for the three educational groups, and below the mortality rates and RRs. For the first scenario where only the risk factor smoking is involved, the results of the PAF approach are the same as from the regression (1.72 and 1.69).
Contribution of differential health behaviour to educational differences in mortality in a comparison between a Poisson regression and the population attributable fraction (PAF) approach
In the first scenario, the results of the two approaches are the same if and only if we use the RR for the impact of smoking from a regression that controls for education. The second scenario where all three risk factors are eliminated is equivalent to a regression model where the interaction of each risk factor with education and all two-way interactions are included. For this scenario, we see that the results from the PAF approach differ from the regression. This is because the combined effect of several risk factors in the PAF approach is calculated with equation 2, which assumes that risk factors are uncorrelated and that there is no mediation. This assumption has been discussed above, and the comparison in table 4 shows the magnitude of the resulting bias in a real data set.
The main advantage of the PAF approach is that it can combine data from different sources, while a regression necessarily measures the risk exposure and the outcome in the same sample. This is not an advantage as such, but in many situations, country-specific data on both exposure and impact are not available. Moreover, results from large literature reviews (as used in our study) might be more accurate than small national surveys. The second advantage is that the PAF approach can address many scenarios where both prevalences and RRs are changed to any possible value in a straightforward way, while comparable regression results can only be obtained using a complex structure of dummy variables.
Conclusions
We show how the PAF methodology, which previously has only been used to calculate the contribution of risk factors to overall levels of health, can be systematically applied to socioeconomic inequalities in health. The results are similar to a conventional regression but the data requirements are much easier to meet, which facilitates comprehensive comparative studies across many countries. Our analysis shows the extent to which health inequalities can realistically be reduced by interventions on proximate risk factors. Such interventions may have targets that are more or less ambitious than the ones we have assumed here, but for policy setting, it is crucial to know the gender, country and risk factor-specific effects on health inequality.
What is already known on this subject
Substantial international variation in the magnitude of health inequalities suggests scope for reducing them by policy interventions on the distribution of risk factors. However, available methods have not been applied yet to estimate the potential impact on health inequalities of a social redistribution of risk factors.
What this study adds
We demonstrate that the PAF can be used to quantify the impact on health inequalities of modifying the social distribution of risk factors. Our results suggest that this impact is substantial and we show that the proposed method can be used to produce valuable information for priority setting in health policy and for the formulation of realistic quantitative targets for the reduction of health inequalities.
Acknowledgments
We thank Tim Huijts, from the Radboud Universiteit Nijmegen, Faculty for Social Sciences, for his help in preparing the data.
References
Supplementary materials
Supplementary Data
This web only file has been produced by the BMJ Publishing Group from an electronic file supplied by the author(s) and has not been edited for content.
Files in this Data Supplement:
- Data supplement 1 - Online table 1
Footnotes
Funding This work was supported by the Public Health Programme of the European Union, grant number 20081309.
Competing interests None.
Provenance and peer review Not commissioned; externally peer reviewed.