Article Text

Abstract
Study objective: To examine whether neighbourhood deprivation predicts incidence rates of coronary heart disease, beyond age and individual income.
Design: Follow up study from 31 December 1995 to 31 December 1999. Women and men were analysed separately with respect to incidence rates of coronary heart disease. Multilevel logistic regression was used in the analysis with individual level characteristics (age, individual income) at the first level and level of neighbourhood deprivation at the second level. Neighbourhood deprivation was measured at small area market statistics level by the use of Care Need Index.
Setting: Sweden.
Participants: All women and men aged 40–64 in the Swedish population, in total 2.6 million people.
Main results: There was a strong relation between level of neighbourhood deprivation and incidence rates of coronary heart disease for both women and men. In the full model, which took account of individual income, the risk of developing coronary heart disease was 87% higher for women and 42% higher for men in the most deprived neighbourhoods than in the most affluent neighbourhoods. For both women and men the variance at neighbourhood level was over twice the standard error, indicating significant differences in coronary heart disease risk between neighbourhoods.
Conclusions: High levels of neighbourhood deprivation independently predict coronary heart disease for both women and men. Both individual and neighbourhood level approaches are important in health care policies.
- neighbourhood deprivation
- care need index
- socioeconomic status
- coronary heart disease
- multilevel models
- CNI, Care Need Index
- CHD, coronary heart disease
- SAMS, small area market statistics
Statistics from Altmetric.com
Socioeconomic disparities in the risk of developing coronary heart disease (CHD), one of the major causes of death in Western countries, have been extensively examined in previous research. It has been shown that low individual social position (for example, low income) is strongly associated with both CHD1–5 and cardiovascular disease.6–8 However, in recent research the role of the neighbourhood environment for our understanding of inequalities in health has received increased interest,9 and a number of international studies suggest that neighbourhood level characteristics may have an important influence on CHD risk. The neighbourhood level characteristics studied in conjunction with CHD include neighbourhood income,10,11 neighbourhood education and occupational levels,12,13 and neighbourhood segregation.14 Some of these studies have reported significant associations between neighbourhood level characteristics and CHD, beyond individual level characteristics.14,15
The notion that disease determinants are in part environmental was emphasised by Durkheim over a century ago when he stated that a population is more than only the sum of all individuals.16 This notion was developed in Rose’s idea of the importance of distinguishing between the causes of individual cases of disease within a population, and the causes of differences in the rates of disease across populations.17 For example, if people within the same neighbourhood share the same socioeconomic environment, access to healthcare resources, norms settings and lifestyles, they may shape a common level of cardiovascular health beyond individual characteristics.
Even if these concepts are intriguing, it is only after the comparatively recent introduction of appropriate analytical methods (that is, multilevel regression models)18 that we are able to separate individual determinants of cardiovascular health from the effect of neighbourhood level characteristics. Hence, it has been possible to investigate how much of the individual differences in CHD risk can be attributed to the role of the neighbourhood socioeconomic characteristics beyond individual socioeconomic characteristics.15,19 Understanding these collective phenomena is relevant for both aetiological research and strategies of prevention.20 Previous studies of the neighbourhood effect on CHD risk have had some limitations such as lack of incidence data, small sample sizes, or an ecological design.
This multilevel study, therefore, analyses all Swedish women and men aged 40–64 years living in 8547 neighbourhoods with respect to CHD incidence, in total 2.6 million people. The Care Need Index (CNI), a composite deprivation index, measures neighbourhood deprivation.
The first aim of this study is to analyse whether there is an association between neighbourhood deprivation and incidence rates of CHD. The second aim is to analyse whether this association remains after accounting for individual income. The third aim is to analyse whether there is a neighbourhood effect on CHD beyond the individual effect.
METHODS
Study population and data sources
We performed a four year follow up study of the entire Swedish population aged 40–64 years, in total 2.6 million people. The participants were followed up from 31 December 1995 until first admission to hospital due to CHD or to censoring on 31 December 1999. All individual data were obtained from a national database including the whole Swedish population over 20 with annually collected individual information about, for example, sociodemographic characteristics and income. By means of a unique personal identification number we linked these data to the Cause of Death Register and the Swedish Hospital Discharge Register (National Board of Health and Welfare). All particpants were geocoded to their small area market statistics (SAMS) neighbourhoods. SAMS refers to the smallest administrative area units in Sweden with an average population of about 2000 residents in Stockholm and about 1000 residents in the rest of Sweden. The SAMS boundaries are drawn to include similar types of housing construction in a neighbourhood. Of the total 9667 SAMS existing in Sweden we excluded 1120 with less than 50 inhabitants because of unstable statistical estimates. This yielded a final sample of 8547 SAMS. A total of 64 528 of the individuals (2.8%) were excluded from the study because of missing SAMS codes. All 2.6 million individuals were divided into 10 groups (deciles) according to the level of neighbourhood deprivation in the SAMS neighbourhood where they lived. By this method each decile contained about one tenth of the individuals. The level of neighbourhood deprivation in each decile was calculated by the use of CNI.
Neighbourhood level variable
CNI: this index included proportions of seven socioeconomic and demographic items for each SAMS neighbourhood (that is, people with low educational status, unemployed people, elderly people living alone, children under age 5, single parents, residents who have moved house during the past year, and foreign born people from Finland, Southern and Eastern Europe, Asia, Africa, and South America), measured on 31 December 1995. CNI is an area based deprivation index aimed for distribution of primary healthcare resources. The different items in the CNI were originally constructed to measure the impact of these items on Swedish GPs’ workload based on their own ranking, and the scale is constructed so that the higher the CNI score the more deprived the neighbourhood.21 The UPA score or under privileged area score has been used in the UK to allocate an extra deprivation payment to primary health care in the most deprived neighbourhoods and CNI is a Swedish adaptation of the UPA score. CNI was based on register data with individual information on the entire adult population. We chose CNI as a measure of neighbourhood deprivation, because it is accessible for all SAMS neighbourhoods in Sweden. Moreover, CNI is highly correlated to the Townsend score (r = 0.79), a deprivation index developed in the U.K.22 In previous studies, according to CNI, the most deprived neighbourhoods were associated with different health outcomes, including increased mortality rates.21,23,24
The steps in the calculation of the CNI
-
The seven items were expressed as proportions of total residents in each of the Swedish SAMS neighbourhoods.
-
All Swedish GPs (response rate 64.8%, 2000) ranked the impact on their workload of the seven items on a scale from 0–9, where a higher value implied a higher workload.
– Weighti
– Elderly living alone: 6.15
– Foreign born people: 5.72
– Unemployed people: 5.13
– Single parents: 4.19
– Residents who have moved: 4.19
– People with low educational status: 3.97
– Children under age 5: 3.23
-
The population was then normalised by applying an angular transformation (arc sin √), meaning that each item was transformed to a symmetrical distribution to minimise the disproportionate effect of outliners (extreme values). The means (mi) and standard deviations (si) of the transformed proportions were calculated for Sweden as a whole.
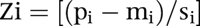
For each SAMS CNI was calculated as follows: For each SAMS the proportions (pi) of the seven items were standardised by calculating Z scores (mean = 0 and variance = 1). For each item the deviation from Sweden was calculated. The standardised value for each item is calculated as follows:

-
The standardised value for each item (Zi) was multiplied by each weight (weighti) calculated from the GPs’ ranking. Thus the contribution of each item (Vi) in CNI was calculated as follows:
For each SAMS the sum of Vi for all the items in CNI was calculated to obtain the CNI value for every SAMS in Sweden:
-
The mean value of CNI is 0, which corresponds to the average value for Sweden as a whole. The higher the CNI value, the more deprived is the neighbourhood. The CNI values varies from–53 (most affluent) to +79 (most deprived).


Individual level variables
Age was used as a continuous variable, and centred at the mean age of all individuals.
Individual income was divided into quintiles according to income level.
As our sample included the whole population in the actual age group, individual data were limited to certain variables such as age, gender, and socioeconomic status (SES). We chose to use only income as a measure of SES as the correlation between different SES measures is high.
Outcome variable
Coronary heart disease was defined as first non-fatal admission to hospital according to WHO’s International Classification of Diseases (ICD) version 9, codes 410–414, and ICD version 10, codes I20–I25. Persons with CHD hospitalisation during 1994 and 1995 were excluded. The validity of myocardial infarction diagnosis has been evaluated for 1987 and 1995 and was considered to be high.25
Statistical analysis
Age standardised incidence rates were calculated. We performed a multilevel logistic regression modelling,26,27 with individuals at the first level and neighbourhoods at the second level, to estimate odds ratios with 95% CI. Because of the large sample size it was not possible to use a multilevel Cox proportional hazards model in the computing process. Therefore, we used a multilevel logistic regression instead without including time as a variable in the model. Under certain circumstances (large sample size, low outcome incidence rate, risk ratios of moderate size, and not too long follow up), logistic regression is a good approximation of Cox’s proportional hazard model.28 We compared the two approaches by analysing a subsample of 25 000 individuals with both a multilevel logistic regression and a multilevel Cox proportional hazards model, and the results were almost identical. Thus the results were presented as odds ratios (OR) as a good approximation of hazard ratios.
We performed three models with separate analyses for women and men. The full model included age, the neighbourhood variable, and individual income.
The logistic model used is given by:

where fij denotes the fixed part of the model and uj the random part. The eij denotes the residual part.
We calculated the second level (that is, neighbourhood) intercept variance.
We computed the intraclass correlation (ICC)—that is, the intra-neighbourhood correlation—in order to estimate to what extent the individual propensity for CHD for individuals within the same SAMS was similar compared with individuals in other SAMS areas. The ICC expresses the proportion of the total variance that is at the neighbourhood level. The ICC in multilevel logistic regression can be estimated by different procedures.29 We applied the latent variable method26 as exemplified by:

where Vn is the between variance between neighbourhoods and π2/3 is the variance between individuals.
The proportion of the second level variance explained by the different variables was calculated as:

where Vo is the age adjusted variance in the initial model and V1 is the second level variance in the different models
We tested whether there were any random effects by the two highest and the two lowest income levels. No such effects were found. This implies that the relation between the first level variables (individual income) and CHD was the same in all kinds of SAMS, independently of differences in individual income. Possible cross level interactions were tested, but none were found. We also examined whether there was any heterogeneity between the SAMS neighbourhoods in each CNI decile by calculating the variance for every decile. For example, for women, the highest variances were found in deciles 2, 6, 8, 9, and 10.
Parameters were estimated by second order PQL. Extra-binomial variation was explored systematically in all models and we found no evidence of under or over dispersion. The MLwiN, Version 1.10.0007 software package30 was used to perform the analyses.
This study was approved by the ethical committee at Karolinska Institutet, Stockholm.
RESULTS
During the four years of follow up, 52 360 people (14 259 women and 38 101 men) developed CHD. Table 1 describes the sociodemographic characteristics of the population by CNI deciles and age adjusted CHD incidence rates. For both women and men CHD incidence rates increased with increasing neighbourhood deprivation. For women the incidence rate ratio in decile 10 (the most deprived decile), was twice as high as in decile 1 (the most affluent decile) while for men the rate ratio was 1.6.
Characteristics of the whole Swedish population aged 40 to 64 years, residing in 8547 neighbourhoods by neighbourhood Care Need Index (CNI), in deciles, and age standardised incidence rates of coronary heart disease, 1 325 284 men and 1 312 344 women, 31 December 1995 followed up until 31 December 1999
Table 2A shows the age adjusted and full model for women. When individual income decreased and the level of neighbourhood deprivation increased, the risk of CHD increased. For example, in CNI decile 5 the risk of developing CHD was 29% higher (OR = 1.29, 95%CI = 1.18 to 1.41) than in decile 1. In decile 10, representing the most deprived neighbourhoods, the CHD risk for women was 102% higher (OR = 2.02, 95%CI = 1.86 to 2.20) than in decile 1, the most affluent neighbourhoods. This pattern remained in the full model after adjustment for age and individual income. In decile 5 the CHD risk was 23% higher (OR = 1.23, 95%CI = 1.13 to 1.35) and in decile 10 the CHD risk was 87% higher (OR = 1.87, 95%CI = 1.72 to 2.03).
(A) Multilevel logistic regression showing odds ratios (and 95% confidence intervals) of coronary heart disease by age, individual income, and deciles of Care Need Index (CNI) for the 1 312 344 women aged 40 to 64 years and residing in 8547 neighbourhoods, 31 December 1995 followed up until 31 December 1999
Table 2B shows the age adjusted and full model for men. In the age adjusted model the risk of developing CHD was 19% higher (OR = 1.19, 95%CI = 1.13 to 1.25) in CNI decile 5 than in decile 1. In decile 10 the CHD risk for men was 65% higher (OR = 1.65, 95%CI = 1.57 to 1.73) than in decile 1. In the full model this pattern remained. In decile 5 the risk of developing CHD was 10% higher (OR = 1.10, 95%CI = 1.04 to 1.16) than in decile 1 and in decile 10 the CHD risk was 42% higher (OR = 1.43, 95%CI = 1.35 to 1.49) than in decile 1.
(B) Multilevel logistic regression showing odds ratios (and 95% confidence intervals) of coronary heart disease by age, individual income, and deciles of Care Need Index (CNI) for the 1 325 284 men aged 40 to 64 years and residing in 8547 neighbourhoods 31 December 1995, followed up until 31 December 1999
The variance at neighbourhood level was over twice the standard error, indicating significant differences in CHD risk between neighbourhoods.
The ICC in the full model was 0.021 for women and 0.009 for men, indicating that 2.1% and 0.9% of the total variance could be explained at the neighbourhood level for women and men, respectively.
Individual income for women explained 16% of the age adjusted neighbourhood variance, and this percentage was 45% for the neighbourhood deprivation variable (CNI). For men the corresponding percentages were 35 and 44%.
The full model including individual income and CNI explained 30 and 42% of the neighbourhood variance for women and men, respectively.
DISCUSSION
The main finding of this study is that neighbourhood deprivation, measured with CNI, predicts CHD incidence rates for both women and men. This association remains after adjustment for individual income. Furthermore, there is a neighbourhood effect on CHD beyond the individual effect.
Key points
-
Neighbourhood deprivation, measured with the Care Need Index, predicts incidence rates of coronary heart disease for both women and men, after taken individual income into account.
-
There is a neighbourhood effect on coronary heart disease, for both women and men, beyond the individual effect.
-
Strategies of coronary heart disease prevention need to combine individual level approaches with neighbourhood level approaches.
Based on the whole middle aged population of Sweden, this study confirms that low individual income and high levels of neighbourhood deprivation increase the individual’s risk of developing CHD.8,15,20 In addition, our study adds further evidence to the postulate that neighbourhood characteristics are an important predictor of CHD beyond the individual characteristics. Therefore, both a neighbourhood perspective and an individual perspective are needed when studying socioeconomic factors and their relation with individual CHD risk.
In agreement with this study, a large body of research in Europe and the USA has shown a strong relation between low individual SES and CHD.1,31 In the UK, civil servants with the lowest compared with the highest employment grade participating in the 25 year Whitehall follow up study had a 1.56 times increased risk of CHD.3 Longitudinal Finnish data revealed even higher CHD mortality and morbidity rates among men and women with low SES.4 The Scottish heart health study, in which both an area based deprivation indicator and the individual social position were used, showed an association with CHD.32 To study the effect of neighbourhood level characteristics on CHD outcomes, independent of individual level characteristics, some previous studies have used multilevel models. Our study agreed with these studies,14,15 demonstrating an independent effect of neighbourhood deprivation on incidence rates of CHD. In contrast, other studies disagreed with our study and suggested that the differences in CHD risk between neighbourhoods are merely a result of differences between individuals.33–35 However, our multilevel study included the entire middle aged Swedish population and showed a significant variance between neighbourhoods, implying that there were significant differences in CHD risk between neighbourhoods.
Various mechanisms in the causal pathway between the neighbourhood effects on individual health have been suggested. It is possible that living in deprived neighbourhoods implies isolation from people with healthy behaviours for the heart. Such behaviour includes a healthy diet, physical activity, and non-smoking and might act as a mediator between living in deprived neighbourhoods and increased CHD risk. However, in a multilevel study from the US, mortality risks were higher in deprived neighbourhoods even after adjustment for individual body mass index and smoking.36 Another multilevel study from the US demonstrated the importance of income inequality for mortality.37 In contrast with the US, Canada has a lower degree of income inequality and in Nova Scotia, Canada, neighbourhood socioeconomic characteristics were not significantly associated with mortality.38 In the UK, previous studies of places and people have shown a neighbourhood effect on health, and Macintyre39,40 suggests a theoretical framework with five types of features of neighbourhoods that might explain differences in health: (1) physical features of the environment shared by all residents in a locality, (2) availability of healthy environments at home, work, and play; (3) services provided, publicly or privately, to support people in their daily lives; (4) socio-cultural features of a neighbourhood; and (5) the reputation of an area. All these features are probably closely related to the level of neighbourhood deprivation and the risk of developing CHD.
Policy implications
-
Individual level approaches should be combined with neighbourhood level approaches to reduce socioeconomic disparities in the risk of developing coronary heart disease. For clinicians in deprived neighbourhoods it is important to consider both individual and neighbourhood socioeconomic characteristics in the treatment and prevention of CHD. Moreover, when planning the distribution of healthcare resources it is of great importance to consider the level of neighbourhood deprivation, as measured with the Care Need Index, to better reach people who are at high risk of developing CHD.
Living in deprived neighbourhoods also means isolation from health promoting milieus, for example, safe places to exercise, decent housing, and services provided. The experience of being discriminated against in deprived neighbourhoods with a poor reputation may also contribute to a negative cardiovascular health profile, which may be especially important for women.41
In comparisons of wealthy nations, the association between neighbourhood characteristics and different health outcomes was inconsistent.42 For example, France, Italy, and Spain, countries with higher income inequalities, had higher life expectancy than Denmark and Finland, countries with lower income inequality. This implies that neighbourhood characteristics as determinants of health are of a complex nature and might also include evenly distributed access to health care, education, and social services. This evenness is absent in the US, where the effects of income inequalities on health are more pronounced.
Sweden is a society well known for its equity. However, we found a significant neighbourhood effect, as measured with CNI, on CHD risk. Several plausible pathways might generate these neighbourhood differences in health, including physical and psychosocial features of the environment, housing, services provided, isolation from health promoting milieus, and discrimination. It is also possible that relative poverty is of greater importance than absolute poverty in a wealthy nation like Sweden. Historical and cultural features of a country are also important to consider, especially if comparisons between countries are desirable.
We want to emphasise that if aspects of the social environment influence health by operating as upstream determinants of individual characteristics,9 then control for many downstream individual characteristics may over-adjust the true effects of the context.43 This is even more salient if one poses the cross level casual question in a life course developmental framework, where the effects of various aspects of the environment are literally embodied over time,44–46 so that what is assigned as an individual level variable at one time point could equally be conceptualised as a characteristic of past environments in which those individuals grew up.
Strengths and limitations
This study has several strengths. Firstly, the Swedish Population Register is highly complete with very few missing data. For example, data about income were quite complete (99.4%). Completeness of addresses for geocoding to determine area based location was also high, and only 2.4% of the individuals were excluded because of missing SAMS codes. The use of a personal identification number makes it possible to follow individuals in different registers, for example, the migrant register, permitting calculation of exact risk time. Secondly, the validity of the In-Care Register concerning the diagnosis myocardial infarction has been evaluated and is of high quality.25 Thirdly, the prospective nature of our data allowed us to calculate incidence rates of CHD, rather than prevalence, a much stronger outcome for determining causal relations. Fourthly, data consisted of the entire Swedish population, women and men, aged 40–64. Fifthly, our area based measure, CNI, included proportions of seven socioeconomic and demographic items for each SAMS neighbourhood. Earlier studies of CNI have shown a strong association between CNI and other health outcomes.21,23,24 Finally, the use of multilevel modelling helped us to separate the neighbourhood effect from the individual effect on CHD risk, considering both fixed and random effects in the analyses.47
Our study also has some limitations. Firstly, we had no information on individual level risk factors for CHD (for example, smoking, diet, and physical activity). However, risk factors could be considered as mediators in the causal pathway between neighbourhoods and CHD, rather than confounders. Secondly, we were not able to adjust the models for the length of time participants had lived in their neighbourhoods (that is, exposure). However, in a Swedish survey conducted by Statistics Sweden 1986–1993, it was found that 75% had lived at their home address for at least eight years preceding the survey. Thirdly, the selection of SAMS neighbourhoods might imply selection bias, but in this study almost all SAMS neighbourhoods in Sweden were included. Although it is possible that SAMS is not the best proxy for defining the “true social boundaries” that may influence CHD risk, SAMS seems coherent when it comes to both ownership and the type of buildings that make up the area. Therefore, this level may represent a rather natural delimitation of the social environment. Fourthly, in studies of the neighbourhood effect on health, selective residential mobility (deprived individuals move to deprived neighbourhoods) is part of the process that drives compositional neighbourhood differences. However, we adjusted for individual income, allowing us to differentiate between the compositional and contextual effect on CHD risk. However, we cannot rule out the possibility that the observed association between neighbourhood deprivation and CHD risk is the result of residual individual confounding by unobserved socioeconomic characteristics.48 For example, individual education and income cannot be measured precisely.49,50
Acknowledgments
The authors wish to thank Helena Ahlén at Karolinska Institutet, Family Medicine Stockholm, for statistical analyses, and Sanna Sundquist, student at Foothill College, California, for technical assistance.
REFERENCES
Footnotes
-
Funding: this work was supported by grants from the National Institutes of Health (1 R01 HL71084–01), the Swedish Council for Working Life and Social Research (2001–2373), the Swedish Research Council (K2001-27X-11651-06C), the Knut and Alice Wallenberg Foundation, and the Stockholm County Council.
-
Conflicts of interest: none declared.