Article Text

Abstract
Objective: To conduct a population based study of brain arteriovenous malformation (AVM) prevalence.
Methods: Multiple, overlapping sources of case ascertainment were used to establish the point prevalence of brain AVMs in the adult population of the Lothian health board of Scotland. Patients were sought retrospectively from all local general (family) practitioners, neurologists, neurosurgeons, stroke physicians, the specialist AVM clinic at the regional neuroscience centre, and routine coding of hospital discharge data. Case notes, brain imaging, and pathology reports were reviewed to validate each patient’s diagnosis and to ensure that each was alive, over the age of 16 years, and resident in the geographical area of the study on the prevalence date of 30 June 1998.
Results: Of 148 potentially eligible people, 93 adults met the inclusion criteria. There were 40 women and 53 men. Men were significantly younger than women on the prevalence date (median age 39 years v 51 years, p = 0.003). Of those included, 25 (27%) had radiological evidence of prior therapeutic obliteration of their brain AVM and 9 (10%) had coexisting aneurysms. The minimum crude brain AVM prevalence was 15 per 100 000 adults and capture-recapture analysis gave an ascertainment adjusted prevalence of 18 (95% confidence interval 16 to 24) per 100 000 adults.
Conclusions: The minimum estimate of brain AVM prevalence helps to assess its burden and comparative epidemiology and stresses the importance of brain AVMs as a cause of long term disability in adults.
- intracranial arteriovenous malformations
- central nervous system vascular malformations
- prevalence
- AVM, arteriovenous malformation
- CI, confidence interval
- GP, general practitioner
- ICD, International classification of diseases
- ISD, Information and Statistics Division
- IVM, intracranial vascular malformation
Statistics from Altmetric.com
- AVM, arteriovenous malformation
- CI, confidence interval
- GP, general practitioner
- ICD, International classification of diseases
- ISD, Information and Statistics Division
- IVM, intracranial vascular malformation
Brain arteriovenous malformations (AVMs) account for approximately one third of primary intracerebral haemorrhage in young adults.1 In population based studies, half of the adults with a first in a lifetime diagnosis of a brain AVM present with intracranial haemorrhage.2 The risk of death is greatest in the month following a first ever haemorrhage, with a 30 day case fatality of about 18%.3 This relatively low early case fatality and a subsequent annual case fatality of about 1% is likely to leave a sizeable prevalent burden of adults with long term disability who are potentially exposed to the risks of recurrent haemorrhage or epilepsy.
Hospital based post mortem series have reported brain AVM prevalence of up to about 600 per 100 000 but these estimates are likely to have been considerably biased by the method of cohort selection and the thoroughness of lesion ascertainment.4–6 A community based study found the point prevalence of the whole spectrum of intracranial vascular malformation (IVMs) to be 19 (95% confidence interval (CI) 10 to 27) per 100 000 on 1 January 1990,7 from which an upper limit for brain AVM prevalence of about 10 per 100 000 has been inferred.8 As yet there have been no population based studies specifically investigating brain AVM prevalence.1,8
The size of the study population and the methods of case ascertainment affect prevalence estimates. Although larger studies produce more precise estimates they are likely to miss cases, whereas thorough ascertainment is more feasible in smaller studies, which inevitably produce less precise estimates. While common diseases such as stroke are amenable to extensive surveys of population samples for the disease,9 rarer disorders such as brain AVMs require targeted surveillance of the parts of the health care system actively involved in their management or passive inspection of secondary data sources.
Therefore, we sought to estimate the prevalence of brain AVMs in a sizeable adult population of a geographically and demographically well defined community in Scotland, by using active surveillance of clinicians involved in the care of such people, as well as passive case ascertainment from routinely collected data.
METHODS
Inclusion criteria
We included adults who were aged 16 years or over and permanently resident in the Lothian health board area of Scotland on 30 June 1998 and in whom a brain AVM had been diagnosed before this prevalence date. We defined a brain AVM as an anastomosis of non-nutritive blood vessels in the brain parenchyma, in which arteriovenous shunting occurred in a central nidus (the tangle of vessels in which usually multiple arteries and veins converge) or in a single fistula between one feeding artery and one draining vein. Diagnoses were deemed to be definite if there had been unequivocal pathological examination or evidence of a characteristic serpiginous cluster of calcified or enhancing vessels on computed tomography, flow voids on magnetic resonance imaging, or arteriovenous shunting on catheter angiography.
Exclusion criteria
We excluded people who did not fully meet the inclusion criteria above and those with pure vein of Galen malformations, dural AVMs, or any other type of IVM occasionally confused with a brain AVM.10
Study setting
The Lothian health board covers 1813 km2 in southeast Scotland, ranging from the Pentland Hills to the shores of the Firth of Forth and the North Sea, including the city of Edinburgh, the capital and administrative centre of Scotland. The Lothian health board is geographically defined by postcodes, enabling clear criteria for residency within the community. Although the most recent decennial census in Scotland was conducted in 2001, the results are not yet available. Between censuses the General Register Office for Scotland (<www.gro-scotland.gov.uk>) estimates the size and age structure of the Scottish population annually from registration of births and deaths, as well as immigration and emigration data. The estimated population of the Lothian health board on 30 June 1998 was 773 700, of whom 628 788 were ≥ 16 years of age. The stability of the whole population is reflected by a flux of only 0.2% over the year leading up to 30 June 1998, mostly attributable to 8892 births, 8157 deaths, and 665 estimated net civilian migrations.4
The study was based at the regional neuroscience centre at one hospital in Edinburgh, which serves the population of the Lothian health board (and others) and provides the only specialist brain AVM clinic for the southeast of Scotland. Few residents receive health care outside Scotland except on a quaternary referral basis and there is little cross boundary flow of the population for health care, which minimises missing diagnoses made outside Scotland. Almost every patient is registered with a general (family) practitioner (GP). Virtually all health care is accessed through the NHS and patients with a diagnosis made in private practice are usually referred to the NHS specialist brain AVM clinic. Apart from the usual facilities for rehabilitation, there are no particular services that would lead to the Lothian health board harbouring an excess of disabled people.
The Information and Statistics Division (ISD) in Scotland (<www.show.scot.nhs.uk/isd>) has centrally registered every person discharged from an NHS hospital since 1980, collated the General Register Office’s death certificate records, and coded main and subsidiary diagnoses according to the 9th and 10th revisions of the International classification of diseases (ICD). These databases are available for use in research studies with ethics committee approval. Several mechanisms for ensuring data quality are in place at ISD, including validation, accreditation, quality assurance and monitoring, and national coding advice and training programmes.11
Study design
We used multiple overlapping sources of case ascertainment to identify adults meeting the inclusion criteria.
Collaborative neuroscience network
We approached all consultant neurologists, neurosurgeons, and stroke physicians covering the study area, who were also part of a collaborative network participating in a larger, nationwide incidence study of adults with IVMs, to obtain lists of their patients meeting our inclusion criteria. We also searched the diaries from 1995 until 2000 of the specialist brain AVM clinic operating at the regional neuroscience centre.
General (family) practitioners
We wrote to all 557 GPs at the 101 general practices in the study area in 1999, requesting details of adults registered at the practices who met our inclusion criteria. We presupposed that GPs would find such people memorable, as each GP was unlikely to look after more than one person with a brain AVM. We were unable to search GPs’ patient databases because of the inadequate coding of brain AVMs in their “Read” coding system and because of changes in data protection legislation in the United Kingdom and confidentiality guidance at the time of this study.12
Routine coding of hospital discharge data
In early 2000, colleagues at ISD searched the national database of hospital admissions and discharges (Scottish Morbidity Records). They identified every adult who was alive on the prevalence date and who had been discharged from a Scottish hospital to an address in the Lothian health board at any time with an ICD code for a brain AVM (ICD-10 codes I60.8 and Q28.2; ICD-9 codes 430 and 747.8).
Data collection and validation
All available case notes, and brain imaging and pathology reports were reviewed to validate each person’s brain AVM diagnosis and to ensure that they were alive, over the age of 16 years, and resident in the geographical area of the study on the prevalence date of 30 June 1998. Brain imaging, pathology reports, or both were available in every case. Residence was determined by comparing an adult’s home postcode on the prevalence date with a database of all the postcodes defining the Lothian health board. We had no difficulty in matching duplicate notifications of adults between the sources by using first name, surname, and date of birth, in the absence of any other unique identifier.
Statistical analysis
We calculated crude prevalence as the proportion of the adult (aged ≥ 16 years) mid-year population estimate for the Lothian health board that was known to fulfil our inclusion criteria. Age standardised prevalence estimates were directly age adjusted to the last census in the United Kingdom in 1991 (<http://www.census.ac.uk>) and the last census in the United States in 2000 (<http://factfinder.census.gov>). We based 95% CIs around prevalence estimates on the Poisson distribution and calculated them with confidence interval analysis software.13 Tests for significance were performed in SPSS version 10.0.5 (SPSS Inc, Chicago, Illinois, USA). SAS version 8 (SAS Institute, Cary, North Carolina, USA) was used for capture-recapture analysis.
Ethical approval
This study was approved by the Multicentre Research Ethics Committee for Scotland (MREC/98/0/48) and the Lothian Local Research Ethics Committee.
RESULTS
Recruitment
In total, 148 people were identified by the three sources of case ascertainment as potentially meeting the study inclusion criteria. Of these people, medical records were missing in four and 51 were excluded (mainly because they were resident outside the Lothian health board), leaving 93 adults included in the study (fig 1).

Flow diagram of people notified to the study. AVM, arteriovenous malformation.
Baseline characteristics
Of those included, 53 were men and 40 were women, and men were significantly younger on the prevalence date than women (median age 39 years v 51 years, p = 0.003; table 1). The majority (72; 77%) had been investigated with catheter angiography, usually in combination with axial brain imaging (fig 2). Nine adults (10%) had coexisting aneurysms. Fifty eight (62%) of 93 brain AVMs were located in so called eloquent areas (table 2), according to the Spetzler-Martin grading scheme’s determination of eloquence (hypothalamus, thalamus, brain stem, cerebellar peduncles, and sensorimotor, language, and visual cortex).14 Every brain AVM was solitary and did not occur in combination with any other IVM. There was radiological evidence of therapeutic obliteration of the AVM in 25 (27%) adults.
Baseline characteristics of 93 prevalent adults with brain arteriovenous malformations (AVMs)
Principal locations of the 93 brain AVMs, their laterality, and their so called eloquence (asterisked) according to the Spetzler-Martin grading scheme16
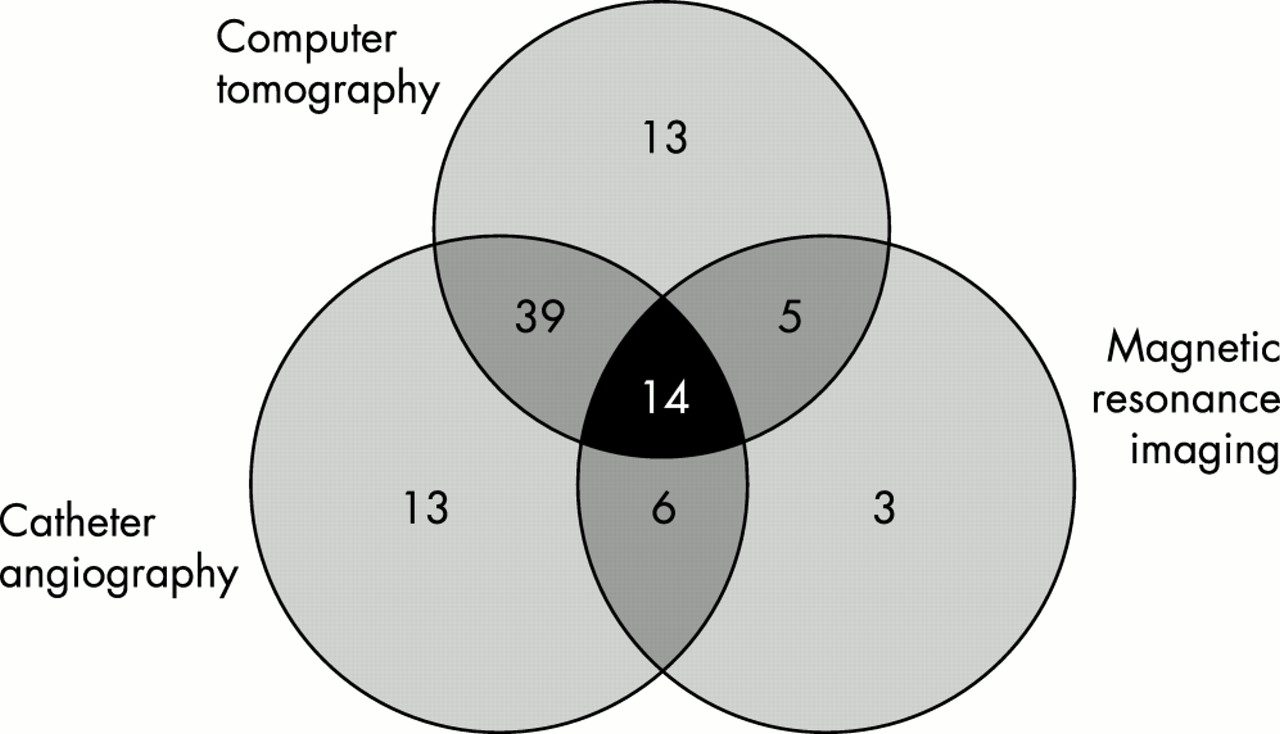
Venn diagram illustrating the radiological investigations that led to a definite diagnosis of a brain AVM in the 93 prevalent adults.
Prevalence
Ninety three adults had had a brain AVM diagnosed at some time during their life and were living in the Lothian health board on 30 June 1998, giving a crude prevalence of 14.8 (95% CI 11.9 to 18.1) per 100 000 adults. Figure 3 shows age and sex specific prevalences. Men were more prevalent in younger age groups, explaining their lower median age at diagnosis, although the 95% CIs of the sex specific prevalence estimates overlapped in each mid-decade age band. Prevalences directly age adjusted to the 1991 census population in the United Kingdom and the 2000 census population in the United States were 14.6 and 14.7 per 100 000 adults, respectively.
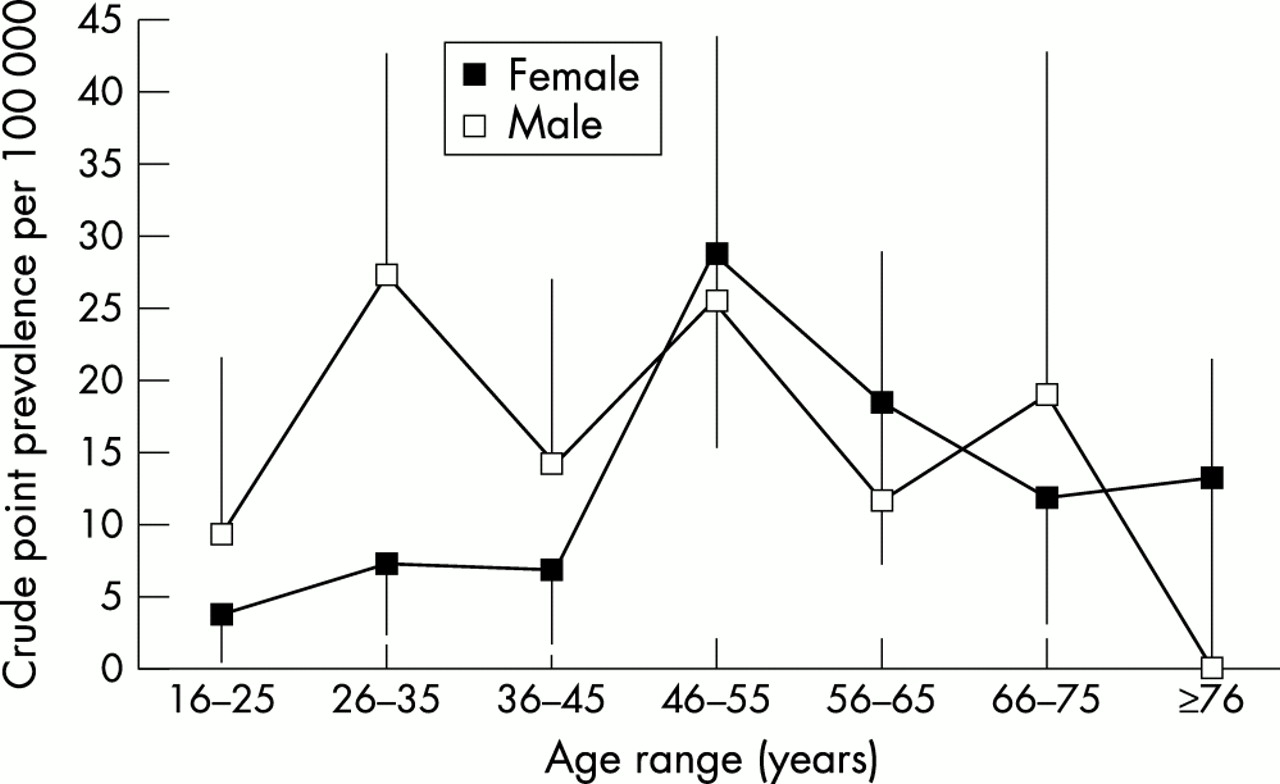
Age and sex specific crude point prevalences for adults with brain arteriovenous malformations, with lower 95% confidence intervals (CIs) and upper 95% CIs.
Adjustment for incomplete case ascertainment
Figure 4 shows the degree of overlap between the study’s three major sources of case ascertainment. Routine coding of hospital discharge data was the most productive source, identifying 70 (75%) patients, followed by hospital consultants and AVM clinic diaries (48; 52%) and GPs (36; 39%). There was a sizeable overlap between sources, with 47 (51%) adults identified by at least two sources. We have used capture-recapture analysis to estimate the number of people potentially missed, based on the observed overlap between the three sources of case ascertainment.15 We presupposed that the sources would be dependent but to varying degrees and that there was most likely to be dependence between hospital consultants/specialist brain AVM clinic and routine coding because of the derivation of the latter from the former.

Venn diagram of overlap between the sources of case ascertainment of the 93 prevalent adults.
There are eight possible log-linear models, each with a different configuration of dependencies between three sources of ascertainment (table 3). The residual deviance is a measure of the “goodness of fit” of each model compared with the model in which all sources are assumed to be dependent; the better the fit, the lower the residual deviance. The model we chose had the lowest residual deviance and estimated that 20 (95% CI 7 to 55) prevalent adults were missed by our study. The coverage (or completeness) of our study—calculated from the number of cases observed (93) as a proportion of the cases expected on the basis of capture-recapture analysis (100 to 148)—was 63–93%. By including this estimate of 20 missed cases, the ascertainment adjusted brain AVM prevalence was 18 (95% CI 16 to 24) per 100 000 adults.
Eight log-linear models for three source capture-recapture analyses, accompanied by the residual deviance and estimated number of missing cases (with 95% confidence interval (CI)) for each model
DISCUSSION
In this first community based study of brain AVM prevalence, we found a crude prevalence of 15 (95% CI 12 to 18) per 100 000 adults. The prevalence may be as high as 18 (95% CI 16 to 24) per 100 000 adults if capture-recapture analysis is used to estimate the number of cases missed by our ascertainment process. Therefore, using the 95% CI around this second estimate, in the year 2000, we find that adults with a brain AVM numbered between 650 and 1000 in Scotland, 7600 and 11 400 in the United Kingdom, and 35 400 and 53 000 in the United States. Our study illustrates the burden on the public health care system of a condition that has potential long term risks of recurrent intracranial haemorrhage and epilepsy, as well as other disability, and that attracts expensive interventional treatments. These estimates have implications for the planning, purchasing, and provision of health services for people with a brain AVM.
The nature of brain AVMs
Brain AVMs themselves pose several challenges for epidemiological studies. The people who have a diagnosis of brain AVM are probably an inherently biased group, as the suspicion of an underlying brain AVM and the use of investigations to identify it depend on aspects of the patient and their presentation. Younger people with recurrent intracranial haemorrhage, recurrent or focal epilepsy, and atypical headache are more likely to be investigated. Regional investigation practices among neurologists, neurosurgeons, and neuroradiologists would further influence these biases, as would the availability of brain imaging and catheter angiography. Moreover, any prevalence estimate would be affected by historical patterns of investigation—the paucity of elderly people in our sample is undoubtedly affected by the reliance on catheter angiography for diagnosis before the 1970s.
These same factors influence the detection of asymptomatic brain AVMs. The number of asymptomatic brain AVMs at any one time remains in some senses imponderable because the development of brain AVMs is likely to be dynamic—they are not necessarily congenital.16 Although published studies of asymptomatic volunteers undergoing magnetic resonance imaging have not detected asymptomatic brain AVMs,17,18 a “brain check up” system in Japan has found, using magnetic resonance angiography, 3 (0.1%) of 3085 apparently healthy people (mean age 55 (11) years, male to female ratio 2:1) to harbour a brain AVM (Yukito Shinohara, Tokai University School of Medicine, personal communication).
Methodological biases
This study is best regarded as providing a minimum estimate of brain AVM prevalence. While complete ascertainment and overlap between sources would be desirable, it is virtually impossible in any study of a large population. Our estimate of 63–93% completeness (based on capture-recapture analysis) appears reasonable. The extent of intersection of our sources of ascertainment would have been affected by the number of adults admitted to hospital and so included in routine coding, the accuracy of hospital discharge data and ICD coding, the thoroughness of GP, consultant, and AVM clinic records, and the extent of clinicians’ memories. The absence of any other feasible, local sources of case ascertainment make this study difficult to improve upon. Perhaps a future cross sectional analysis of our longitudinal inception cohort study of all incident IVMs in the adult population of Scotland would be more precise and so have good statistical power to detect any future change from our contemporary prevalence estimate.
Capture-recapture analysis
Capture-recapture methods were originally developed by ecologists for censuses of wildlife. Animals are captured, tagged, and released back into the wild, and the process repeated. The total size of the animal population is estimated from the proportion of animals that were tagged by the first capture and “recaptured” by the second. The parallels with epidemiological studies using several sources have resulted in widespread, albeit controversial, use of the technique.15,19 Capture-recapture analysis has been particularly useful for estimating the frequency of neurological conditions because it minimises the cost of exhaustive methods of case ascertainment and prevents underestimation of disease frequency.20,21 However, the results of capture-recapture analysis must be interpreted and presented with caution22 because the assumptions inherent in the technique do not always hold in human populations.19,20,23
The technique requires that the population size be constant (that is, there are no changes due to birth, death, or migration), that members of the population under study be recognisable and equally “catchable”, and that the sources of ascertainment be independent to enable the use of asymptotic statistical theory. Although study of a fixed population is impossible, stable populations—such as the Lothian health board—are an adequate approximation. In the health care setting, sources of ascertainment are usually dependent to varying degrees; for example, inclusion in one source (hospital consultant and AVM clinic records) confers inclusion in another source (routine coding of hospital discharge data). Such positive dependency between two sources may underestimate the number of people missed. Certain aspects of people may make them more likely to be ascertained by one source than another (for example, people investigated as outpatients who are not thought to require treatment are more likely to be identified by GPs than by AVM clinic diaries). Such negative dependency between sources may overestimate the number of people missed. The assumption of equal “catchability” rarely holds because severely affected people are more likely to be captured.21 Therefore, the estimate of the total population of adults with brain AVMs may be biased by assuming that the missing cases resemble the ascertained ones.
While capture-recapture analysis is most straightforward when two sources are used, the above complexities of human populations have attracted methods that use more than two sources and log-linear modelling of source dependencies.15 It is generally held that three sources are ideal in epidemiological studies. Clearly the number of missing people is sensitive to the choice of model (table 3). We chose the most parsimonious model that did not assume dependence between all three sources but that modelled dependence between GPs and the hospital source, as well as the dependence we had presupposed to exist between the hospital source and routine coding. This latter dependence was expected in practice because routine coding is derived from records of hospital admissions. In our chosen model, the other dependence (between GPs and hospital based sources) is unsurprising, given the reliance on hospital based investigations for brain AVM diagnosis.
A recent approach to address the influence of patient characteristics that may influence the probability of capture by different sources (for example, demographics and disease severity) has been to stratify patients by these characteristics or to use a multinomial logit model to identify and account for them.21,24 This is an approach we would have used, were it not for the unavailability of the complete medical record in every case.
Conclusions
Our minimum prevalence estimates portray the impact of brain AVMs on public health. The methods and analysis of case ascertainment in this study form the basis for statistical power calculations for other prevalence studies. There is also growing interest in the incidence of brain AVMs and the impact of diagnostic suspicion bias and brain imaging use on detection rates.2,25,26 Such population based studies will also further knowledge about the comparative epidemiology, burden, and prognosis of brain AVMs.
Acknowledgments
Rustam Al-Shahi was funded by a Medical Research Council clinical training fellowship. This study was also supported by the Chief Scientist Office of the Scottish Executive Health Department (K/MRS/50/C2704), a travel grant from Chest, Heart and Stroke Scotland, and a Small Project Grant from the University of Edinburgh. We are very grateful to Lena Henderson of the Information and Statistics Division, David Watson, Rosemary Anderson, and Staff Nurse Ann Douglas.
REFERENCES
Footnotes
-
Competing interests: none declared