Inequalities in mortality during and after restructuring of the New Zealand economy: repeated cohort studies
BMJ 2008; 336 doi: https://doi.org/10.1136/bmj.39455.596181.25 (Published 14 February 2008) Cite this as: BMJ 2008;336:371
- Tony Blakely, research professor1,
- Martin Tobias, principal adviser2,
- June Atkinson, senior analyst and team leader1
- 1Health Inequalities Research Programme, University of Otago, Wellington, PO Box 7343, Wellington, New Zealand
- 2Epidemiology, Public Health Intelligence, Ministry of Health, PO Box 5013, Wellington, New Zealand
- Correspondence to: T Blakely tony.blakely{at}otago.ac.nz
- Accepted 19 November 2007
Abstract
Objectives To determine whether disparities between income and mortality changed during a period of major structural and macroeconomic reform and to estimate the changing contribution of different diseases to these disparities.
Design Repeated cohort studies.
Data sources 1981, 1986, 1991, 1996, and 2001 censuses linked to mortality data.
Population Total New Zealand population, ages 1-74 years.
Methods Mortality rates standardised for age and ethnicity were calculated for each census cohort by level of household income. Standardised rate differences and rate ratios, and slope and relative indices of inequality (SII and RII), were calculated to measure disparities on both absolute and relative scales.
Results All cause mortality rates declined over the 25 year study period in all groups stratified by sex, age, and income, except for 25-44 year olds of both sexes on low incomes among whom there was little change. In all age groups pooled, relative inequalities increased from 1981-4 to 1996-9 (RIIs increased from 1.85 (95% confidence interval 1.67 to 2.04) to 2.54 (2.29 to 2.82) for males and from 1.54 (1.35 to 1.76) to 2.12 (1.88 to 2.39) for females), then stabilised in 2001-4 (RIIs of 2.60 (2.34 to 2.89) and 2.18 (1.93 to 2.45), respectively). Absolute inequalities were stable over time, with a possible fall from 1996-9 to 2001-4. Cardiovascular disease was the major contributor to the observed disparities between income and mortality but decreased in importance from 45% in 1981-4 to 33% in 2001-4 for males and from 50% to 29% for females. The corresponding contribution of cancer increased from 16% to 22% for males and from 12% to 25% for females.
Conclusions During and after restructuring of the economy disparities in mortality between income groups in New Zealand increased in relative terms (but not in absolute terms), but it is difficult to confidently draw a causal link with structural reforms. The contribution of different causes of death to this inequality changed over time, indicating a need to re-prioritise health policy accordingly.
Introduction
New Zealand underwent major structural reform from 1984 to the early 1990s, including the introduction of a substantially flattened tax system, fully targeted income support, a regressive consumption tax, market rentals for housing, privatisation of major utilities, user charges for health, education, and other government services, and a restructured labour market designed to facilitate “flexibility.”1 2 3 At the same time as these reforms, rates of unemployment and poverty rose. Unemployment rates increased from 4.1% in 1986 to 10.4% in 1992, then steadily fell to 3.7% in 2005.4 Likewise, the proportion of the population aged 15 years and older with incomes (net of housing cost) below the 60% median income poverty threshold increased from 12.3% in 1987-8 to 26.5% in 1992-3, then fell to 20.9% in 1997-8, and has remained stable ever since.4 Measures of income inequality (such as the Gini coefficient) show similar trends.4 5 New Zealand was one of four of 25 OECD (Office for Economic Cooperation and Development) countries with a “strong increase” (12% or more) in its Gini from the mid-1980s to mid-1990s, and it has changed little since. This increase was brought about both by falls in the real incomes of poorer households and increases among richer households. Around 2000, New Zealand’s Gini ranked eight of 25 OECD countries.5 There was also an economic recession in the early 1990s, with the real gross national disposable income (RGNDI) per capita falling 10% between 1990 and 1992.4 From 1992 to 2004, however, this grew steadily by an average of 2.5% a year.
We examined whether disparities in mortality by income varied in tandem with the restructuring of the New Zealand economy and the attendant widening in social inequalities. In the 1970s McKeown supported the importance of standard of living and nutrition as determinants of trends in mortality,6 while Preston argued that economic development (with accompanying increases in real incomes) was less important and suggested that advancements in medical care and related technologies might be the key.7 This debate continues today.8 9 10 11 12 13 Downward trends in mortality have been observed to continue unabated in the face of economic recession,14 15 and sometimes declines in mortality are more rapid in economically difficult times.16 The recent problems in the ex-Soviet states have been notable exceptions, with dramatic declines in life expectancy accompanying the social upheaval and economic collapse.17 18 19 There is less empirical work examining the association of trends in health inequalities with trends in economic conditions. One study in Russia found that changes in mortality rates were greatest among those with little education.20 Across six European countries, however, relative socioeconomic inequalities in mortality increased similarly from the early 1980s to early 1990s, despite differing trends in macroeconomic performance.21
Previously, we hypothesised that health inequalities would have increased more in New Zealand than in Scandinavian countries (Denmark, Finland, and Norway) for which similar data (that is, mortality rates by educational level) were available because of the more rapid and pronounced macroeconomic changes in New Zealand.22 (Although Finland also experienced high unemployment in the early 1990s along with an economic recession, income inequalities did not widen as much as they did in New Zealand23). Contrary to our hypothesis, we found similar increases in relative inequalities in mortality by education across all four countries.22
We examined trends in disparities in mortality by equivalised household income (income adjusted to account for variations in size and composition of household) within New Zealand over a period of major structural reform. Assuming that at least some of the observed association between income and mortality is causal,24 we would expect the widening income distribution to result in widening disparities between income and mortality when income is used as a ranking variable. Additionally, if macroeconomic factors such as unemployment rates and poverty levels impact on population health, we would expect to see differential trends in mortality between income groups.
In a secondary objective we quantified the changing contribution of different causes of death to the observed disparity. We previously reported the fall of cardiovascular disease and the rise of cancer as drivers of disparities up to 1996-9 in New Zealand.25 We now test the hypothesis that these trends have continued. Projecting which conditions are likely to drive inequalities in mortality in the future should inform the priority accorded to different health policies for specific diseases and risk factors.
Methods
Data
We assembled mortality records for people alive on the previous census night who died aged 1-74 years within three years of the 1981, 1986, 1991, 1996, or 2001 censuses. We used probabilistic record linkage methods to anonymously link these mortality records to corresponding census records (using Automatch and Validity software). The matching variables were sex, date of birth, country of birth, and ethnic group. The blocking variable was address (geocoded at meshblock (about 100 people) or census area unit level (about 2000 people), so individuals who changed address between the census night and death were less likely to be linked. The percentages of eligible mortality records linked to a census record were 70.9%, 73.7%, 76.3%, 77.6%, and 79.6% for the five census cohorts, respectively. Over 96% of these linkages were estimated to be true positives.26 To correct for any linkage bias and to avoid underestimation of mortality rates using the linked datasets, we calculated weights for strata based on age, sex, ethnicity, and small area deprivation. For example, if 20 out of 30 Maori men who died aged 45-64 years and had lived in moderately deprived small areas of New Zealand were linked to a census record, each of the 20 linked records received a weight of 1.5 (30/20). All analyses presented in this report use these weights, and they have been shown to satisfactorily adjust for linkage bias.27
We equivalised household income from the census for the number of adults and children using an index specific to New Zealand,28 then further adjusted for inflation using the consumer price index (base year 1996). Table 1 shows the distribution of person years and weighted deaths by approximate thirds of income.⇓ These thirds were constant across cohorts, with cut points of $NZ26 109 and $NZ43 016, and were used for calculation of all standardised rates. We also used five categories of income (approximate fifths) to calculate more sophisticated measures of inequality (see below).
Person years and numbers of deaths (weighted) for all ages (1-74 years) combined*
Analyses and measures of association
When overall mortality rates are falling, absolute differences in rates between two income groups can decrease over time, while relative inequalities increase. For example, a change over time in the rate in low income groups from 500 to 300 per 100 000, compared with a change in high income rates from 300 to 150 per 100 000, results in decreasing absolute inequalities (rate difference of 200 per 100 000 reduces to 150 per 100 000) but increasing relative inequalities (rate ratio increases from 1.6 to 2.0). In this scenario of decreasing average rates over time, there could be four types of trend in inequalities: both increasing relative and absolute inequalities; increasing relative inequalities, but stable absolute inequalities; stable relative inequalities, but decreasing relative inequalities; and both decreasing relative and absolute inequalities.29 Therefore, it is important to present trends in mortality rates, rate differences, and rate ratios.30
We calculated rates standardised for age and ethnicity, rate differences, and rate ratios using the three level income variable and using a matrix of the age distribution from WHO’s world population and the ethnic distribution of New Zealand at the 2001 census (14.1% Maori, 5.2% Pacific, 80.7% other) as the standard population. Ethnicity is a major determinant of both income and mortality and varies in its distribution over time, making it a confounder of associations between income and mortality.
In addition to standardised rate differences and standardised rate ratios, we calculated the slope index of inequality (SII) and relative index of inequality (RII).30 31 These analyses used five groups of income, formed by using fixed income cut points to approximate fifths on average over time, but with the proportion of the population in each group varying over time because of changes in income distribution. There are two important advantages in using SIIs and RIIs in addition to standardised rate differences and standardised rate ratios. Firstly, they incorporate changes in the sizes of the income groups over time by regressing rates on the mid-point of each group’s rank on a scale for 0 to 1 (that is, ridit score). Because New Zealand’s income distribution widened over the 1980s and 1990s, income mortality gradients will probably have increased more when measured with the SII than the standardised rate difference or with the RII than the standardised rate ratio. Put another way, the SII and RII capture the impact of changing income distribution as well as any changing disparities in mortality by actual unit of income. Secondly, they are regression based measures that make use of mortality rate estimates for all five income groups, rather than just comparing extreme groups.
We conducted comparisons over time by comparing mortality rates, standardised rate differences, standardised rate ratios, SIIs, and RIIs over the five census cohorts, looking for patterns but also considering 95% confidence intervals and P values for statistical tests of linear trend. We used the natural logarithm of the standardised rate ratios and RIIs in tests of trend. To examine the contribution of causes of death to total mortality inequalities, we broke down the total SII into its contributions from each cause of death.
All analyses were conducted in SAS.
Results
We have presented key results here, with full results available in tables A-D on bmj.com. We had data on age, sex, and ethnicity for all subjects, but household income data were missing for 14.2-19.3% of the eligible person years by sex across the five cohorts.
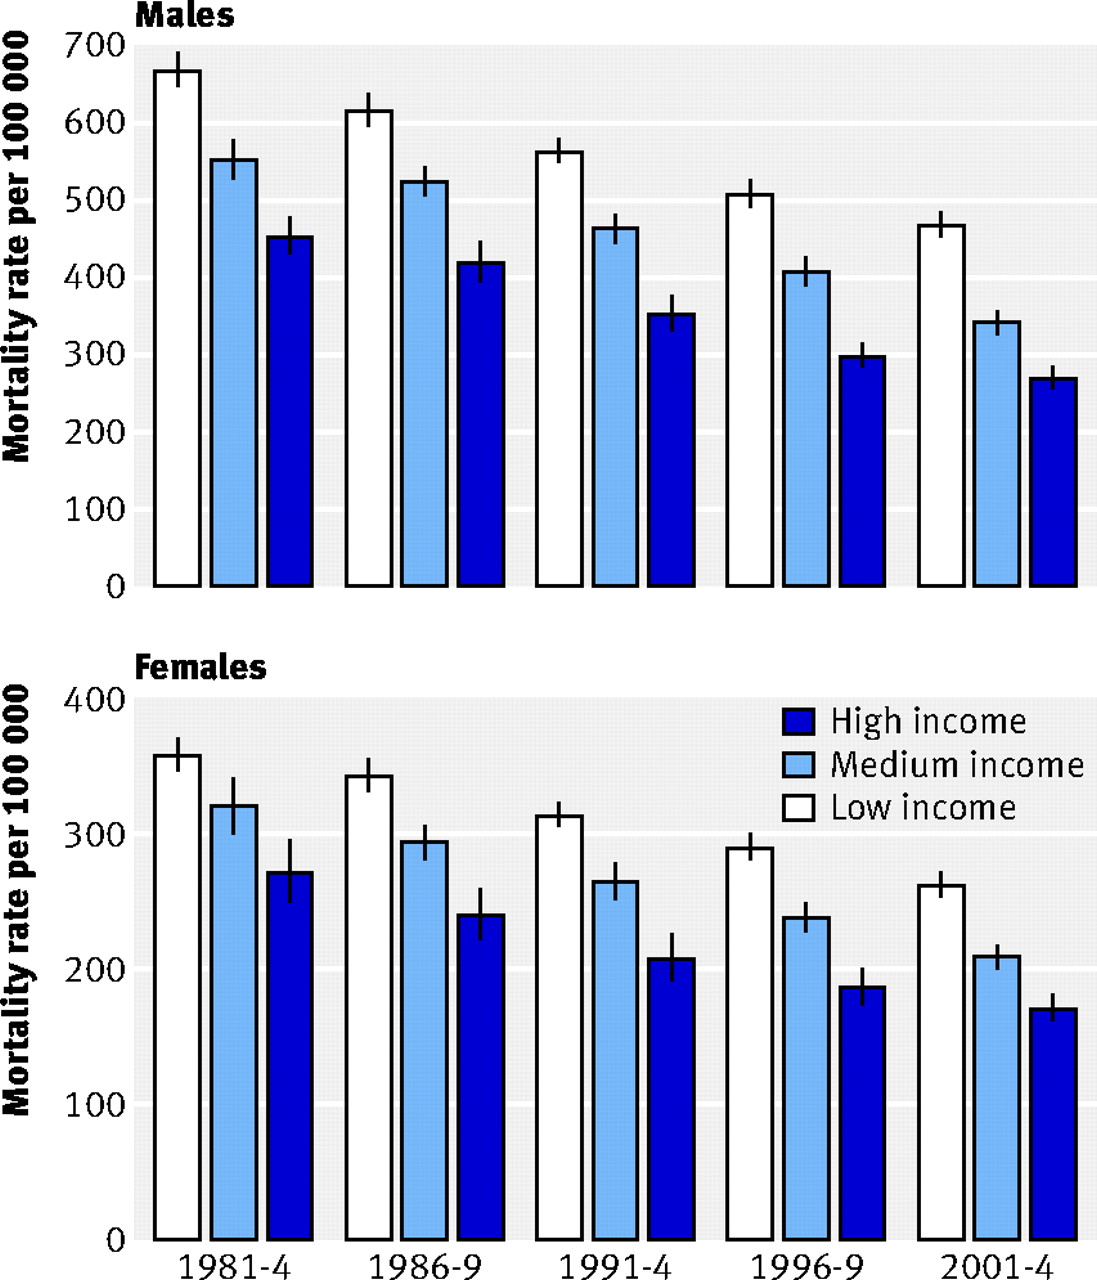
Figure 1⇓ shows that all cause mortality (standardised for age and ethnicity) declined similarly in absolute terms for all three income groups over the 25 year study period. In relative terms, however, rates fell by a greater percentage in the high income groups (41% and 37% for males and females; tables A and B on bmj.com) than in the low income groups (30% and 27%). Accordingly, absolute measures of the disparity between income and mortality (standardised rate differences and SIIs) were similar over time (pooling ages), but the standardised rate ratios and RIIs increased (table 2)⇓.

Fig 1 All cause mortality rates (per 100 000) by three income groups by period for all ages (1-74 years) combined. Rates and 95% confidence intervals are presented in tables A and B on bmj.com. Error bars are 95% confidence intervals
Inequalities in all cause mortality by equivalised household income, by age group (years), with 95% confidence intervals and P values for trend*
Closer examination of trends in disparities in all cause mortality showed two additional patterns. Firstly, there was evidence among both males and females of a possible decrease in absolute inequalities (standardised rate differences and SII) and stabilisation in relative inequalities (standardised rate ratios and RII), for the most recent period—that is, from 1996-9 to 2001-4 (fig 2)⇓. For example, the RII for males increased from 1.85 in 1981-4 to 2.54 in 1996-9 but changed little to 2.60 in 2001-4; the RII for females increased from 1.54 to 2.12 in 1996-9, but changed little to 2.18 in 2001-4. Secondly, the RII increased from 1981-4 to 2001-4 by 88% and 119% for males and females, respectively (for example, 88% for males (2.60−1.85)/(1.85−1)×100%), compared with increases in the standardised rate ratio of “only” 60% and 69%, respectively. This greater increase in the RII than the standardised rate ratio is expected as the RII also incorporates the widening that occurred in the underlying income distribution over the study period.

Fig 2 Trends in absolute (slope index of inequality (SII)) and relative (relative index of inequality (RII)) inequalities in all cause mortality by income for all ages (1-74 years) combined. Error bars are 95% confidence intervals
There were variations in trends by age group (fig 3)⇓. Among young adults (25-44 years) mortality rates fell by only 6% for men and 11% for women in the low income group compared with falls of 34% and 45%, respectively, in the high income group (see tables A and B on bmj.com). Accordingly, both absolute and (especially) relative inequalities increased substantially over time in this age group (table 2).⇑ By contrast, among older men (65-74 years) the percentage falls in mortality rates were similar across income groups, so absolute inequalities decreased (that is, standardised rate differences and SIIs in table 2) and relative inequalities remained stable over time. Remaining adult age groups (that is, men aged 45-64 and women aged 45-74) showed patterns consistent with the overall pattern of stable absolute but increasing relative inequalities over time. Finally, among 1-14 and 15-24 year olds, the patterns were unstable because of statistical imprecision, but mortality rates were usually higher among the low income group. There was a significant emergence of an income-mortality gradient over time among 15-24 year old young men, measured in both absolute and relative terms.

Fig 3 All cause mortality rates (per 100 000) by three income groups by period and age group. Rates and 95% confidence intervals are presented in tables A and B on bmj.com
As shown in table 2, among middle aged and older adults absolute disparities (that is, SIIs) seemed to narrow from 1996-9 to 2001-4, and relative disparities (that is, RIIs) tended to stabilise over this most recent period. Considered individually, none of these apparent changes in trajectory are significant at conventional levels, but the pattern is similar across each of the four sex by age groups (that is, men and women aged 45-64 and 65-74), suggesting that chance is an unlikely explanation.
Important variations exist in trends in cause specific mortality by income (fig 4⇓, table 3,⇓ and table C on bmj.com). Cardiovascular mortality rates fell by 52-61% across sexes and income groups (standardised for age and ethnicity), with corresponding increases in relative inequality but falls in absolute inequality (table 3).⇓ Mortality from lung cancer in men fell in all income groups, but among women this rate initially increased then fell among the low income group, while remaining stable over the whole study period in the medium income group, and falling continuously in the high income group. There was less change over time in mortality for other cancers. There were marked disparities in mortality from chronic lung disease at all points in time and falls over time in mortality from this cause in all income groups among men but not women. Rates of unintentional injury tended to fall in all income groups, with moderate and persistent disparities (increasing in relative terms for males). Suicide rates by income group were unstable over time for females, but increased over time in all income groups for males up to 1996-9 (more so for the low income group), then fell for all income groups from 1996-9 to 2001-4.

Fig 4 Cause specific mortality rates (per 100 000) by three income groups by period for all ages (1-74 years). Rates and 95% confidence intervals are presented in table C on bmj.com
Inequalities in cause specific mortality by equivalised household income, by cause of death (ages 1-74 years combined), with 95% confidence intervals and P values for trend*
Figure 5⇓ shows the SII for all cause mortality by sex and period (ages pooled), decomposed by cause of death. The total height of the bars for each sex by period equates to the all-cause mortality SIIs in table 2; the height of the coloured components for each cause of death equate to the cause-specific SIIs in table 3. Cardiovascular disease was the major contributor to the SII (ages pooled) at all times, but its contribution decreased over time: from 45% in 1981-4 to 33% in 2001-4 for males, and from 50% to 29% for females (table D on bmj.com). Conversely, the contribution of cancer increased from 16% to 22% for males and from 12% to 25% for females (pooling age groups). However, the contribution of cancer did not increase further from 1996-9 to 2001-4, contrary to our a priori expectation. Chronic lung disease contributed approximately 10% to the SII at each period (pooling ages). “Other” causes of death consistently explained about a quarter of the total absolute disparity (pooling ages) for both sexes, however no single disease stood out upon further disaggregating this cause category.

Fig 5 Contribution of causes of death to SII for all ages (1-74 years) combined. Total height of bars is all cause mortality SII shown in table 2. Height of each component is cause specific SII shown in table 3. Contribution of suicide for females in 1981-4 is shown below 0 as suicide rates were slightly greater among people on high income. Percentage contribution of each cause of death is shown in table D on bmj.com
Figure 6 shows the contribution of different causes of death to the SII for three adult age groups (25-44, 45-64, and 65-74 years).⇓ While the estimates become somewhat unstable when disaggregated by age, suicide and unintentional injury clearly make the major contribution to inequalities in mortality among young adults (ages 25-44). Furthermore, the contributions of both suicide and unintentional injury increase over time, and explain much of the increase in SII over time in this age group, especially for men. Among older people (ages 65-74) the decreasing contribution of cardiovascular disease was offset by an increasing contribution of cancer in women, resulting in a stable SII over time, but not so in men, for whom the total SII decreased over time.

Fig 6 Contribution of causes of death to SII for 25-44, 45-64 and 65-74 year olds. Graphs for children and youths could not be shown because of insufficient numbers of deaths in high income groups. Components to left of 0 depict those instances where rates were higher in high income people, thus making an “offset” contribution to the total SII
Discussion
During the 1980s and 1990s, disparities in mortality by income in New Zealand were stable in absolute terms, but increased in relative terms, after adjustment for changes in the age and ethnic distribution of the population. This finding is consistent with an expectation that in times of increasing social inequality and poverty, health inequalities will increase, in relative terms at least. From 1996-9 to 2001-4, however, this trend seems to have ceased, with relative inequalities stabilising and absolute inequalities narrowing (at least for adults aged 45 years and over). It is tempting to conclude that a partial reversal of neoliberal policies since the mid to late 1990s in New Zealand has been responsible for this turning point in health inequality. For example, one can point to an increasingly redistributive income tax structure, the introduction of welfare policies (including better access to social housing and more generous social assistance regimens), and reduced financial costs for primary health care since 1999. On the other hand, improved macroeconomic performance and especially excellent labour market performance leading to low levels of unemployment and underemployment in recent years provides an alternative, or additional, explanation.
While there is some evidence from the ex-Soviet countries that population mortality rates and disparities in these rates can respond rapidly to macroeconomic change, there is also evidence to the contrary from other countries. The importance of social and healthcare services has also been argued as an offset against, or modifier of, any association between income distribution and health inequalites.32 Furthermore, relative inequalities in mortality have tended to increase in most of the established market economies over the past two or three decades, irrespective of the level of macroeconomic performance.21 22
Re-examining our findings in this light, it is interesting to note the strong and relentless decrease in mortality from cardiovascular disease for all income groups throughout this period, most probably reflecting both reduction in exposure to risk factors (that is, decreasing incidence) and improvement in access to and effectiveness of clinical treatment (that is, increasing survival).33 34 Changing social conditions may influence the trajectory of this secular decline in mortality from cardiovascular disease, especially among more recent birth cohorts. Distal social and economic factors may modify the rate of secular changes in proximal risk factors (such as smoking and diet) and access to treatments (such as cholesterol lowering medications), perhaps differentially by socioeconomic position. It is clear, however, that social and economic factors are not the only or even main determinant of trends in mortality. Trends in cancer mortality in New Zealand were less dramatic and will be prone to longer lag times (between social exposure and incidence of cancer), but it is interesting to note the gradual widening of inequalities in mortality from this condition. Again, this most probably reflects differential trends by socioeconomic position in exposures to risk factors and in access to high quality clinical treatment. How these differential trends are influenced (or modified) by wider societal and economic factors, and with what time lags, is a moot point.
We have shown that cardiovascular disease is a major driver of trends in income-mortality gradients in New Zealand, albeit of decreasing importance over time (figs 5 and 6). Profound decreases in mortality from coronary heart disease and stroke in all income groups mean that, unless relative inequalities become high, absolute inequalities must decline and consequently the contribution of cardiovascular disease to the total mortality gap must, at some point, also decline. This seems to be happening for men aged 65-74 (fig 6 and table 3). There is also some evidence, albeit statistically imprecise, that social class gaps in mortality from ischaemic heart disease in 35-64 year old men in England and Wales have narrowed from 1993-6 to 1997-9.35 It remains to be seen whether the obesity epidemic might cause mortality rates from cardiovascular disease to increase again,36 and more so among lower socioeconomic groups.
We have previously found that cancer was making an increasing contribution to income-mortality disparities,25 and hypothesised that its contribution would further increase in 2001-4. We did not, however, find an increase in the most recent period. One possible explanation for this is differential timing of the tobacco epidemic between social groups. The greater relative disparities shown for lung cancer than for other cancers point to the importance of tobacco smoking in driving income-cancer mortality gradients. Elsewhere we have reported that tobacco’s contribution to mortality disparities by education increased from 1981-4 to 1996-9,37 but the smoking question was not included in the 2001 census (although it is included in the 2006 census) so we cannot yet update this estimate.
An important and concerning finding is the widening income-mortality disparity among young adults (25-44 years), a consequence of little if any improvement in mortality rates among the low income group. Suicide and unintentional injury made substantial contributions to widening inequality between income and mortality in this age group—both causes with plausibly short time lags from social exposure to outcome. This finding suggests that underprivileged young adults are being left behind in New Zealand society and identifies an issue requiring urgent research and policy attention.
Limitations
We could not completely link all eligible mortality records to census records, though we believe the weights used in our analyses remove resultant linkage bias.27 Not all census respondents had a valid household income; again, sensitivity analyses published elsewhere suggest little resultant selection bias.38 Income is susceptible to reverse causation (that is, poor health before death causing reduced income). We do not, however, believe reverse causation to be a major source of bias: income is measured at the household level for the year preceding census night, up to three years before death; and sensitivity analyses published elsewhere showed that reverse causation could not have substantively influenced income mortality inequalities, at least for one of the census cohorts.39 Furthermore, any bias because of reverse causation should be similar in magnitude across the five census cohorts. Despite being a full population study, statistical power was still insufficient to detect small changes in trends in inequalities. We observed similar patterns across several age groups, which provides some reassurance that the interesting change in direction of trend identified between 1996-9 and 2001-4 is probably not caused by chance. Finally, it is difficult to infer a causal link between structural or macroeconomic reform and trends in health inequalities in an observational study. Our results should be interpreted as providing one additional piece of evidence for such a causal link, albeit one with great statistical power in that it covers an entire national population throughout a period of major social change.
Conclusions
Our findings are possibly consistent with, but far from proof of, a causal association between changing social and economic conditions and changing disparities between income and mortality. Importantly, we have shown that the contribution of different diseases to the total disparity in mortality by income has changed over time. If health disparities are to continue to narrow (at least on an absolute if not a relative scale)—and indeed, if this trend is to further accelerate—health policy will need to focus increasingly on improving access to and quality of cancer prevention and treatment services for disadvantaged groups. At the same time, recent improvements in cardiovascular health need to be sustained and further strengthened, particularly for disadvantaged social groups who are differentially exposed to the growing epidemics of obesity and type 2 diabetes.
What is already known on this topic
New Zealand underwent a period of major structural and macroeconomic reform in the 1980s and 1990s, resulting in increasing (followed by decreasing) poverty and unemployment rates, and widening income inequalities
What this study adds
Mortality rates fell in all income groups from 1981-4 to 2001-4
Mortality disparities by income increased in relative terms from 1981-4 to 1996-9, then stabilised to 2001-4 but in absolute terms remained stable from 1981-4 to 1996-9, then possibly decreased slightly to 2001-4
Cardiovascular disease was the major contributor to disparities but decreased in importance over time as cancer increased
There was little improvement over time in mortality rates among low income young adults (25-44 years)
Footnotes
Ken Huang and Li-Chia Yeh (Public Health Intelligence, Ministry of Health) assisted with statistical analysis. Diana Sarfati, Caroline Shaw, and Kristie Carter (University of Otago), and Jackie Fawcett (Accident Compensation Corporation) commented on the manuscript. This paper is published with the approval of the deputy director general (public health), New Zealand Ministry of Health. Opinions are the authors’ own and do not necessarily reflect ministry policy advice. Access to the data used in this study was provided by Statistics New Zealand under conditions designed to give effect to the security and confidentiality provisions of the Statistics Act 1975. The results presented in this study are the work of the authors, not Statistics New Zealand.
Contributors: TB and MT jointly conceived the paper and contributed to design, interpretation, and preparation of drafts of the paper. JA led the statistical analyses and contributed to drafting of the paper. TB is guarantor.
Funding: Health Research Council of New Zealand and Ministry of Health.
Competing interests: None declared.
Ethical approval: Wellington regional ethics committee.
Provenance and peer review: Not commissioned; externally peer reviewed.