Article Text

Abstract
Background Inequalities over the life course may increase due to accumulation of disadvantage or may decrease because ageing can work as a leveller. We report how absolute and relative socioeconomic inequalities in musculoskeletal pain, oral health and psychological distress evolve with ageing.
Methods Data were combined from two nationally representative Swedish panel studies: the Swedish Level-of-Living Survey and the Swedish Panel Study of Living Conditions of the Oldest Old. Individuals were followed up to 43 years in six waves (1968, 1974, 1981, 1991/1992, 2000/2002, 2010/2011) from five cohorts: 1906–1915 (n=899), 1925–1934 (n=906), 1944–1953 (n=1154), 1957–1966 (n=923) and 1970–1981 (n=1199). The participants were 15–62 years at baseline. Three self-reported outcomes were measured as dichotomous variables: teeth not in good conditions, psychological distress and musculoskeletal pain. The fixed-income groups were: (A) never poor and (B) poor at least once in life. The relationship between ageing and the outcomes was smoothed with locally weighted ordinary least squares, and the relative and absolute gaps were calculated with Poisson regression using generalised estimating equations.
Results All outcomes were associated with ageing, birth cohort, sex and being poor at least once in live. Absolute inequalities increased up to the age of 45–64 years, and then they decreased. Relative inequalities were large already in individuals aged 15–25 years, showing a declining trend over the life course. Selective mortality did not change the results. The socioeconomic gap was larger for current poverty than for being poor at least once in life.
Conclusion Inequalities persist into very old age, though they are more salient in midlife for all three outcomes observed.
- chronic di
- cohort studies
- gerontology
- health inequalities
- life course eidemiology
This is an Open Access article distributed in accordance with the Creative Commons Attribution Non Commercial (CC BY-NC 4.0) license, which permits others to distribute, remix, adapt, build upon this work non-commercially, and license their derivative works on different terms, provided the original work is properly cited and the use is non-commercial. See: http://creativecommons.org/licenses/by-nc/4.0/
Statistics from Altmetric.com
Introduction
Despite improvements in health and life expectancy, inequalities prevail. A large and increasing relative inequality in mortality among most European countries has recently been reported.1 Furthermore, such inequalities also seem to persist into old age.2–4 Knowing how and why inequalities evolve over the life course can help in guiding public policies to decrease them.
There is seemingly conflicting evidence on how the socioeconomic gap varies over the life course. The gap may evolve differently when comparing mortality and morbidity indicators. Most mortality studies have shown either decreasing or stable inequalities across the lifespan.5–9 Age-as-leveller has been considered an explanation for converging inequalities, for example, welfare programmes and social policies may reduce the gap in older ages because they decrease the impact of social stratification8; alternatively, after retirement, social stratification becomes less relevant, as biological factors take over social determinants. Furthermore, persons in lower socioeconomic positions tend to die at younger ages thereby creating a healthier remaining population, that is, selective mortality, leading to inequality convergence.10 It should be noted that, in some studies,7 11–13 selective mortality has not been found to affect inequality. Cumulative inequality theory suggests that inequalities increase over the life course due to an accumulation of risk factors.10 14 15 However, studies on morbidity have reported a mixed pattern; some have presented a widening in the socioeconomic gap by age,16–18 while many others have shown a decline.12 19–23 Moreover, some have also described an inverse U-shaped pattern of increasing inequalities up to around middle age and decreasing inequalities in old age.11 13 24
Many studies used cross-sectional data or had a short follow-up, making it impossible to disentangle ageing processes from specific cohort or period effects. In addition, due to data constraints, very few were able to cover the full spectrum from early age to very old age. We used Swedish panel data in which older cohorts were followed up to 43 years, that is, from 1968 to 2011, focusing on morbidity, and studied inequalities in three different health outcomes that have consistently been associated with socioeconomic conditions through different biological pathways: oral health (represented by the number of remaining teeth),25 chronic musculoskeletal pain26 27 and psychological distress.22 While pain and distress can increase and decrease over time, the number of remaining teeth is cumulative and can be expected to express accumulated disadvantage.
A further complication is that we may have a different answer depending on the measurement of inequality. While some studies report decreasing inequalities in absolute and relative terms,2 22 other show increase in absolute inequalities.6 Not least, we can learn from recent comparative mortality research that conclusions about inequality trends are substantively different if we base them on measures of relative or absolute inequalities.1 28 People’s socioeconomic position may also change over the life course and we may use our socioeconomic indicator as either fixed (ie, baseline measurement) or time-varying groups (ie, current position at each wave). To our knowledge, only two studies, with conflicting results, have been published on this issue.13 29
Therefore, the objectives of this study were fourfold: (1) to describe inequalities in three different indicators of morbidity with ageing, (2) to evaluate the effect of selective mortality on the size of these inequalities, (3) to evaluate the differences between a fixed and a time-varying socioeconomic indicator and (4) to compare relative and absolute inequalities.
Methods
Data sources and design
We used data from two individually linked panel studies, the Swedish Level of Living Survey30 (LNU) and Swedish Panel Study of Living Conditions of the Oldest Old31 (SWEOLD), based on a nationally representative sample of the Swedish population. The first wave was conducted in 1968 with follow-up surveys in 1974, 1981, 1991 (SWEOLD in 1992), 2000 (SWEOLD in 2002) and 2010 (SWEOLD in 2011). LNU included individuals from 15 to 75 years of age (the lower age was increased to 18 years in 1991); when they reached the age limit, individuals were invited to continue in SWEOLD.
We use five birth cohorts: 1906–1915 (n=1050), 1925–1934 (n=989), 1944–1953 (n=1235), 1957–1966 (n=1042) and 1970–1981 (n=1199). Individuals were included in the analysis if they participated in the first wave of 1968, or 1981 and 2000 for the two youngest cohorts, with at least one subsequent follow-up. In this way, individuals could be followed up to 43 years. Data on mortality were obtained from the Swedish Cause of Death Register.
Outcome measures
All three outcomes were self-reported. Oral health was obtained from the following question: ‘Which of the following alternatives best describes the condition of your teeth?’ The five response alternatives were: 1: no teeth or mere remains; 2: dentures, whole or part; 3: own teeth but in bad condition, many missing; 4: own teeth but many fillings or bridgework; and 5: own teeth in good condition, no or few fillings. We dichotomised the answers to present the percentage of people with teeth in good condition, stemming from score 5 as described elsewhere.32
Psychological distress and musculoskeletal pain were composite measures. They were dichotomised in accordance with earlier research.30 Musculoskeletal pain was assessed based on three questions, namely ‘Have you in the last 12 months had…a) pain in the shoulders or shoulder blades, b) pain in the back, hips or sciatica and/or c) pain in the hands, elbows, legs or knees?’. Psychological distress was assessed based on six questions, namely ‘Have you in the last 12 months suffered from…a) general tiredness, b) insomnia, c) overexertion, d) mental illness, e) depressions or deep dejection and/or f) nervous trouble (anxiety, uneasiness, anguish)?’. The possible answers were ordered as: ‘no’ summing zero points, ‘yes, mild’ summing 1 point and ‘yes, severe’ summing 3 points, then the scores were dichotomised; three or more points counted as having severe psychological distress or musculoskeletal pain.30
Socioeconomic measure
Our socioeconomic exposure was a simple measure of financial hardship, labelled lack of cash margin, which could be seen as a direct poverty indicator. It is based on the following question: ‘If a situation suddenly arose where you had to come up with SEK, could you manage it? Yes/No’. The amount of Swedish crowns (Kr) has been adjusted for inflation since the first wave in 1968. In 1968, the amount was Kr 2000, and in 2010, it was Kr 14 000 (US$1950 or €1450). We label this variable poverty since it clearly relates to resource deficits in line with Townsend’s classical definition of relative poverty. Poverty in the life course was defined such that those who reported being able to afford enough cash in all waves were considered ‘never poor’, while those who said ‘yes’ at least once in any survey year were consider ‘at least once poor’. Cumulative poverty, a variation to this variable, was tested but some models failed to converge and results were similar (online supplementa ry tables S2 and S3). In all five cohorts, the percentage of people referred to as ‘never poor’ varied by about 45%–55%.
Supplementary file 1
Age, period and cohort
We modelled age as a categorical variable (dummies) of 10-year intervals, starting with 15–25 years of age. As there was evidence of a cohort effect in all outcomes (online supplementary figure S1, S2 and S3), we included a variable indicating each of the five cohorts described previously. This accounted for differences among individuals of the same age who were born in different cohorts. After taking age and cohort, it is not possible to include period effects in the same scale (yearly); any other attempt would likely take the ageing effect away. We only identified one period effect in 2010 affecting the three young cohorts (1970–1981, 1957–1966 and 1944–1953) based on the graphical analysis (see online supplementary figures S2 and S3).
Supplementary file 2
Selective mortality analysis and non-participation
Individuals who died before 2011 were identified. Two sensitivity analyses were carried out: (A) imputing the last reported health status for subsequent follow-ups and (B) imputing the worst health status for subsequent follow-ups. The cohorts born in 1906–1915 and 1925–1934 had in the end, respectively, 97% and 41% of non-participation due to death. No imputation was done for non-participants who were alive. We tested if our outcomes were associated with mortality using a Cox regression.
Statistical analysis
To explore the shape of the relation between age (continuous variable) and the three outcomes (binary variables), we used tricube weighting function with running means with locally weighted ordinary least squares regression and logit function for binary outcomes. The graphs were then visually analysed to determine the best smoothing parameter (bandwidth of 5%, 15% and 30%) to remove roughness and make the shape clear.
Generalised estimating equations were used to account for repeated measures of the same individual in different survey years. We included an autoregressive correlation matrix of first order. Relative differences were estimated using Poisson distribution (family) with log-link, producing prevalence/percentage ratios. Absolute differences were estimated using binomial distribution (family) with identity link, producing differences in percentage point. Multiple regressions included cohort, period, sex and an interaction term between age and poverty at least once in life. All analyses were carried out in Stata V.13.1.
Results
Including individuals in all five cohorts of LNU, we identified 5515 persons. However, analyses were carried out with 4487 (81.4%), summing 16 983 observations over the complete follow-up period, because some had not participated in the baseline or participated only in the baseline (supplementary table S1). The survey year of 2010/2011 had the lowest participation rate, with 1275 individuals (28.5%) already dead and 701 (15.6%) non-participants alive. Due to inclusion criteria, the youngest cohort (1970–1981) had 100% of follow-up. Missing values for specific variables were less than 1% of participants over the survey years.
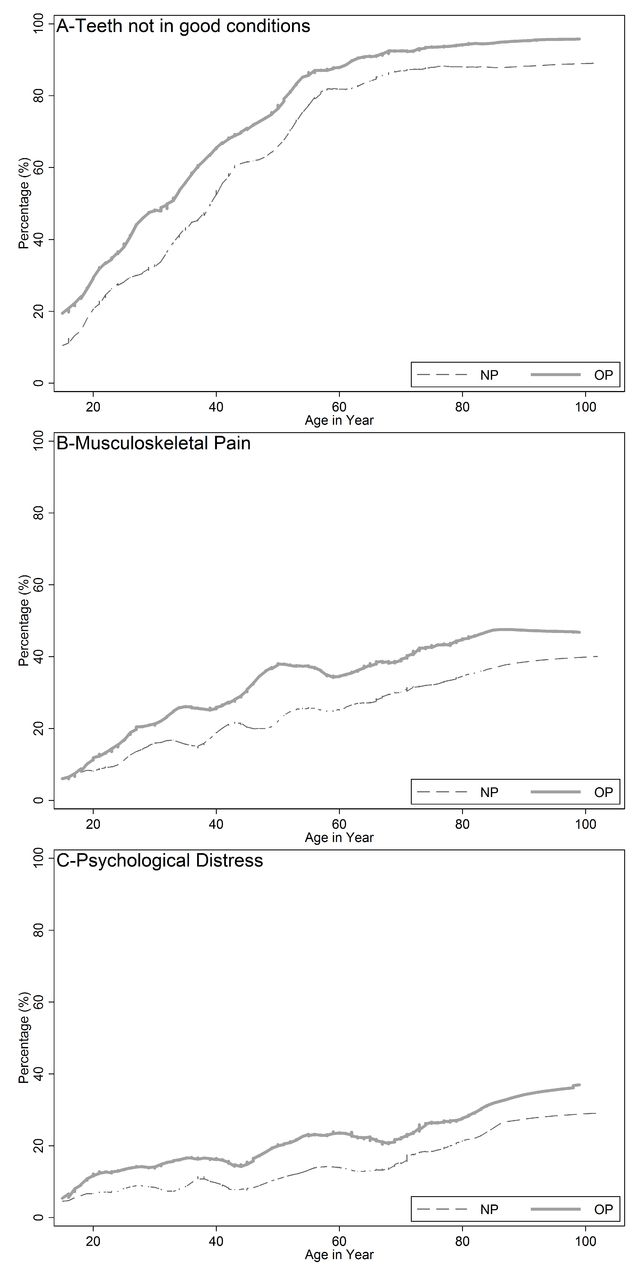
We observed ageing effects with an increasing probability of reporting a worse situation for all outcomes. Graphical analysis showed a continuous socioeconomic gap from early age until late life (figure 1). In table 1, we focus on the relative dimension of inequality (prevalence ratio), having those never poor/not poor as reference in each age bracket. Already at the age of 15–24 years, poorer individuals were more likely to report worst health outcomes. In younger age groups (<45 years), we found the peak of relative inequality in teeth not in good conditions and psychological distress, while inequalities increased until middle adulthood for musculoskeletal pain. The magnitude of relative inequalities declined with ageing, roughly in all outcomes, but it was significant (P<0.01) only for teeth not in good conditions.

Prevalence in (A) teeth not in good conditions, (B) musculoskeletal pain and (C) psychological distress with ageing (pooled from five cohorts) according to fixed socioeconomic groups (NP=never poor, OP=at least once poor) in Sweden.
In table 2, we focus on our absolute measure of inequality—the prevalence difference. Here, we find an increase of inequality with peaks around middle adulthood (45–64 years) for psychological distress and musculoskeletal pain. This pattern was clearer when using the current poverty indicator (poor vs not poor), and differences in the magnitude of inequalities among age groups were significant (P<0.05). We did not test for trends, as there was a clear non-linear relationship.
Prevalence ratio (PR and 95% CIs) between poor and not poor in two fixed and time-varying indicators for three health outcomes according to age and socioeconomic group in five Swedish cohorts from 1968 to 2011
Prevalence differences (PD and 95% CIs) between poor and not poor in two fixed and time-varying indicators for three health outcomes according to age and socioeconomic group in five Swedish cohorts from 1968 to 2011
Using current poverty indicated larger gaps for distress and pain but not for oral health (figures 1 and 2). In multiple regression analyses, current poverty presented similar conclusions to poverty in the life course after adjusting for sex, birth cohort and period effect.

Prevalence in (A) teeth not in good conditions, (B) musculoskeletal pain and (C) psychological distress with ageing (pooled from five cohorts) according to time varying socioeconomic groups in each survey year (NP=not poor, OP=currently poor) in Sweden.
Relative versus absolute measures
Relative and absolute differences showed different results across the life course. While relative inequalities peaked earlier in life and then decreased over the age categories for two outcomes (table 1), absolute inequalities showed an increase up to middle adulthood 45–64 years, then declined but only marginally (table 2). Still, in the age group 75–85 years, the absolute differences in percentage points were 2.8 (teeth), 10.7 (distress) and 12.7 (pain).
Mortality selection effects
In addition to the ordinary analysis (complete case analysis), we imputed data on our three outcomes after the year of death, so they would continue in the analysis up to 2010–2011. Considering complete case analysis (strategy 1) and imputing the last health status (strategy 2), results did not change concerning inequalities over age (comparing figures 1 and 3). We also imputed the worst health condition for those already dead (strategy 3), and for this strategy the gap closed completely, as prevalence peaked almost 100%, at very old age.

Prevalence in (A) teeth not in good conditions, (B) musculoskeletal pain and (C) psychological distress with ageing (pooled from five cohorts) according to fixed socioeconomic groups (NP=never poor, OP=at least once poor) in Sweden, including deaths as last health condition reported.
To explore the mortality effect on inequalities, we performed a Cox regression using all deaths up 2010/2011 as an outcome. To avoid collinearity with age, the time of follow-up was set to start when individuals entered the study. Results showed that being poor at least once had an increased hazard of death (HR=3.85, 95% CI 1.65 to 9.03) and age (in years) had an HR=1.11 (95% CI 1.10 to 1.12), and the interaction between them showed a decreasing effect of poverty with increasing age (interaction HR=0.98 for each year of ageing, 95% CI 0.97 to 0.99). All morbidity outcomes were not statistically associated with the hazard of dying after adjusting for age at baseline and being poor; reporting teeth to not be in good condition showed an HR=1.00 (95% CI 0.83 to 1.20), psychological distress an HR=0.88 (95% CI 0.76 to 1.02) and musculoskeletal pain an HR=0.92 (95% CI: 0.81 to 1.04). Similar results were found when using the time-varying poverty indicator, although current poverty (time-varying indicator) has a stronger association with mortality (HR=6.25, 95% CI 1.85 to 21.01).
Discussion
In this study, we found that inequalities in three distinct outcomes provided robust support for declining relative inequalities in later life, yet with an increase in absolute inequalities until middle age with reduction after that. The absolute socioeconomic gap still prevails in late life and is substantial among living individuals above 75 years of age for all three outcomes. While relative inequalities support age-as-leveller theory, absolute inequalities provide a more complex picture. Up to middle age (45–64 years), cumulative disadvantage expresses its effect, but at older age, factors related to ageing start working in the opposite direction and partially reducing the socioeconomic gap.
Our fixed indicator of poverty in the life course had a somewhat weaker association than current poverty (time-varying indicator). Although this weaker association with the fixed indicator contradicts a previous finding,13 other studies have also shown that current income tends to give stronger associations with health in old age than past or long-standing measures (education and first occupation).33 Because we also defined poverty as any episode over the life course, disease may have occurred before a poverty event for the life course poverty, bringing temporal relation into debate. We argue that individuals reporting poverty at least once in life were likely to be near poor in previous years, and so poverty could have occurred before the outcome. Indeed, there is evidence that changes in income for short periods may not be as important to health as ‘average income’ over the life course.34 Although a time-varying income measure may match the timing of the outcome better, the fixed indicator created fixed well-balanced group over time.
Confirming previous studies, there was a clear improvement in oral health due to cohort effect32 35 with reducing inequalities in younger cohorts.32 36 On the contrary, younger cohorts reported higher levels of musculoskeletal pain and psychological distress. Increases in pain and psychological distress for younger cohorts have been reported before,37 38 even using slightly different measures.
In our study, the measurement of inequalities, absolute or relative, led to different conclusions, as results change depending on the scale.39 From a public policy perspective, one can make a strong case for absolute measures; as long as a policy benefits all groups and thereby enhance overall health, this is more likely to lead to decreasing absolute differences while increasing relative differences.28 Moreover, a large relative inequality at low average prevalence may not be as important from a policy point of view compared with smaller relative inequality at high average prevalence. The magnitude of inequalities may be a mathematical artefact,39 because absolute inequalities cannot vary when average prevalence is very low or very high.40 In our sensitivity analysis, imputing the worst health outcome for those dead led to very high prevalence and low inequalities, confirming a mathematical relation. However, imputing the last observed outcome did not change the inequalities results, confirming the small effect of selective survival bias observed in our Cox regression analysis.
Strengths and limitations
Hitherto, to our knowledge, this study has the longest follow-up with the largest age span and with representative samples of the general population. We were also able to disentangle specific periods and cohort effects, making the results more likely to reflect the ageing process. However, we acknowledge that any period or cohort effect that appears gradually over time cannot be separated from ageing. Although we followed cohorts over unusually long periods, we cannot totally rule out that some of our results for the young and the very old are cohort specific rather than ageing. Another issue is that outcomes were self-reported and did not follow current clinical diagnostic criteria. Importantly, the measurements used in this work were introduced in 1968, and LNU and SWEOLD kept comparability over time.
Conclusions
Inequalities vary over the life course with the ageing process, and they tend to decrease in relative terms but not converge completely with very old age. However, they persist throughout life, and the size varies according to the way inequality is measured. Although relative inequalities seem to decrease with age, absolute inequalities tend to be greater in midlife, persisting roughly the same in old age.
What is already known on this subject
There is conflicting evidence as to whether health inequalities increase or decrease over the life course.
Inequalities over the life course may increase due to accumulation of disadvantage or may decrease because ageing can work as a leveller.
What this study adds
All three different illness indicators showed a similar pattern in and the socioeconomic gap prevails in old age for all of them.
We found that absolute inequalities tend to increase up to middle adulthood (45–64 years) and reduce in old age, whereas relative inequalities mainly decrease since young adulthood.
Current poverty (time-varying indicator) shows larger inequalities than a fixed indicator of poverty in the life course.
References
Footnotes
Licence for Publication The Corresponding Author has the right to grant on behalf of all authors and does grant on behalf of all authors, an exclusive licence (or non-exclusive for government employees) on a worldwide basis to the BMJ Publishing Group Ltd and its Licensees to permit this article (if accepted) to be published in Journal of Epidemiology & Community Health and any other BMJPGL products to exploit all subsidiary rights, as set out in our licence Unable to resolve custom email tag and the Corresponding Author accepts and understands that any supply made under these terms is made by BMJPGL to the Corresponding Author.
RKC and JF contributed equally.
Contributors Both authors participated in concept and design. JF participated in acquisition data and RKC in data analysis. Both authors participated in interpretation, writing the manuscript and approved the final version.
Funding This work was supported by grants from FORTE (2012:1950 and 2016-07206), NordForsk (74637) and the Swedish Foundation for International Cooperation in Research and Higher Education (STINT BR2013-5215). RKC holds PQ-2 fellowship from CNPq (BrazilianResearch Council).
Competing interests None declared.
Ethics approval Project was approved by the Ethics Institutional Review Board of the Statistics Sweden.
Provenance and peer review Not commissioned; externally peer reviewed.