Article Text

Abstract
Background Control of alcohol licensing at local government level is a key component of alcohol policy in England. There is, however, only weak evidence of any public health improvement. We used a novel natural experiment design to estimate the impact of new local alcohol licensing policies on hospital admissions and crime.
Methods We used Home Office licensing data (2007–2012) to identify (1) interventions: local areas where both a cumulative impact zone and increased licensing enforcement were introduced in 2011; and (2) controls: local areas with neither. Outcomes were 2009–2015 alcohol-related hospital admissions, violent and sexual crimes, and antisocial behaviour. Bayesian structural time series were used to create postintervention synthetic time series (counterfactuals) based on weighted time series in control areas. Intervention effects were calculated from differences between measured and expected trends. Validation analyses were conducted using randomly selected controls.
Results 5 intervention and 86 control areas were identified. Intervention was associated with an average reduction in alcohol-related hospital admissions of 6.3% (95% credible intervals (CI) −12.8% to 0.2%) and to lesser extent with a reduced in violent crimes, especially up to 2013 (–4.6%, 95% CI −10.7% to 1.4%). There was weak evidence of an effect on sexual crimes up 2013 (–8.4%, 95% CI −21.4% to 4.6%) and insufficient evidence of an effect on antisocial behaviour as a result of a change in reporting.
Conclusion Moderate reductions in alcohol-related hospital admissions and violent and sexual crimes were associated with introduction of local alcohol licensing policies. This novel methodology holds promise for use in other natural experiments in public health.
- alcohol
- public health policy
- time-series
- methodology
This is an Open Access article distributed in accordance with the Creative Commons Attribution Non Commercial (CC BY-NC 4.0) license, which permits others to distribute, remix, adapt, build upon this work non-commercially, and license their derivative works on different terms, provided the original work is properly cited and the use is non-commercial. See: http://creativecommons.org/licenses/by-nc/4.0/
Statistics from Altmetric.com
Introduction
Aggregate levels of alcohol consumption have been associated with alcohol-related harms including a wide range of health conditions and criminal offences. There is extensive international evidence that population-level interventions aimed at reducing consumption, including price controls, regulating availability and altering the drinking context, can have a positive effect on the incidence of alcohol-related harms.1 Alcohol licensing in England is under the control of local councils, rather than national government and one of the main strategies councils can use is to restrict the spatial and/or temporal availability of alcohol.2 To that end the 2003 Licensing Act3 has, since additional guidance issued in 2005,4 revolved around four statutory licensing objectives: the prevention of crime and disorder, public safety, the prevention of public nuisance and the protection of children from harm. In addition to existing alcohol licensing policies at the level of individual premises, this legislation gave local authorities discretionary powers to develop cumulative impact policies, in which, in specific areas termed cumulative impact zones (CIZs), the usual burden of proof is reversed such that new licence applications must demonstrate that the premises will not negatively impact on the licensing objectives.5 As a consequence of the significant geographical variation in alcohol-related harm6 and the priority that addressing these harms has in the wider public health arena,5 7 8 there is considerable variation in the means and the extent to which councils use licensing policies to attempt to mitigate the health and social harms of alcohol misuse.
We previously showed that the intensity of local alcohol licensing policies, estimated using a composite measure of the presence of a CIZ and/or rejection of any new premises licensing applications in the area, was associated with beneficial effects on alcohol-related local crime rates,9 thereby directly addressing the licensing objectives, but additionally that they had a positive effect on population health through a stronger reduction in alcohol-related hospital admissions in areas with the highest intensity approach.10 However, these analyses did not seek to account for differences in uptake of CIZ and licensing policies over time or select controls in a systematic way to strengthen evidence of an effect.
A previous systematic review indicated that the impact of change in alcohol consumption on outcome is almost immediate, for many outcomes.11 Here we aim to use this to improve the inference and strength of evidence by exploiting the spatial and temporal variability in the local delivery and intensity of alcohol licensing policies across England; creating a natural experiment. This natural experiment will be analysed using Bayesian structural time series within a novel causal impact framework to enable direct comparison to counterfactual synthetic control time series describing what would have happened without the introduction of new licensing policies.
Methods
Outcome
We used data on (1) quarterly directly age-standardised (to the European standard population) alcohol-related hospital admission rates per 100 000 people from the Local Alcohol Profiles for England aggregated at principal authority geographical level for the years 2009–2015,12 and (2) quarterly data of reported violence against the person (with or without injury), sexual crimes and antisocial behaviour aggregated at the same geographical level from the UK Office of National Statistics (ONS)13 also for the years 2009–2015. The ‘narrow measure’ was used to define alcohol-related hospital admissions which consist of only those admissions for which the primary diagnosis is an alcohol-related condition or where an alcohol-related external cause is a secondary diagnosis.14 15 Alcohol-related reported violent crime and sexual crime rates were calculated, in line with methodology used by Public Health England, by multiplying the reported counts by their 37% and 13% alcohol-attributable fraction (AAF),14 respectively, and these were then divided by the corresponding area population sizes for the corresponding year obtained from ONS16 to obtain rates per 1000 people. Reported antisocial behaviour rates were similarly calculated, but without adjustment for alcohol attribution as no AAF could be identified.
Natural experiment
Data on local alcohol licensing practices for England were obtained for the years 2007–2012 from the UK Home Office.17 To set up the natural experiment, we sought to compare areas with maximum contrast in the intervention. We thus identified ‘intervention areas’ as those areas with no specified CIZ and no rejection of new licensing applications in 2007/2008, but with both implemented in 2011/2012 and thereafter (both definitions used in ref.10). Using these data we were further able to determine whether the intervention was introduced before or after mid-2011. ‘Control areas’ were then defined as those areas which had no CIZ and no recorded rejection of new licensing applications throughout the 2009–2015 time period.
We excluded areas with missing intervention information or that could not be linked because of boundary changes (n=76), areas which reported CIZ or rejection of new licensing applications in 2011/2012, but not both (n=129), and areas which had a CIZ and/or rejection of new licensing applications throughout 2009–2015, but reported no changes in this time period, and thus has no ‘intervention effect’ (n=57). Thus, of the 353 principal authorities in England, 5 were classified as intervention areas (Kingston upon Thames, Derby, Enfield, Southwark and North Tyneside), and 86 met the criteria for control areas.
Statistical methodology
Overview
We use structural time-series models (ie, state-space models for time series) combined with Bayesian spike-and-slab regression to estimate and compare the impact of the alcohol licensing policy change in the time period covered by available data in each ‘intervention area’ with the synthetic time series in which the policy had not happened; that is, its counterfactual.18 The aim was (1) to create, for each intervention area, a synthetic time series which is similar to the measured time series in the intervention area before the intervention took place by weighted average of the time series in all control areas, and then (2) to use the prior synthetic time series to predict what would have happened in the absence of the intervention (ie, the counterfactual).19 20 Under the assumption that the relationship between the intervention and synthetic time series that existed prior to the intervention remains constant post intervention, this then describes the counterfactual time series for the intervention area. By subtracting this modelled synthetic time series from the measured alcohol-related hospital admission or crime rates in the intervention area (post intervention), a semiparametric Bayesian posterior distribution for the effect of the intervention is obtained.
Creating synthetic time series
The Bayesian structural time-series method is outlined in online supplementary data and is described in detail elsewhere.21 22 It comprises an observation equation linking the observed data over time to a set of latent variables (the ‘state’) and which is linked to a transition equation which describes the evolution of the state over time. A ‘spike-and-slab prior’ is placed on the regression coefficients of all control areas included in the preintervention model.23 The framework further includes a regression component which enables the construction of a synthetic time series based on weighted combinations of the control areas.
The postintervention synthetic time series is then constructed from time series in all control areas weighted by Bayesian model averaging of marginal inclusion probabilities of each regression coefficient—obtained through the inclusion of the ‘spike-and-slab’ priors—and are computed as the proportion of Monte Carlo draws each predictor is zero during the preintervention period22 24; as described in detail in ref.21 This is subtly different from the way the weights for the synthetic control are generated in classical synthetic control estimation in that here these are integrated over the possible hyperparameter choices25 and include time-series effects.21 Finally, because we have quarterly data a seasonal component is also included with a mean of zero over the four seasons. Prior distributions for the variance are set as gamma distributions with the incremental error in the state assumed to be small.
Bayesian priors were specified as the arithmetic mean of each intervention area's alcohol-related hospital admission or crime rates in the preintervention period, and the initial value as the corresponding rate in the year 2009. The variance was specified as inverse gamma distributions with a prior of 10% of preintervention SD of each outcome for each area, with the same starting values. A seasonal component of length 4 was specified with the prior SD similarly set to 10% of the SD of the preintervention outcome. Spike-and-slab priors were set to expect that each model would be informed by 10 areas (ie, 10 non-null parameters) based on an initial trial run, and initial values for all regression coefficients set to ‘0’. The SD of the regression coefficients was also set to 10% of the SD of the preintervention outcomes, and the prior expected explained variance was set to 85% with 25 df (based on initial trial run).
The results are presented as point estimates and Bayesian 95% credible intervals (CIs) which, in contrast to frequentist confidence intervals, describe the probability that the true value lies within the interval; given the model and the data (a good discussion can be found in ref.26).
Mixing of the Markov Chain Monte Carlo (MCMC) chains was inspected visually by trace and density plots, and Raftery-Lewis diagnostic tests with default accuracy of 0.005 were used to evaluate mixing, correlation and inappropriate starting values (interpreting dependence factor (I)>5 as indicative of problems). Geweke diagnostics and Heidelberger-Welch tests were calculated to evaluate MCMC chain stability. Mean and range of one-step prediction errors were calculated and Durbin-Watson tests used to evaluate residual correlation in these.27
The Bayesian framework described above was initially developed for inferring the causal effect of market interventions such as new product launches or advertising campaigns,21 and the R package CausalImpact is available to use this methodology.25 Here, custom-made Bayesian structural time series were designed using the bsts package in R,22 which were subsequently used as inputs in the CausalImpact package. Posterior tail areas probabilities, or posterior predictive p values, are calculated and interpreted as the posterior mean of classical p values.28
Finally, estimated impacts for each intervention area were combined in one summary metric using random-effects meta-analyses assuming symmetrical SEs (note that Bayesian 95% CIs are not necessarily symmetrical).
Sensitivity and validation analyses
Two different sets of sensitivity analyses were conducted:
The original analyses were repeated, but with different Bayesian priors and starting values to evaluate the sensitivity of the models to the prior specifications. Specifically, we conducted analyses with more informative priors (prior sigma set to 1% and upper limited to 100% of sample SD, and explained variance to 90%), and less informative priors (prior sigma set to 25% of sample SD, no upper limit and explained variance to 50%).
Based on previous research on temporal trends in (alcohol-related) reported crime rates which showed an increase in reported incidence from about 2013 onwards, and which was unlikely to have been due to changes in alcohol consumption but was likely the results of changes in reporting,9 analyses were restricted to a postintervention period up to the middle of the year 2013.
Validation analyses were conducted in which the same analyses as described above were conducted, but instead of one of the identified intervention areas, synthetic time series were calculated and compared for 25 areas randomly selected from the set of control areas (where no intervention happened). A priori, the difference between the measured time series in these areas and the modelled synthetic time series should result in a summary null finding (with random variability around the null for individual areas).
Results
Inspection of trace plots indicated good mixing of the MCMC, and (partial) autocorrelation plots showed minimal autocorrelation, which was confirmed by Durbin-Watson tests of the one-step prediction errors. Up to 150 000 MCMC samples were sufficient to yield stable posterior summaries based on Heidelberger-Welsh, Geweke and Raftery-Lewis diagnostic tests. Mean absolute one-step prediction errors were minimal and ranged from 1.5% to 1.9% for hospital admissions and 0.7%–to 3.7% for the crime rates (see online supplementary tables S1a-S1d).
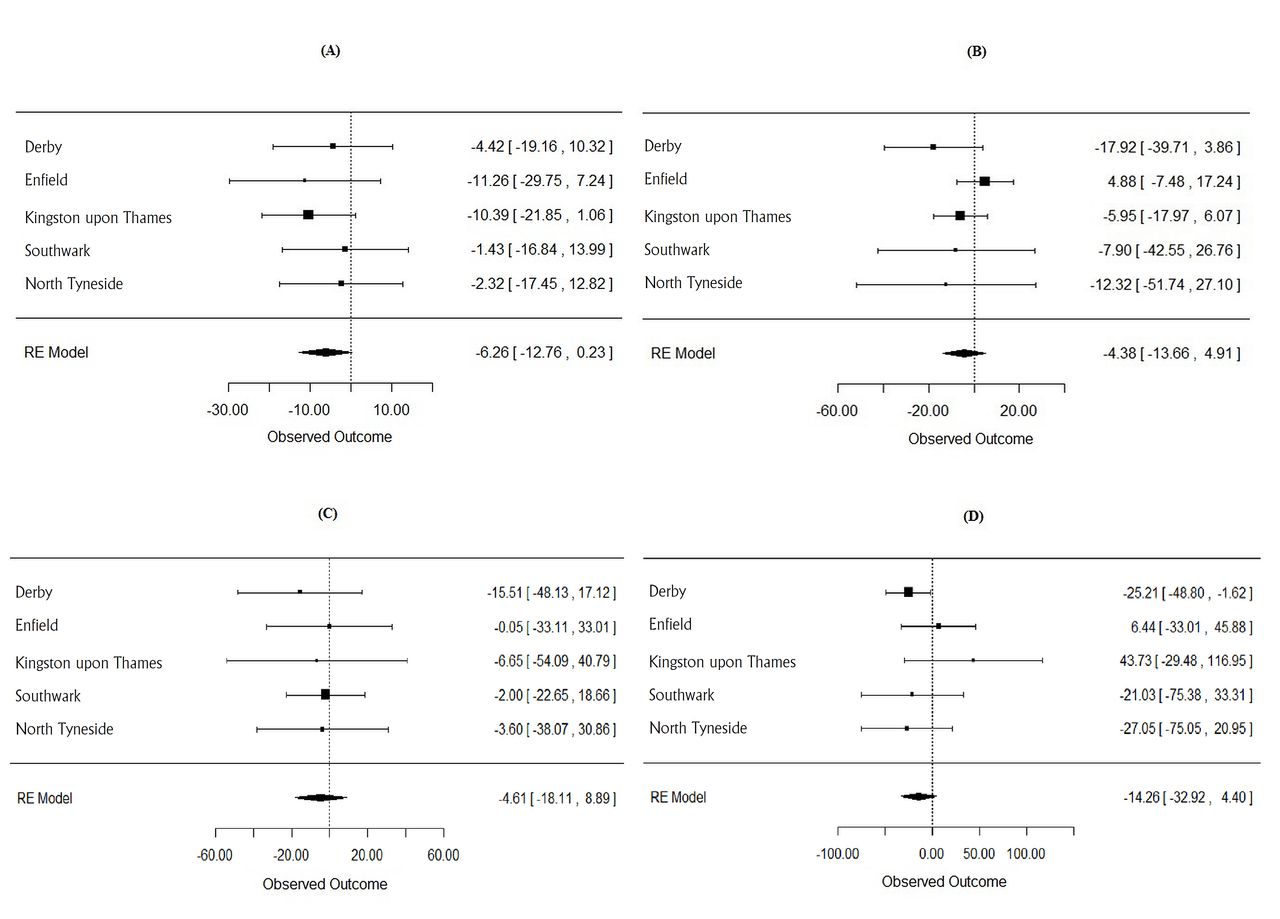
Figure 1 shows the measured and corresponding modelled posterior Bayesian time series for alcohol-related hospital admissions in each intervention area, with the corresponding results for crime rates shown in online supplementary figures S1a-S1c. The meta-analytic summary results for all outcomes are shown in figure 2 and numerically in online supplementary tables S2a-S2d, and the summary posterior results for the full and the 2013-restricted analyses are shown in table 1. The findings indicate that the introduction of the licensing policies was associated with a subsequent reduction in alcohol-related hospital admissions in all five (local) intervention areas (effect range −11.3% to −1.4%), reductions in alcohol-related violent crimes in four of five areas (range −17.9% to +4.9%), reductions in sexual crimes in all five areas (range −15.5% to −0.1%) and reductions in rates of antisocial behaviour in three of five areas (range −27.0% to +43.7%). The posterior average effect of the introduction of the licensing policies resulted in an additional 6.3% reduction in alcohol-related hospital admissions (95% Bayesian CI −12.8% to +0.2%). Comparable summary results for crime rates indicate average effect of −4.4% (95% CI −13.7% to 4.9%), −4.6% (−18.1% to 8.9%) and −14.3% (−32.9% to 4.4%) for alcohol-related violent, sexual and antisocial behaviour rates, respectively. Restricting the crime analyses to the year 2013 nearly doubles the effect of alcohol-related sexual crimes to −8.4% (−21.4% to 4.6%) and correspondingly reduces the posterior tail-area probability from 0.50 to 0.20. Sensitivity analyses with alternative sets of priors (see online supplementary tables S3a-S3d) indicate the effect sizes are relatively insensitive to the choice of priors, but that the posterior probabilities of effect does depend on the Bayesian priors, with more informative priors resulting in smaller posterior probabilities.

Measured (solid line) and modelled, synthetic (dotted line) time series and 95% credible intervals (grey areas) in the areas where the new policies were introduced; example standardised alcohol-related hospital admission rates (other outcomes in online supplementary figures S1-3).
Overview of random-effects (RE) meta-analysis summary result of new policies for alcohol-related hospital admission (A), violent crimes (B), sexual crimes (C) and antisocial behaviour rates (D).
Estimated cumulative impact of introduction of Cumulative Impact Policies (CIP) and licensing restrictions on rates of four different outcome measures
Evaluation of which control areas contribute most to the synthetic time series, based on their weights (ie, the inclusion probabilities), is shown in online supplementary tables S4a-S4d) and indicates that the synthetic time series for different areas are created based on different sets of control areas.
The summary results of the validation analyses are shown in table 2 with the corresponding forest plots presented in online supplementary figures S2a-S2d. A priori, these analyses in which true intervention areas were replaced by control areas should result in null findings. For alcohol-related hospital admissions and violent crimes, summary posterior effects are +1.3% (95% CI −2% to 4%) and +0.8% (–5% to 6%), respectively, confirming a null finding (posterior tail-area probabilities are 0.43 and 0.77, respectively). Restricting the violent crime analyses to 2013 similarly results in a null finding with a summary effect of −0.9% (−5% to 3%; p value=0.67).
Validation analyses: expected to give null effects of cumulative impact of introduction of CIP and licensing restrictions on rates of four different outcome measures
For alcohol-related sexual crimes however, the validation analysis shows a relatively large effect, in the opposite direction of the main analyses, of +12% (4% to 20%). This effect, however, disappears when the analyses are restricted to 2013 and a null finding of −0.8% (−8% to 6%) is found.
In contrast, the validation analyses for antisocial behaviour indicate a significant reduction in rates of −20% (−27% to−12%), which remains in the 2012-restricted analyses, and is similar to the effects observed in the main analysis.
Discussion
The analyses show convincing evidence of a true effect of an area changing from ‘passive’ alcohol licensing intensity to ‘most intense’ with respect to alcohol-related hospital admissions, and indicating an average relative impact of −6.3% (−12.8% to 0.2%) over the 4-year period. This effect is comparable to the average additional reduction observed in local areas with more ‘intense’ policies compared with’ passive areas’ over the same period of −5% reported previously.10 The conventional statistical evidence in our earlier study10—though strong in terms of tests against a null effect—is weakened by the study design which is at considerable risk of bias. The current natural experiment provides the opportunity to examine the evidence for causality. Similarly, these analyses indicate an average reduction in alcohol-related violent crimes of 4%–5% as a result of the policy intervention, with Bayesian CIs and posterior tail-area probabilities indicating the evidence for a true effect is less strong than for hospital admissions. The evidence, however, is stronger when the analyses are restricted to 2013 with the effect size for this period similar to that reported previously.9
The problem with trends in reported crime rates, and which required the stratified analyses, is a recognised problem and most likely the result of differences in the reporting and recording of crimes and not due to an actual increase in the crimes.29 30 A minor effect of this is shown for alcohol-related violent crimes, but the impact is more pronounced for alcohol-related sexual crimes. Most likely, this strong effect of differences in reporting and reporting of sexual crimes, resulting a sharp post-2012 increase in rates,9 was the result of the Metropolitan Police's highly publicised investigation into sex offences (Operation Yewtree).31 Nonetheless, an average reduction of 4.6% is observed for the 2011–2015 period, but a nearly twice as large effect is observed for analyses up to 2013 only with an effect of −8.4% (–21.4% to 4.6%) and the posterior tail-area probability reducing from 0.50 to 0.20, providing weak evidence for a direct effect. This inference is supported by the validation analyses which indicate a relatively strong increase in reported rates of 12% for the full period but, as expected, a null finding for the period up to 2013.
In contrast to previous findings,9 these analyses do not provide evidence for an effect of these policy interventions on antisocial behaviour. Although relatively strong effects of about −13% to 14% (depending on stratification) were observed with borderline significance, similar effects were found in the validation analyses. This indicates that the main underlying assumption of this methodology, that the relationship in the time series between the control and the intervention areas is similar in the preintervention and postintervention periods, is violated. We can hypothesise that this may be the result of a change in legislation in 2014, when in the UK the Anti-Social Behaviour, Crime and Policing Act 2014 replaced the Crime and Disorder Act 1998,32 and which will have resulted in nationwide changes in reporting.
An important limitation of this methodology, and one that to some extent obscured the results for the crime rates, is that the inferences made rely on the assumption that the relationship between the control and the intervention areas has been (1) stable in the past and (2) is expected to remain stable post intervention.
Additionally, trends need to be relatively stable to be able to estimate them accurately and allow for predictions. A dynamic regression model in which the linear relationships are allowed to change over time could have been used, but this would require more data than are currently available.
Another limitation of this study is that the level of analysis (ie, the local area) does not necessarily correspond to that of the intervention. A CIZ, for example, is generally smaller than a local area (in fact, an area can have more than one CIZ),33 which will add non-differential misclassification bias and dilute the potential effect.
In this natural experiment, in which we could only estimate, with reasonable accuracy, the moment the actual change in policy had occurred, we still cannot exclude the possibility that the observed effects are not the result of the change in policy, but of some other—hitherto unknown—endogenous factor. Because the data used to generate the synthetic control were of corresponding accuracy for all areas, we believe this to be unlikely. Nonetheless, variation is likely to have been introduced by other factors, such as changes in the extent of delivery of screening and brief interventions in different areas (as is obvious from the variability in effect sizes in both the main and the validation analyses). Similarly, we cannot completely exclude some effects as a result of ‘regression to the mean’. However, the null effect observed in the validation analyses, which included areas with similar or higher baseline alcohol-related burden, are reassuring. Moreover, based on their 2009 alcohol-related hospital admission rates the intervention areas had widely different baseline rates, being ranked between 6th and 298th (of 353 principal authorities).
In the absence of randomised, controlled trials but in the presence of a reasonable control pool of local areas without a change in policy, the Bayesian structural time-series models used here enable the use of a natural experiment design and provide an important alternative analysis strategy. Compared with alternative methods such as ‘difference–indifferences’ designs34 35 and interrupted time series,36 the current method has several advantages such as the inclusion of posterior uncertainty about which predictors to use and their coefficients,21 37 the inclusion of subjective data in defining the priors and the accommodation of both longitudinal and cross-sectional heterogeneity and serial autocorrelation.21 38 Moreover, by using Bayesian model averaging the model mitigates issues of arbitrary selection of covariates22 and overfitting as a result of use of point estimates only.21 An additional strength of this method is that it does not depend on the outcome being linear. Because of the use of comparative time series to construct the synthetic outcome, any confounder that affects all time series, such as national policies or austerity, will also automatically be controlled for. Moreover, in contrast to conventional regression methods, they can be used to evaluate the impact of an intervention on a single unit (ie, a local area; a street) rather than estimating average effects only. And finally, a particular strength of this method is the ability to make direct comparisons between different intervention areas to identify components of the intervention that may be associated with increased (or reduced) impact, which is of interest for future work.
In summary, the approach to a natural experiment described here marks a promising development in the rigorous evaluation of alcohol and other public health improvement interventions. While relying on a high degree of statistical expertise, it is relatively inexpensive to implement and is also particularly useful for situations in which a cluster randomised controlled trial of the required scale would be impractical.
The analysis of this natural experiment provides additional evidence that the implementation of active licensing policies, including CIZs, leads to a reduction in alcohol-related hospital admissions and violent crimes. It further provides some evidence these policies lead to a reduction in alcohol-related sexual crimes, but does not appear to lead to reductions in antisocial behaviour.
What is already known on this subject
Excessive alcohol consumption is associated with health risks and has wider negative societal impacts such as antisocial behaviour and violence. Local differences in how best to address these result in variation in local alcohol licensing policies which could result in different impacts on crime rates. Because of the complex nature of cause and effect, there is only weak evidence of any public health improvement as a result of these policies.
What this study adds
In this paper, a natural experiment is evaluated in which the impact of the introduction of cumulative impact zones and increased licensing enforcement on alcohol-related hospital admissions, violent and sexual crimes and antisocial behaviour is estimated. Using a novel causal inference framework based on Bayesian structural time series and synthetic controls, moderate reductions in alcohol-related hospital admissions and violent and sexual crimes were the result of the introduction of local alcohol licensing policies. There was insufficient evidence of an effect on antisocial behaviour. This novel methodology holds promise for use in other natural experiments in public health.
Acknowledgments
The research was funded by the NIHR School for Public Health Research (SPHR). NIHR SPHR is a collaboration between: the Universities of Sheffield, Bristol, Cambridge, Exeter, UCL; The London School of Hygiene and Tropical Medicine; the LiLaC collaboration between the Universities of Liverpool and Lancaster and Fuse: The Centre for Translational Research in Public Health, a collaboration between Newcastle, Durham, Northumbria, Sunderland and Teesside Universities.
References
Footnotes
Twitter @frankdevocht
Contributors FdV conceived the study, conducted the statistical analyses and wrote the first draft of the abstract. FdV and MH established the protocol. All authors contributed to the interpretation of the statistical analyses, provided input into the results and were involved in subsequent iterations of the draft manuscript. All authors provided input in, and agree with, the final version.
Funding This work was funded by the NIHR School for Public Health Research (SPHR).
Disclaimer The views expressed are those of the author(s) and not necessarily those of the NHS, the NIHR or the Department of Health.
Competing interests CA reports grants from Systembolaget, the Swedish government-owned alcohol retail monopoly, outside the submitted work; the Swedish government-owned alcohol retail monopoly. FDV reports grants from Alcohol Research UK, outside the submitted work.
Ethics approval None declared.
Provenance and peer review Not commissioned; externally peer reviewed.
Data sharing statement All data are publicly available.