Article Text

Abstract
Background Reducing inequalities in health is a great challenge for public health, but how relative and absolute inequalities in mortality respond to changes in mortality by socioeconomic group is not well understood.
Methods We derived arithmetically what combinations of changes and starting levels of mortality by socioeconomic group produce narrowing, and what combinations produce widening of relative and absolute inequalities in mortality. We then determined empirically how often these scenarios actually occur with data on inequalities in cause-specific mortality in five European countries spanning four decades (1970–2010).
Results Changes in the rate ratio depend exclusively on the ratio of relative mortality change between socioeconomic groups, whereas changes in the rate difference depend on whether the ratio of relative mortality change between socioeconomic groups is larger or smaller than the rate ratio. This implies that, in case of declining mortality and faster relative mortality decline in higher socioeconomic groups, the rate difference will increase until the rate ratio becomes equal to the ratio of relative mortality decline, but will then start to decline. In the most common scenario in our data set (starting rate ratio above 1.00 and faster relative mortality decline in higher than lower socioeconomic groups), the rate ratio indeed always goes up but the rate difference goes down in about half of all cases, sometimes after a period of growth.
Conclusions A narrowing of absolute inequalities occurs under a wider range of conditions than a narrowing of relative inequalities in mortality.
- Epidemiological methods
- Health inequalities
- MEASUREMENT
- MORTALITY
Statistics from Altmetric.com
Introduction
Reducing inequalities in health between socioeconomic groups is recognised worldwide as one of the greatest challenges for public health.1 ,2 In response, international agencies like the WHO and some individual countries have set quantitative targets for reducing these inequalities, for example, by 25% in 2020.3–5 The WHO Commission on Social Determinants of Health has even called for completely ‘closing the gap in a generation’.1
Unfortunately, real-life trends in health inequalities do not suggest that these ambitions are going to be achieved soon. The health outcome for which trends in inequalities can be assessed with some reliability is mortality, and almost all reports suggest that inequalities in mortality have widened instead of narrowed.6–16 It has only recently been noted that while relative inequalities in mortality have universally increased, trends in absolute inequalities have been more heterogeneous, with inequalities going down in some countries.17
This divergence between trends in relative inequalities (as measured by, eg, rate ratios of mortality comparing lower with higher socioeconomic groups) and trends in absolute inequalities (as measured by, eg, rate differences of mortality) is not completely understood. It is often explained by pointing out that when mortality in the population as a whole is declining, as it is in many countries, a widening of relative inequalities will occur if relative (or percentage) declines in mortality are larger among the higher than the lower socioeconomic groups, while a narrowing of absolute inequalities will occur if absolute declines in mortality are larger among the lower than the higher socioeconomic groups.17
However, this is only a superficial logic, because the two types of changes are arithmetically dependent on each other: the magnitude of an absolute decline in mortality is the product of the magnitude of the relative decline in mortality and its starting level, so larger relative declines should under many conditions also produce larger absolute declines. The aim of this paper is to more precisely determine the arithmetical relationship between changes in mortality by socioeconomic group, and changes in the magnitude of relative and absolute inequalities, and to specify the conditions under which relative and/or absolute inequalities in mortality go down.
Our analysis consists of two parts. First, we show in a simple theoretical derivation what combinations of changes in and starting levels of mortality by socioeconomic group produce a narrowing, and what combinations produce a widening of inequalities in mortality. Second, we assess how commonly these scenarios occur in real life. For this, we use data on inequalities in cause-specific mortality in five European countries spanning four decades (1970–2010).
Data and methods
Data
The data that we used for illustrative purposes came from five Western European countries: Finland, Norway, England and Wales, France and Italy (Turin). These five countries were selected because they have data spanning 40 years, allowing us to make reliable observations of changes over time. Data from Finland and Norway covered complete national populations, but data from England and Wales and France were collected for 1% of representative samples of the population, and data from Italy were collected for the city of Turin only. Recent national-level studies from Italy18 ,19 have found similar inequalities in mortality as the study from Turin. All data were originally collected in the framework of a longitudinal mortality follow-up of a population census, in which socioeconomic information of the population-at-risk and of the deceased came from the same source, that is, the census.
Socioeconomic status was indicated by highest level of completed education.20 Education was classified according to the International Standard Classification of Education (ISCED-97).21 The categories used in this analysis were ‘no, primary or lower secondary education’ (ISCED 0–2; ‘low’), ‘upper secondary and post-secondary non-tertiary education’ (ISCED 3–4; ‘mid’) and ‘tertiary education’ (ISCED 5–6; ‘high’).
We studied all-cause mortality, four large cause-of-death groups (cardiovascular disease, cancer, all other diseases and external causes), and mortality from 10 specific causes of death (ischaemic heart disease, cerebrovascular disease, lung cancer, breast cancer, stomach cancer, colorectal cancer, prostate cancer, a set of alcohol-related causes, road traffic accidents and suicide). Specific causes of death were not available for France. A full overview of data sources, with total numbers of deaths and person-years of observation, is given in web appendix table S1, and more details can be found elsewhere (http://www.demetriq.eu).
Supplemental material
Analysis
All analyses were stratified by sex, and restricted to the ages between 35 (40 in the case of Norway) and 79 years. Mortality rates by educational level were age-standardised using the European Standard Population,22 and the age-standardised mortality rates (ASMR) were used to calculate rate differences (RD) and rate ratios (RR) between the lowest and highest education group. We determined trends in ASMRs, RDs and RRs by conducting a linear regression analysis with calendar year as the independent variable. In order to determine whether changes in ASMRs, RDs and RRs were monotonic, we also calculated per cent per annum changes in mortality for each period between two available observations.
In a first step of the analysis, we derived the arithmetic relationships between relative changes in and starting levels of mortality by socioeconomic group, and changes in the magnitude of relative and absolute inequalities. We then created eight different scenarios for the development of relative and absolute inequalities, based on two socioeconomic groups, various directions and magnitudes of mortality change for these two socioeconomic groups, various starting levels for the RR, and a timescale of 40 years. The range of values used for these scenarios was taken from real-life data on socioeconomic inequalities in mortality mentioned above. For simplicity, we excluded scenarios with opposite directions of mortality change in low and high socioeconomic groups.
In a second step of the analysis, we determined the frequency with which these scenarios occur in real life, and assessed to what extent observed trends in inequalities in cause-specific mortality in the five countries could be explained from the arithmetic relationships identified in the first step.
Results
Box 1 shows the derivation of the arithmetic relationships between relative changes in mortality by socioeconomic group, and changes in the magnitude of relative and absolute inequalities. This analysis confirms that relative inequalities always increase over time when relative declines in mortality are larger in the higher than in the lower socioeconomic groups, or when relative increases in mortality are smaller in the higher than in the lower socioeconomic groups. However, changes in absolute inequalities have a more complex arithmetic relationship with relative changes in mortality by socioeconomic group, and also depend on the starting levels of the RR. A narrowing of absolute inequalities does not require relative declines in mortality in the lower socioeconomic group to exceed those in the higher socioeconomic group, but only requires that the ratio of the relative mortality declines of the higher versus the lower socioeconomic group is smaller than the starting RR of their mortality rates. It therefore occurs under a wider range of conditions than a narrowing of relative inequalities in mortality.
Arithmetic relationships between changes in mortality by socioeconomic group, and changes in the magnitude of relative and absolute inequalities
Definitions
M: Mortality rate
l: Lower SES
h: Higher SES
t: Time
RR: Ml/Mh
RD: Ml−Mh
Δt;t−1: (Mt−Mt−1)/Mt−1
The rate ratio RR is a simple measure of relative inequalities, and the rate difference is a simple measure of absolute inequalities in mortality between socioeconomic groups. Although we distinguish between two socioeconomic groups only, the reasoning can easily be extended to three or more groups.
Change in mortality over time is captured by Δ, which is the relative change in mortality between t and t−1, expressed as a proportion of the mortality at t−1. For illustrative purposes, time will be measured as (calendar) years, but any other measure of time will work as well.
Change in RR between t−1 and t is determined by: 1which is equivalent to
 2which is equivalent to
 3which is equivalent to
 4therefore
 5which is equivalent to
 6
6
Equation (1) is simply the definition of the rate ratio. Replacing the mortality rate at time t by the mortality rate at time t−1 plus the absolute change in mortality between t−1 and t (which is given by the product of the relative change Δ and the mortality rate at time t−1) gives equation (2). Simple calculus then leads to equation (4), which shows how the rate ratio at time t relates to the rate ratio at time t−1. This is then used in equations (5) and (7) to specify the conditions under which the rate ratio at time t will be smaller or larger than the rate ratio at time t−1.
Equation (6) specifies these conditions succinctly. The rate ratio will go up if the relative change in the lower socioeconomic group is larger than the relative decline in the higher socioeconomic group. This means that when the change in both groups is positive, that is, when mortality increases over time, the rate ratio will go up if the relative increase in the lower socioeconomic group is larger than the relative increase in the higher socioeconomic group. Conversely, when the change in both groups is negative, that is, when mortality declines over time as it mostly does, the rate ratio will go up if the relative decline in the lower socioeconomic group is smaller than the relative decline in the higher socioeconomic group.
On the other hand, the rate ratio will go down if the relative change in the lower socioeconomic group is smaller than the relative decline in the higher socioeconomic group. This means that when mortality declines over time as it mostly does, the rate ratio will only go down if the relative decline in the lower socioeconomic group is stronger than the relative decline in the higher socioeconomic group.
Change in RD between t−1 and t is determined by: 7which is equivalent to
 8which is equivalent to
 9which is equivalent to
 10therefore
 11which is equivalent to
 12
12
The next steps depend on whether mortality is increasing or decreasing, that is, on whether Δl is positive or negative. If Δl is positive, equation (12) is equivalent to 13awhich is equivalent to
 14a
14a
If mortality is declining, that is, Δl is negative, equation (12) is equivalent to 13bwhich is equivalent to
 14b
14b
Equation (7) is simply the definition of the rate difference. Replacing the mortality rate at time t by the mortality rate at time t−1 plus the absolute change in mortality between t−1 and t (which is given by the product of the relative change Δ and the mortality rate at time t−1) gives equation (8). Simple calculus then leads to equation (12), which shows how the rate difference at time t relates to the rate difference at time t−1. This is then used in equations (13) and (14) to specify the conditions under which the rate difference at time t will be larger or smaller than the rate difference at time t−1. Please note that equations (13) and (14) have two versions, depending on the sign of the relative change Δ.
Equation (14a) specifies that under conditions of increasing mortality the rate difference will go up when the ratio of mortality increase between the higher and the lower socioeconomic group is smaller than the rate ratio of the mortality rates between the lower and higher socioeconomic groups. This means that the rate difference will go up even when the relative increase is stronger in the higher than in the lower socioeconomic group, but only if the ratio of the two mortality increases stays below the rate ratio of their mortality rates. If the ratio of the two mortality increases is larger than the rate ratio, the rate difference will decline.
For the more common cases where mortality declines, equation (14b) specifies that the rate difference will go up only if the ratio of the relative mortality declines of the higher versus the lower socioeconomic group is larger than the starting rate ratio of their mortality rates. As we saw above in equation (6), a larger decline in the higher than in the lower socioeconomic group will push the rate ratio up, so that at some point the ratio of the mortality decline of the higher versus the lower socioeconomic group will inevitably become smaller than the rate ratio of their mortality rates. At that point, the rate difference will no longer go up, but will start going down. In other words, in case of declining mortality, with a faster mortality decline in the higher than in the lower socioeconomic group, the RD will increase until the RR becomes equal to the ratio of mortality decline between high and low socioeconomic status.
Table 1 summarises the expected changes in relative and absolute inequalities for eight scenarios: four with declining mortality, and four with increasing mortality. The RR always increases or decreases monotonically, but this is not true for the RD. When mortality declines at different speeds in the lower and higher socioeconomic groups, the RD will often decrease or increase until a certain point and then turn its course. This is due to the fact that changes in the RD partly depend on the RR, so that when the latter reaches a certain level the direction of change of the RD switches around. Such an ‘arithmetic turning-point’ occurs whenever the RR is equal to the ratio of relative mortality decline in the high versus the low socioeconomic group. When mortality increases at different speeds in the lower and higher socioeconomic groups, there is also one scenario in which the RD will not change monotonically.
Eight plausibly occurring scenarios in terms of starting levels of and relative changes in mortality by socioeconomic group
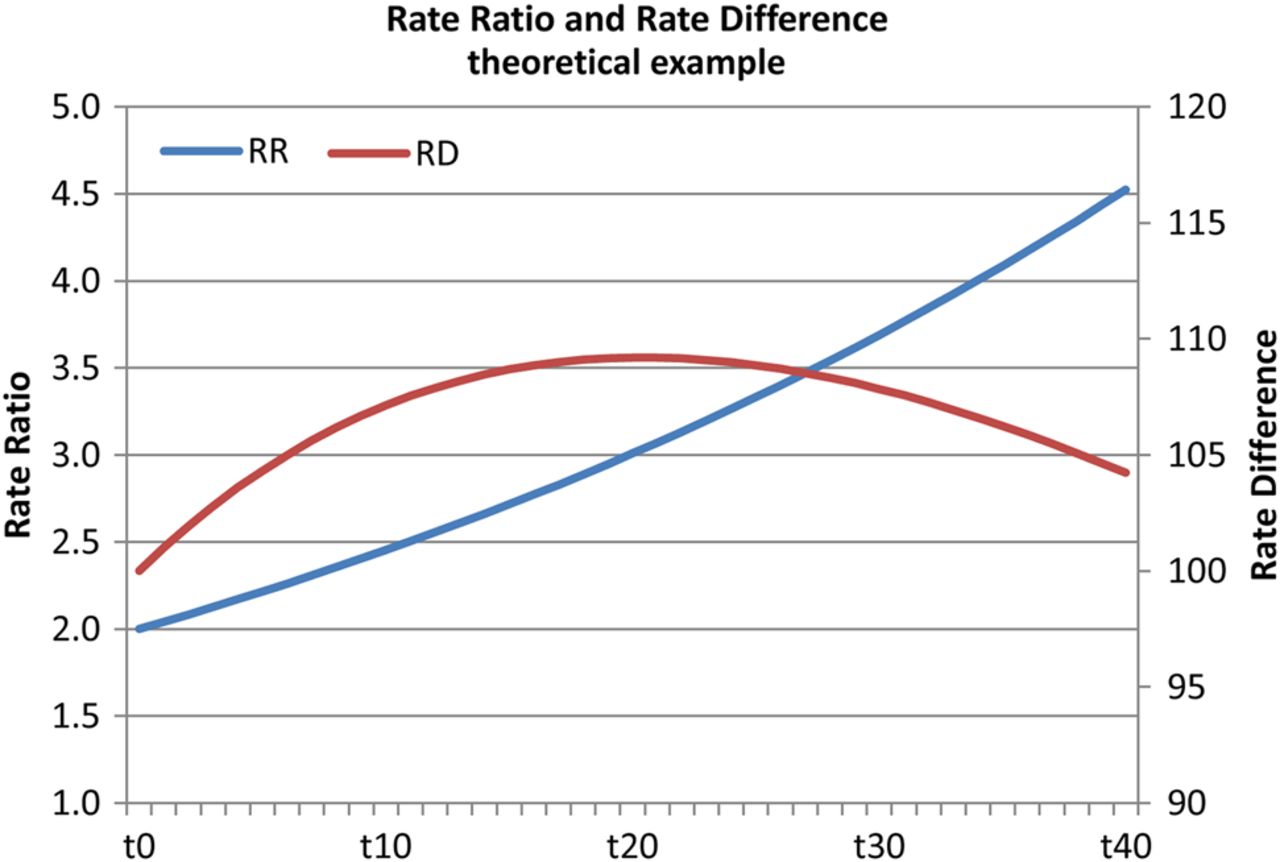
We illustrate the scenario which is most likely to occur in real life (situation I.a of table 1) in figure 1. When the starting RR is above 1 (higher mortality in the lower than in the higher socioeconomic group) and when the ratio of mortality decline in the higher as compared to the lower socioeconomic group is above 1 (more decline in the higher than in the lower socioeconomic group) but larger than the starting RR, the RD will first go up. However, it will start to decline as soon as the ‘arithmetic turning-point’ mentioned above has been reached, that is, when the RR has become equal to the ratio of mortality decline in the higher as compared to the lower socioeconomic group. Non-monotonic trends for the RD can also be expected for other combinations of starting RRs and declining mortality; with increasing mortality, however, the possible occurrence of non-monotonic trends is limited to the scenario of a starting RR above 1 and more mortality increase in the higher than in the lower socioeconomic group (situation II.c of table 1).

Monotonic increase of the rate ratio (RR), non-monotonic change of the rate difference (RD) when mortality declines more in the higher than in the lower socioeconomic group. Input data: starting levels RR=2.0, RD=100 per 100 000. Mortality change Δh=−3% per annum, Δl=−1% per annum. In this situation, the RR increases monotonically over time (as predicted by equation (6) in box 1), but the RD, after increasing at first, starts to decline as soon as the RR surpasses the value 3.0 (as predicted by equation (14b) in box 1).
In table 2, we have classified all changes in mortality by socioeconomic group (here indicated by educational level) as observed in our data set according to the eight scenarios mentioned in table 1. More detailed results can be found in web appendix table S2. The majority of observations fall within category I.a, that is, at the start, mortality is higher in the lower than in the higher socioeconomic group, and over time relative mortality declines are larger in the higher than in the lower socioeconomic group. This scenario is commonly seen for ischaemic heart disease, cerebrovascular disease, and lung cancer among men. In these cases, the RR goes up over time, but in about half of the cases the RD goes down. Inspection of the underlying data shows that the RD goes down whenever the ratio of mortality decline in the higher as compared to the lower socioeconomic group is less than the starting RR or, in other words, whenever the starting RR is high, or the difference in mortality decline between socioeconomic groups is small.
Frequency with which eight scenarios occurred in five European countries, 1970–2010, and number of observations of increasing and decreasing rate ratios and rate differences for each scenario
The second most common scenario is characterised by a starting RR below 1, and a faster relative mortality decline in the higher than in the lower socioeconomic groups (I.b in table 1). This scenario is often seen for breast cancer and cancer of the prostate. Here, both the RR and RD go up over time to sometimes reach values above 1 (for the RR) and above 0 (for the RD) at the end of the observation period. The third most common scenario is characterised by a starting RR above 1, and faster relative mortality decline in the lower than in the higher socioeconomic groups (I.c in table 1). This is commonly seen for stomach cancer, and also for ischaemic heart disease and cerebrovascular disease among women in Italy (Turin). As could be expected, in these cases both the RR and the RD mostly go down. Other scenarios are considerably less common, and increasing mortality almost always pushes both RR and RD up as well.
As predicted by the arithmetic relationships mentioned above, changes in the RD are not always monotonic. Web appendix table S3 presents an inventory of all cases in our data set in which an increase of the RD switches to a decrease, or vice versa. In several cases, the ‘arithmetic turning-points’ explained above play a role: the faster relative decline of mortality in the higher socioeconomic groups pushes the RR up until it becomes larger than the ratio of the two mortality declines, after which the RD starts to go down.
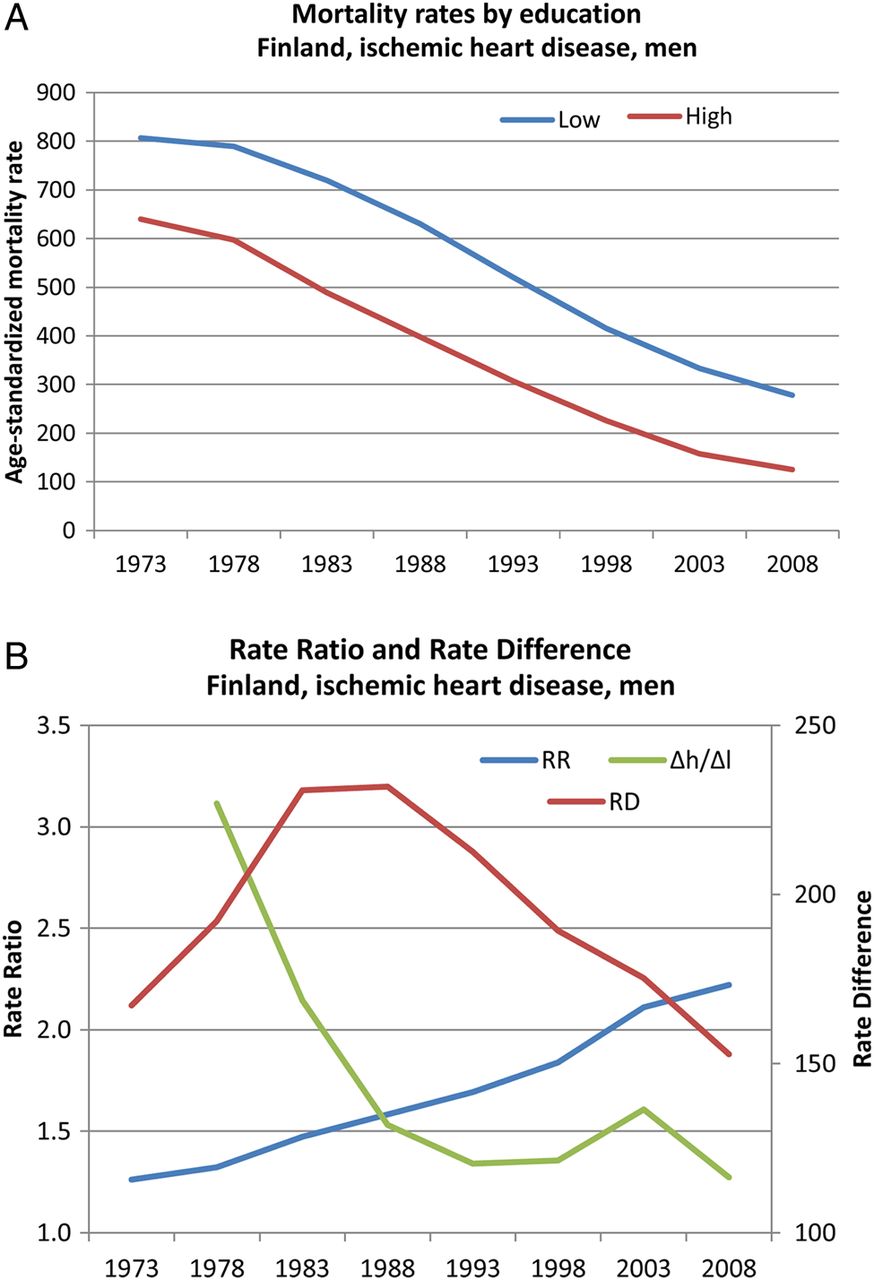
We illustrate the latter scenario in figure 2. In Finland, ischaemic heart disease among higher and lower educated men has declined since the mid-1970s, and because relative declines were faster among the high educated than among the low educated, the RR has gone up monotonically. However, the RD reached its peak in the mid-1980s, when the RR surpassed the ratio of mortality decline among the high as compared to the low educated groups. This was partly due to the fact that the latter declined considerably over time, as the speed of mortality decline among the low educated accelerated.
Monotonic increase of the rate ratio, non-monotonic change of the rate difference: Finland, ischaemic heart disease, men. (A) Mortality among low-educated and high-educated men. (B) rate difference (RD), rate ratio (RR) and Δh/Δl.
Discussion
Some limitations
Several simplifying assumptions have been made in our arithmetic analysis. For example, we distinguish between two socioeconomic groups only, thereby ignoring the fact that inequalities in mortality usually express themselves in the form of a gradient, with mortality decreasing in a stepwise fashion between lower and higher socioeconomic groups. However, our reasoning can easily be extended to three or more socioeconomic groups, and the general relationships demonstrated in this paper will hold for each single comparison between groups.
We have also ignored the possibility of differences in the direction of mortality change between higher and lower socioeconomic groups. In our data set, such differences of direction occurred in about 15% of all observations (see web appendix table S2), so it may be worthwhile to extend our analysis to also deal with these more complex scenarios.
Our data set covered five Western European countries only. After the collapse of the Soviet Union, mortality in many Central and Eastern European countries has increased, and much more so for the lower than for the higher educated.23 This implies that the frequency of scenarios II.a–d (table 2) would have been higher if these countries had been included in the analysis.
Interpretation
Researchers and policymakers do not agree on what measures to use for monitoring progress towards reduction or elimination of health inequalities, particularly on whether to use relative or absolute measures of inequalities.24 ,25 Some of the arguments pro and contra are arithmetic: one problem with relative measures of inequalities in mortality is that when ratios of mortality go up, ratios of the reverse outcome (survival) will automatically go down, and vice versa, leading to diametrically opposed conclusions.26 On the other hand, when overall mortality levels fall, and relative inequalities remain the same, absolute inequalities in mortality will automatically fall as well, without any change in the socioeconomic distribution of risk factors for mortality. What our analysis adds to these arithmetic arguments is that absolute inequalities can, without changes in the speed of mortality decline by socioeconomic group, start to decrease as a result of what could be called an ‘arithmetic maturation process’ (ie, as a result of the RR surpassing the ratio of the relative mortality declines of the higher vs the lower socioeconomic group).
Whether one prefers to look at relative or absolute measures of inequalities ultimately depends on one's normative standpoint.27 Using relative measures implies a strictly egalitarian position, in which what matters is equality in itself, independent of other considerations such as the absolute rates of disease for each group. Using absolute measures implies the pragmatic view that absolute rates matter most for people in lower socioeconomic groups, and that a smaller absolute mortality excess is thus to be preferred even if it goes together with a larger relative mortality excess. If one takes the latter standpoint, it is good news that absolute inequalities decrease under a wider range of conditions than relative inequalities. The arithmetic presented in this paper also helps to understand the narrowing of absolute, and concurrent widening of relative, inequalities in mortality seen in several European countries over the past decades.17
Conclusions
A narrowing of absolute inequalities occurs under a wider range of conditions than a narrowing of relative inequalities in mortality. Even without changes in the speed of mortality decline by socioeconomic group, absolute inequalities can start to decrease as a result of an arithmetic maturation process.
What is already known on this subject
It has been noted that relative inequalities in mortality usually increase, whereas trends in absolute inequalities are more heterogeneous, with inequalities going down in some countries.
What this study adds
We derived arithmetically what combinations of changes and starting levels of mortality by socioeconomic group produce narrowing, and what combinations produce widening of relative and absolute inequalities in mortality.
Changes in the rate ratio depend exclusively on the ratio of relative mortality change between socioeconomic groups, whereas changes in the rate difference depend on whether the ratio of relative mortality change between socioeconomic groups is larger or smaller than the starting rate ratio.
Absolute inequalities can, without changes in the speed of mortality decline by socioeconomic group, start to decrease as a result of an ‘arithmetic maturation process’, that is, as a result of the rate ratio surpassing the ratio of the relative mortality declines of the higher versus the lower socioeconomic group.
Acknowledgments
The authors thank the Office for National Statistics (Newport, UK), Professor Giuseppe Costa (Department of Clinical Medicine and Biology, University of Turin, Italy) and Dr Bjørn Heine Strand (Division of Epidemiology, Norwegian Institute of Public Health, Oslo, Norway) for providing data. The authors also thank David van Klaveren and Caspar Looman (both Department of Public Health, Erasmus MC) for their comments on a previous version of this paper.
References
Footnotes
Contributors JPM had the original idea, carried out part of the analyses, drafted the paper and finalised the paper based on comments from co-authors. PM and GM provided data for Finland and France, respectively, and commented on drafts of the paper. RdG harmonised and prepared the data, carried out part of the analyses and commented on drafts of the paper. All authors approved the final version of the paper. JPM is the guarantor of the paper.
Funding Supported by a grant (FP7-CP-FP grant no. 278511) from the European Commission Research and Innovation Directorate General, as part of the ‘Developing methodologies to reduce inequalities in the determinants of health’ (DEMETRIQ) project.
Competing interests None declared.
Provenance and peer review Not commissioned; externally peer reviewed.