Article Text

Abstract
Background English alcohol policy is implemented at local government level, leading to variations in how it is put into practice. We evaluated whether differences in the presence or absence of cumulative impact zones and the ‘intensity’ of licensing enforcement—both aimed at regulating the availability of alcohol and modifying the drinking environment—were associated with harm as measured by alcohol-related hospital admissions.
Methods Premises licensing data were obtained at lower tier local authority (LTLA) level from the Home Office Alcohol and Late Night Refreshment Licensing data for 2007–2012, and LTLAs were coded as ‘passive’, low, medium or highly active based on whether they made use of cumulative impact areas and/or whether any licences for new premises were declined. These data were linked to 2009–2015 alcohol-related hospital admission and alcohol-related crime rates obtained from the Local Alcohol Profiles for England. Population size and deprivation data were obtained from the Office of National Statistics. Changes in directly age-standardised rates of people admitted to hospital with alcohol-related conditions were analysed using hierarchical growth modelling.
Results Stronger reductions in alcohol-related admission rates were observed in areas with more intense alcohol licensing policies, indicating an ‘exposure–response’ association, in the 2007–2015 period. Local areas with the most intensive licensing policies had an additional 5% reduction (p=0.006) in 2015 compared with what would have been expected had these local areas had no active licensing policy in place.
Conclusions Local licensing policies appear to be associated with a reduction in alcohol-related hospital admissions in areas with more intense licensing policies.
- ALCOHOL
- PUBLIC HEALTH
- PUBLIC HEALTH POLICY
This is an Open Access article distributed in accordance with the Creative Commons Attribution Non Commercial (CC BY-NC 4.0) license, which permits others to distribute, remix, adapt, build upon this work non-commercially, and license their derivative works on different terms, provided the original work is properly cited and the use is non-commercial. See: http://creativecommons.org/licenses/by-nc/4.0/
Statistics from Altmetric.com
Introduction
The costs of alcohol misuse to the National Health Service (NHS) have been estimated at 3.5 billion pounds annually for England alone, with additional costs of £11 billion per year because of alcohol-related crime and £7.3 billion annually in lost productivity.1 Despite the proportion of people drinking regularly having fallen between 2005 and 2012,2 about 31% of women and 44% of men in England drink more than the recommended weekly alcohol limits,3 with frequent drinking becoming more common during mid to older age.4 Alcohol policy is controversial with opposing views and alternative strategies expressed by government, industry and health professionals.5
Two key strategies concern alcohol price and availability. Alcohol tax and price policies have been shown to have significant effects on alcohol-related disease and injury rates,6 but since the 1980s, the affordability of alcohol has been increasing,2 and the introduction of minimum unit pricing, a policy designed to remove the cheapest alcohol from the market, has been rejected for the time being in England, and is delayed due to legal challenges in Scotland. Several recent legislative changes have, however, strengthened the ability of local authorities to address public health through licensing policies. The 2011 Police Reform and Social Responsibility Act7 gave local Health Boards and Primary Care Trusts the status of ‘Responsible Authority’, which means they must be consulted on, and may object to, all licence applications. In addition to this, guidance issued in 2005 extended the 2003 Licensing Act8 to give local authorities new powers to address the cumulative impact of alcohol sales.9 Alcohol outlet density has been shown to be associated with violence and health,10–13 and the licensing process is primarily aimed at immediate harms associated with alcohol sales at a particular premises, and has no explicit remit to reduce alcohol-related population health harms.14 More specifically, it is stated that public health cannot be the primary consideration for a licensing decision, but may only be used to support licensing decisions based on any of the four objectives set out by the 2003 Licensing Act; that is, prevention of crime and disorder, public safety, prevention of public nuisance or protection of children from harm.8 ,9 Nonetheless, local authority licensing policy statements allow for alcohol consumptions to be addressed at a broader level than the individual premises, for example, through early morning restrictions and late night levies;14 although they have not been widely implemented and are open to legal challenges.9 Local authorities can also designate cumulative impact zones (CIZs) to control new alcohol outlets in areas where the cumulative stress caused by existing overprovision of alcohol outlets threatens the licensing objectives.15 In these CIZs, which can apply to on-trade, off-trade or both, applicants for a new alcohol licence have to demonstrate how they will avoid threatening the licensing objectives, which is a reversal of the normal burden of proof.14 It has been suggested that CIZs and restrictions in the licensing of new premises, which aim to regulate the availability of alcohol and modify the drinking environment, may be effective in reducing consumption and related harms.16 ,17
Although all local authorities operate under the same policy framework, concerns about the societal and health harms of alcohol consumption will differ between authorities, and they consequently will differ in respect of prioritisation of alcohol control interventions.17 Empirical evidence indicates that higher on-premise outlet density is related to violence and antisocial behaviour, whereas that higher off-premise alcohol outlet density is related to rates of chronic alcohol-related disease18 ,19 and has, for example, been shown to increase liver disease incidence rates in the USA.20
We hypothesised that the CIZs and the intensity of licensing scrutiny may impact on the density of outlets selling alcohol to be consumed off the premises, or, alternatively, affect the drinking environment through conditional licensing, thereby positively affecting alcohol-related hospital admissions. In this study, we aimed to evaluate whether differences in the implementation of CIZs and licensing scrutiny by local councils, aimed at regulating the availability of alcohol and modifying the drinking environment, has had a measurable impact on population health at the local level.
Methods
Data
Alcohol licensing data were obtained for lower tier local authorities (LTLAs) in England from the Home Office's ‘Alcohol and Late Night Refreshment Licensing England and Wales data’ for the years 2007/2008 and 2011/2012,21 which are completed by each LTLA's licensing lead. More details on LTLAs can be found elsewhere.22
Performance of various alcohol-reduction policies, programmes or initiatives are often benchmarked against official data of related harm. For monitoring of trends in alcohol-related harms, several measures of alcohol-related hospital admissions for England have been developed by Public Health England,23 with the two most used being the ‘broad’ and ‘narrow’ measures24 based on the International Statistical Classification of Diseases and Related Health Problems (ICD 10).25 The broad measure counts every admission where one of the diagnoses is a condition that is at least partially alcohol attributable, whereas the narrow measure counts only those admissions where the primary diagnosis is alcohol-related. Since every admission must have a primary code, the narrow measure is less sensitive to variations in coding practices (either between hospitals or over time) but may also underestimate the overall burden of alcohol on health services compared with the broad measure.24 We therefore used the narrow measure in order to ensure maximum comparability in the data used across different LTLAs, which may have heterogeneous coding practices. Quarterly data of directly age-standardised rates per 100 000 population (standardised to the European standard population) of unique persons (all ages) admitted to hospital with alcohol-related conditions were obtained from publicly available Local Alcohol Profiles for England (LAPE) data for the period 2009–2015; four full years and the first quarter of 2015.26 Alcohol-related crime rates were also obtained from the LAPE data set and used in the analyses to adjust for non-random implementation of policies.
Annual population size and deprivation data (measured using the index of multiple deprivation27) for 2007 and 2010 were obtained at the same LTLA level from the Office of National Statistics.
Exposure—licensing intensity
The level of implementation of CIZs and the intensity of licensing scrutiny aimed at controlling licensing and alcohol availability (ie, the exposure) for each LTLA was based on whether a licensing authority used CIZ (coded as yes/no); and whether any licences for new premises were successfully challenged by the LTLA in a particular year (coded as yes/no). These were aggregated for each available year to obtain a three-level metric for CIZ implementation and licensing enforcement intensity: the area has no CIZ and also no licensing applications have been refused (0), some new licenses applications have been refused OR a CIZ is in place (1), and new license applications have been refused AND a CIZ is in place (most active=2). The outcome of a new application can result in a conditional licence rather than one which is refused; something that is not included in this metric because we a priori interpreted refusal of new applications as being indicative of more intense licensing scrutiny compared with procedures resulting in conditional licensing. Although local alcohol policies were relatively stable over the period 2007–2015, changes did occur within some LTLAs, and to incorporate these, we aggregated the annual scores for each LTLA to generate a total 2007–2015 (cumulative) licensing intensity score. This cumulative score was then divided into four categories: no activity (passive), and three levels of intensity (low, medium, high), based on tertiles of the distribution. This categorisation was subsequently added to the statistical models described below both as a main effect, to adjust for baseline differences between the areas with different policy intensities, and as an interaction term with time to evaluate if policy intensity was related to different trends in rates of alcohol-related hospital episodes.
Analytical methods
Hierarchical growth modelling was used to analyse these data. Quarterly age-standardised alcohol-related hospital episode statistics (HES) rates (Y) were log-transformed and estimated to be related to a set of explanatory covariates; that is, a log-rate model.28 Because the main aim was to determine average changes in alcohol-related hospital admission rates, variability between LTLAs at baseline and individual LTLA time trends were modelled by means of hierarchical random-intercept-random slopes mixed-effects models with quarter (eg, January–March to October–December) included as a covariate to account for seasonal trends. This unconditional growth model, without additional covariates (for clarity, see equation S1 in online supplementary material), had an acceptable fit to the data, although there were several outliers in different LTLAs (see details in online supplementary material figure S1). In multivariate analyses, models were further adjusted for baseline (2007/2008) population size, deprivation and alcohol-related crime rates to control for non-random implementation of policies in LTLAs (eg, more intense alcohol policies were more likely to be implemented in areas with more problems).
We also conducted two sensitivity analyses (data presented in online supplementary material): (1) instead of the cumulative policy intensity metric, classification of LTLAs the year before health outcomes were available (2007–2008) was used. The 2007–2008 status was interpreted as the cause of alcohol-related hospital admission trends in the subsequent years (2009–2015); and (2) because the 2014/2015 data were only preliminary data at the time of analyses, we ran the same model but using only the data from 2009 to 2013.
All models were run using the lme4 package and corresponding p values for fixed effects were obtained using the lmerTest package in R (V.3.0.1). CIs were calculated using profile likelihoods. Model fit was assessed based on evaluation of residuals and with comparisons based on Bayesian Information Criterion (BIC), since all models are considered equally probable a priori.29 For clarity, the model described above is shown graphically in figure 1.
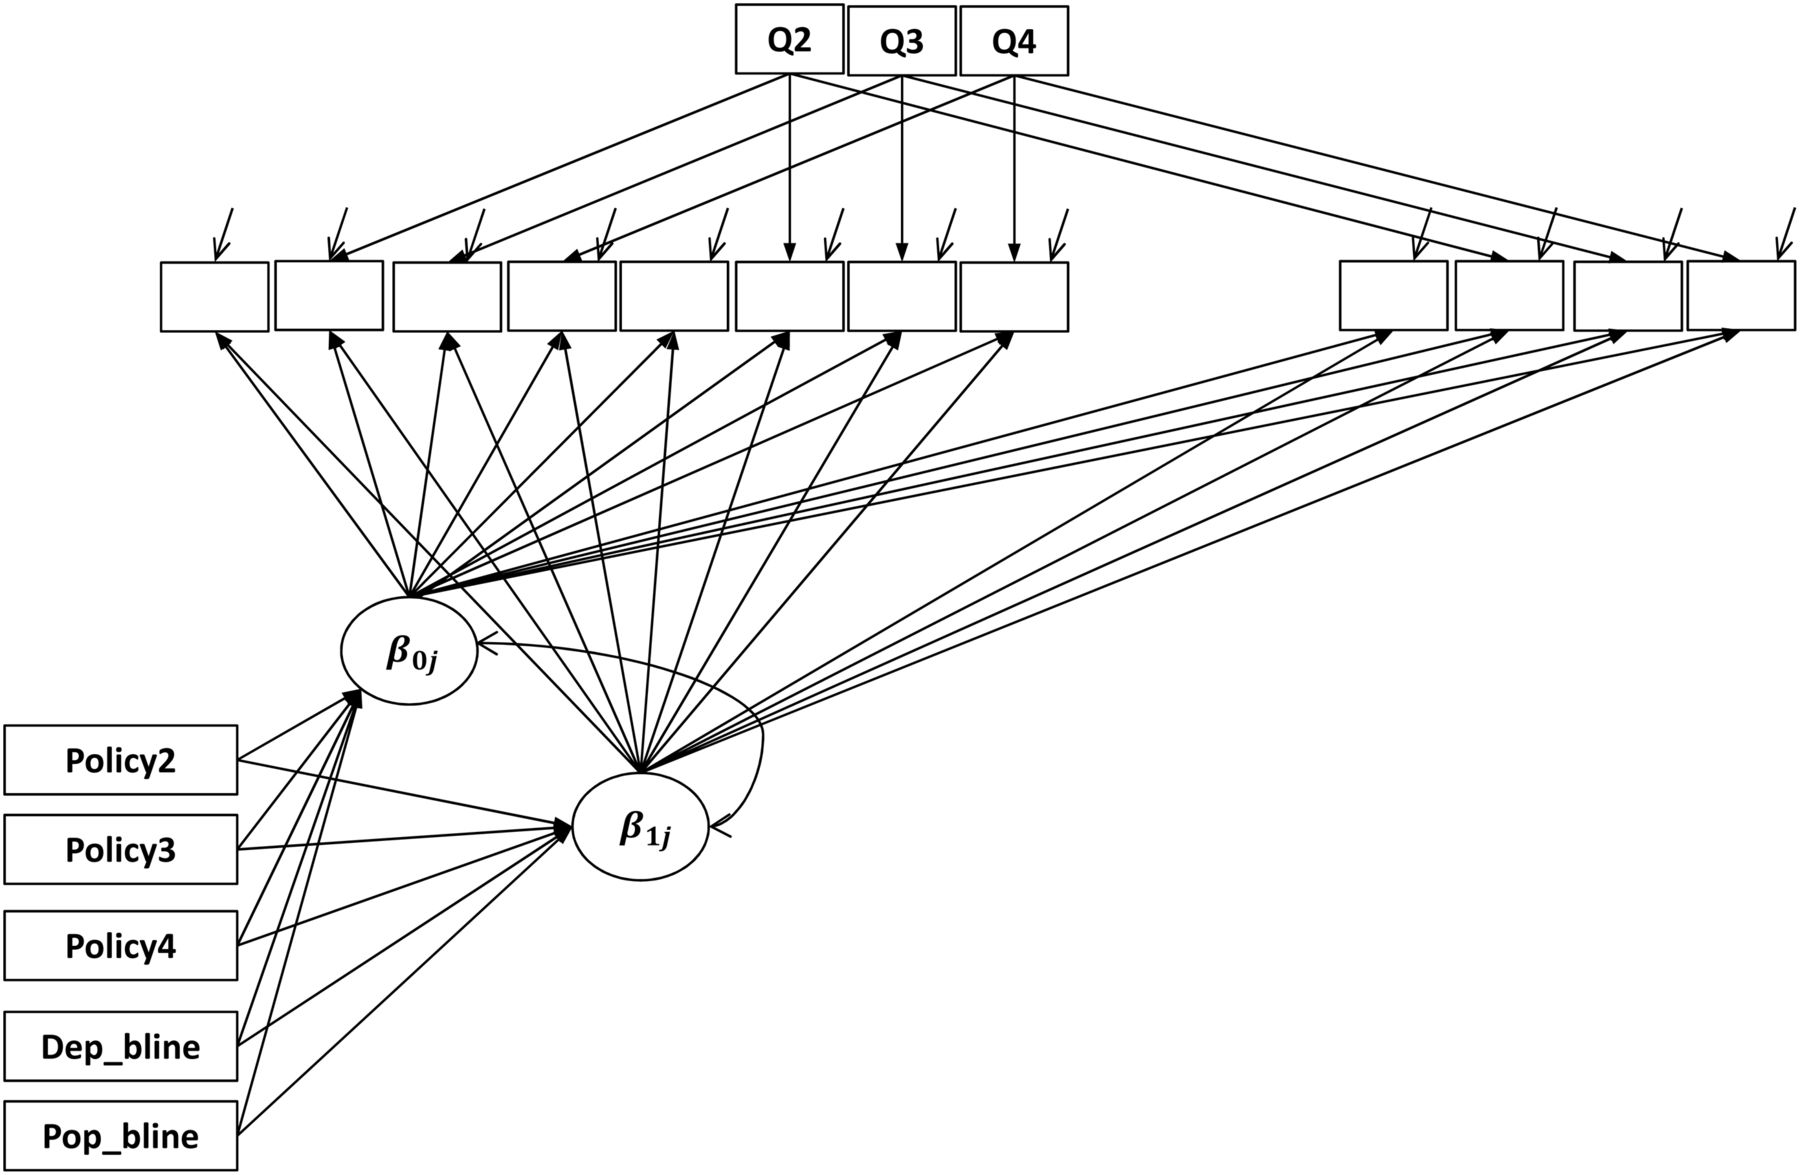
Graphical representation of the conditional model 2. Β0j indicates intercept, β1j indicates slope, Pop_bline and Dep_bline indicate population size and deprivation at baseline (2009/2010), Q2–4 indicate quarterly, seasonal estimates and Policy 2–4 indicate effect of low, medium and high cumulative (relative to none) policy on intercept and slope. Empty boxes indicate repeated measures within a lower tier local authority.
Results
The available data are shown in table 1. From a total of 326 LTLAs, data relating to 319 could be used in the analyses. Seven LTLAs were excluded primarily because data on licensing activity were unavailable. Up to a fivefold difference in age-standardised rates of alcohol-related hospital episodes between LTLAs was observed at baseline. One hundred and eighteen LTLAs (37%) were classified as having some form of active alcohol policy in 2007/2008, and 24 of these (20% of them and 7% of total) used CIZs as well as an active policy for new premises. Cumulative policy intensity, as described above, was medium or high for 19% and 16% of LTLAs, respectively. There were changes in local policies in the 2007–2014 time period in 63 LTLAs (201 minus 138) moving from having no active policy in 2007/2008 to adopting one for the period thereafter. Figure 2 shows the geographical spread of cumulative policy intensity stratified in the four groups across England.
Study sample demographics

Lower tier local authority cumulative policy intensity, stratified in the four categories: none (white), low (light grey), medium (dark grey) and high (black).
Table 2 shows the results for three versions of the growth models. The unconditional model describes the trend without additional explanatory variables, the first conditional model includes baseline covariates and an interaction between policy and time, and the second conditional model describes an expansion of conditional model 1 to include interactions with time for all covariates. The unconditional model indicates that the variance in time trends (slopes) between the different LTLAs is twice as large as the LTLA 2009 baseline variances (0.115 vs 0.057, respectively), and that there is a small national decline in alcohol-related hospital admission rates in the 2007–2015 period (−0.048 meaning that the annual rate is reducing by about 0.5% per annum).
Results growth models (2009–2015 alcohol-related hospital episodes statistics)
Inclusion of baseline deprivation, population size and alcohol-related societal harm (modelled as alcohol-related crime rates)—conditional models 1 and 2—explains about 50% of the baseline variability in admission rates between LTLAs. Beyond that, they do not provide any evidence that differences in population deprivation, population size or alcohol-related crimes could explain observed changes in admission rates over the 2009–2015 time period (p values 0.34, 0.26 and 0.16, respectively). There was some evidence that areas with more active (cumulative) alcohol licensing policies may have had higher baseline rates of alcohol-related hospital admissions compared to those with no active policies (p values 0.23 and 0.05, depending on the model).
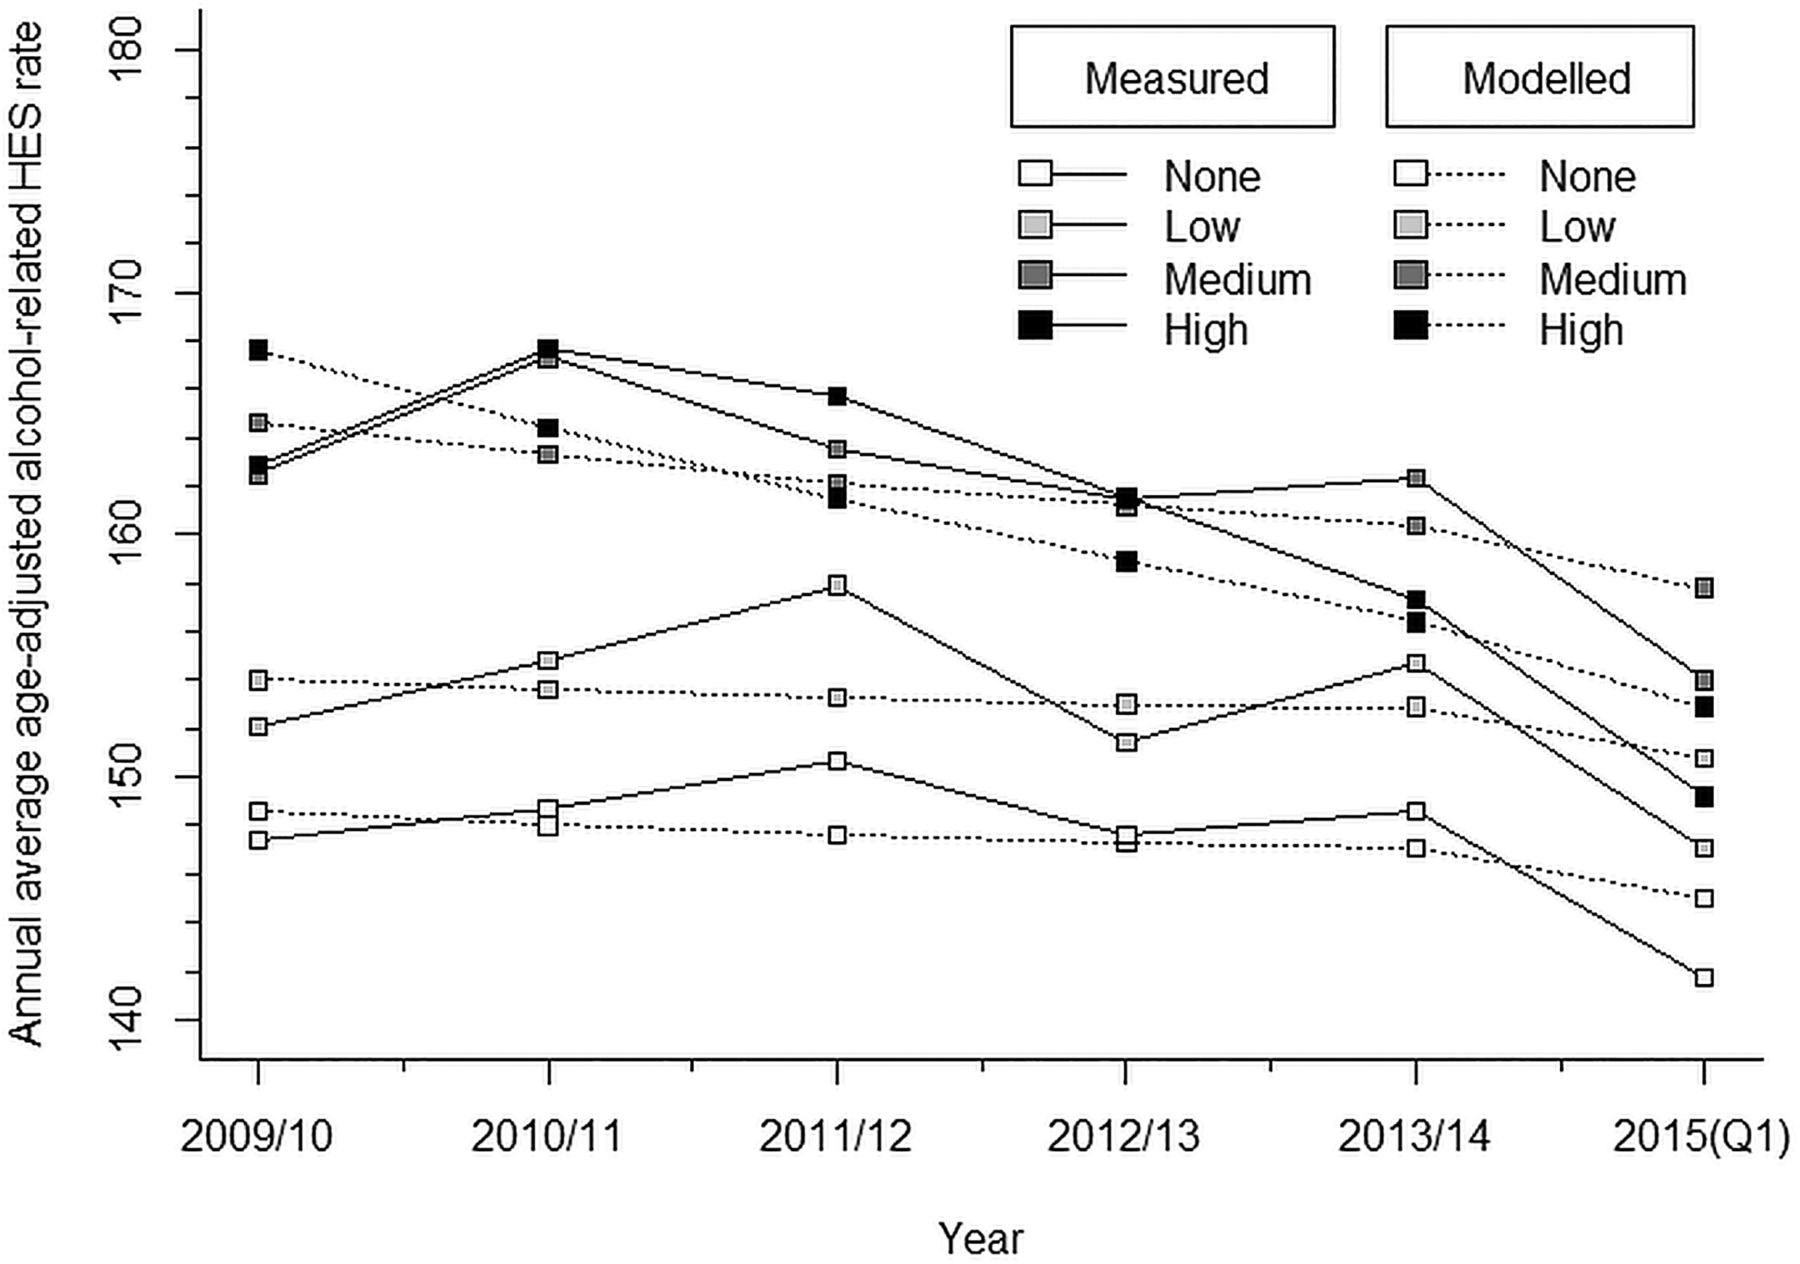
The most important finding of these analyses is that we observe different effects on the slope depending on the cumulative policy intensity (p=0.006). These results indicate that the intensity of alcohol licensing policies in LTLAs was associated with measurably larger reductions in alcohol-related hospital admissions, with larger effects in LTLAs with more intense policies. More specifically, these models indicate an additional, non-significant, decrease in admission rates of 0.6% annually in LTLAs with a medium intensity policy, which equates to a doubling of the reduction in the average admission rate over the 2009–2015 time period compared with the non-active LTLAs. The change in alcohol-related hospital admission rates in the areas with the highest intensity policies was −2% (95% CI −3% to −2%) annually (p\0.05), equating to (accounting for other modelled changes in population) an additional 5% reduction, or eight unique alcohol-related hospital admissions per 100 000 people fewer in 2015 compared with what would have been expected if these areas had not had active policies in place (figure 3).
Measured and modelled annual average rate (eg, exp(Y)) of alcohol-related hospital episode statistics (HES) admissions (narrow definition). Deeper colour indicates more active policy in the 2007–2015 period. Note that the figure shows annual averages instead of the modelled quarters, to reduce scatter and improve clarity of figures.
Sensitivity analyses using the policy intensity in 2007/2008 (see online supplementary material table S2) instead of baseline policy show comparable results, and sensitivity analyses using validated 2009–2013 data only (see online supplementary table S3) also show similar results, although with smaller effect sizes and weaker evidence (p=0.06).
Figure 3 shows the measured and modelled national annual average hospital admission rates. (Annual averages have been used instead of quarterly data to make the figure easier to interpret.) These show that (1) the conditional growth model reflects the measured data well and (2) that the more intense the alcohol policies in local areas were during the 2007–2014 period, the more pronounced was the reduction in admission rates. Online supplementary figures S2A and S2B show the measured and modelled age-adjusted alcohol-related hospital admission rates for the six selected LTLAs, which are case studies in complementary research being conducted by the NIHR School for Public Health Research (Bristol, Islington, Ipswich, Bradford, Newcastle-upon-Tyne and Blackpool) and similarly indicate that the model fits the data well for a range of different situations.
Discussion
An average decrease in alcohol-related hospital admissions of 0.5% per year was observed during the period 2009–2015. Our analyses show that there was a greater reduction in alcohol-related hospital admissions in local government areas where CIZs were present and with more intense scrutiny of alcohol licence applications. Although the effects on the age-adjusted rates are modest, about an additional 2% per year in the areas in the high-intensity group, given the expected relatively large amount of non-differential measurement error in especially the ‘exposure’,30 we would expect the modelled effect sizes to be an underestimate of true effects.
These data do not allow for firm conclusions on the causality of the observed association to be drawn, because although they indicate a dose–response association where larger reductions in admission rates are observed in the LTLAs classified as having the highest cumulative (covering the entire time period) intensity of enforcement and presence of CIZs, this could also be the result of these councils being more proactive not only in implementing CIZ, but also in adopting a range of alcohol policies in those areas for which we do not have data. These could include, for example, co-introduction of late night levies or co-investment in a range of polices aimed at reducing social and health harms, including alcohol screening and brief intervention programmes. Additionally, it may be that the shift from the selling of alcohol to be consumed on the premises (on sales) to sales for consumption off the premises (off sales)17 has been less pronounced in the areas where CIZs and more intense scrutiny was in place (potentially, but not necessarily, as a result of these policies).
The sensitivity analyses provide further support for our interpretation of the results; use of the 2007/2008 baseline policy data to categorise LTLAs results in comparable associations, but with slightly less fit, than would be expected from a result of changes in policy in the 2007–2014 period. We included outcome data that are yet to be fully validated for 2014; however, restricting the analysis to 2009–2013 data results in a similar pattern to that observed for the complete dataset, but with around an additional 1% annual decrease and weaker statistical evidence given lower power.
Although our stratification into four ‘cumulative exposure’ groups is relatively crude, we believe this to be less subject to measurement error compared with individual LTLA data, which have been shown to contain errors in the registered number of CIZs or in the number of licensing cases in some LTLAs.30 By grouping LTLAs into three groups based on the presence or absence of CIZs and licensing application refusals rather than the actual numbers, and because we defined the categorisation a priori, it seems unlikely that misclassification would have been substantial or differential. Nonetheless, a stronger argument on causality could be made if intermediate data on consumption or local area sales data were included. Unfortunately, these data were not available for these analyses.
Alcohol policies, as confirmed by the statistical models, are not introduced in random areas, but more active policies are introduced in areas with greater (baseline) levels of harm. We have adjusted for this in both models by using baseline deprivation, population size and alcohol-related crime as markers of societal impact of alcohol consumption, but residual confounding may still be present. A possible approach to assess this post hoc in more detail is to match areas using propensity scores and evaluate matched pairs in more detail using, for example, a qualitative methodology to gain insights into LTLA-specific policies for areas with similar baseline characteristics (F de Vocht, R Campbell, A Brennan, et al. Propensity score matching for selection of local areas as controls for evaluation of effects of alcohol policies in case series and quasi case-control designs. Submitted for publication, 2015).
Temporal autocorrelation was adjusted for by the mixed-effects models used. Although spatial autocorrelation was present (p<0.05), this was minor (Moran's I=0.024). In addition, since alcohol policies are neither implemented nor evaluated at this level, we opted not to include this level, as we were also limited in statistical power by the 319 LTLAs in our analyses. Figure 2 shows the spatial distribution of our policy metric.
Although counts were also available from LAPE,26 we used log-rate growth models instead of Poisson models to allow for direct modelling of age-standardised available rates. Parallel analyses were conducted using quasi-Poisson models (gllmPQL in the R MASS package31), with comparable results (data not shown).
The outcome measure is a composite measure including a mixture of conditions wholly attributable to alcohol, such as alcohol liver disease and ethanol poisoning, as well as partly attributable conditions, such as malignant neoplasms of the oesophagus and hypertensive diseases.23 Therefore, what remains unclear from these analyses is how much changes in admission rates reflect changes in the distribution of pathologies rather than an absolute change in incidence. A further disadvantage of this metric is that HES does not include accident and emergency (A&E) department visits. Local council alcohol policies are often primarily aimed at reducing acute societal impacts such as criminal behaviour, acute alcohol poisoning and nuisances in public areas,14 and, as such, a more direct link between A&E department visits and alcohol policies is likely to be present. Further analyses of the impact on alcohol-related A&E or splitting hospital admissions by different disease types could help further explain the patterns seen in our study. Nevertheless, in terms of public health impact, our analyses indicate a potential longer lasting benefit of a more intensive licensing policy.
The tendency to focus on acute harms in studies looking at alcohol availability in relation to harm17 also applies to evaluations of initiatives to restrict licences in proscribed geographical areas comparable to CIZs, such as the Sydney licence freeze.32 Our current approach, therefore, in terms of public health impact, may be indicative of a longer lasting benefit. For local authorities in the UK, where Directors of Public Health have now been allocated ‘responsible authority’ status with regard to being consulted about new licence applications,33 the results may also encourage a broader appreciation of the definition of harms that can be taken into consideration and may ultimately help make the case for inclusion of health as a fifth licensing objective of alcohol policy in England.
Conclusions
These analyses suggest that, the more intensely alcohol licensing policies are implemented in a local area, the stronger their effect on reduction in alcohol-related hospital admissions, with an additional annual average reduction of 2% in alcohol-related hospital admission rates; or about eight unique admissions averted per 100 000 people in 2015, had those licensing policies not been in place. Moreover, because of the inherent measurement error in the available data, the actual impact may well be larger, but further elucidation will require more specific data and a better understanding of the measurement error to enable incorporation of this in the statistical modelling.34 These analyses contribute to the available evidence on the effectiveness of population-level alcohol licensing policies specifically for England, and are the first to demonstrate that the intensity with which selected alcohol licensing policies are implemented and scrutinised is related to measurable reductions in alcohol attributable hospital admissions.
What is already known about this subject
Although all local authorities in England operate under the same policy framework, concerns with the societal and health harms of alcohol consumption led to differences in the prioritisation of alcohol control interventions.
What this study adds
This paper shows that local government areas in England with more intensive alcohol licensing policies are also the places where measurably larger reductions in alcohol-related admissions have taken place. This may be direct causation of the policies themselves or it could be an indirect association, but in either case, these analyses suggest a longer lasting population health benefit of local government initiatives to restrict alcohol licences.
Acknowledgments
The authors would like to thank Dr Matt Egan (LSHTM) for valuable input.
References
Supplementary materials
Press release
Files in this Data Supplement:
Supplementary Data
This web only file has been produced by the BMJ Publishing Group from an electronic file supplied by the author(s) and has not been edited for content.
- Data supplement 1 - Online supplement
Footnotes
Measurable effects of local alcohol licensing policies on population health in England.
Contributors FdV conceived of the study. FdV, JH, JM and MH established the methodology, with subsequent input from all the other authors. FV and JH conducted the statistical analyses with input from MH, CA and AB. FdV wrote the first draft, and all the authors reviewed this and provided input. All the authors read and approved the final version.
Disclaimer The views expressed are those of the author(s) and not necessarily those of the NHS, the NIHR or the Department of Health.
Funding This work was funded by the National Institute for Health Research School for Public Health Research (NIHR SPHR). NIHR SPHR is a partnership between the Universities of Sheffield, Bristol, Cambridge, Exeter, UCL; The London School for Hygiene and Tropical Medicine; the LiLaC collaboration between the Universities of Liverpool and Lancaster and Fuse; and The Centre for Translational Research in Public Health, a collaboration between Newcastle, Durham, Northumbria, Sunderland and Teesside Universities.
Competing interests None declared.
Provenance and peer review Not commissioned; externally peer reviewed.
Data sharing statement All data are publicly available as described in the manuscript.