Article Text

Abstract
Background Attempts at predicting individual risk of disease based on common germline genetic variation have largely been disappointing. The present paper formalises why genetic prediction at the individual level is and will continue to have limited utility given the aetiological architecture of most common complex diseases.
Methods Data were simulated on one million populations with 10 000 individuals in each populations with varying prevalences of a genetic risk factor, an interacting environmental factor and the background rate of disease. The determinant risk ratio and risk difference magnitude for the association between a gene variant and disease is a function of the prevalence of the interacting factors that activate the gene, and the background rate of disease.
Results The risk ratio and total excess cases due to the genetic factor increase as the prevalence of interacting factors increase, and decrease as the background rate of disease increases. Germline genetic variations have high predictive capacity for individual disease only under conditions of high heritability of particular genetic sequences, plausible only under rare variant hypotheses.
Conclusions Under a model of common germline genetic variants that interact with other genes and/or environmental factors in order to cause disease, the predictive capacity of common genetic variants is determined by the prevalence of the factors that interact with the variant and the background rate. A focus on estimating genetic associations for the purpose of prediction without explicitly grounding such work in an understanding of modifiable (including environmentally influenced) factors will be limited in its ability to yield important insights about the risk of disease.
- Gene environment interactions
- GENETICS
- EPIDEMIOLOGY
Statistics from Altmetric.com
Introduction
Investment in understanding the genetic basis of human disease has long promised a potentially revolutionary way to predict which healthy individuals will eventually develop disease.1 ,2 Scholarly commentaries and the scientific lay media suggest that the time is soon coming when the neighbourhood general practitioner will scan patients’ biological information in order to facilitate preventive recommendations.3 ,4 Further, an increasingly lucrative private industry promises to provide individuals with a prediction about their risk of disease based on their genetic profile.5–7
For secondary and tertiary prevention, the genetic revolution has brought some important advances. In the case of pharmacogenetics, a relatively small but expanding range of established findings allow incorporation of germline genetic information to predict adverse events and drug response.8 However, primary prevention based on common germline genetic variants has not, generally speaking, been successful.9 ,10
A tremendous amount of data within individuals across biological systems and across time is increasingly becoming available,4 and yet the use of common germline genetic variants to provide information for primary prevention efforts faces several central limitations. First, while genetic factors have been useful in characterising aggregate risk (eg, groups with a particular genetic factor have a higher probability of developing disease) and in enhancing our ability to assess the causal effects of diet and other modifiable environmentally influenced factors on common disease,11 ,12 they have largely been less useful in predicting which actual individuals will acquire disease. Second, large-scale genome-wide association studies have demonstrated that many chronic diseases are highly polygenic with hundreds of genes explaining only a small portion of variance,13 ,14 hence obviating the utility of any one (or small set of) genetic factor in disease prediction. Certainly, the science and scholarship behind systems biology and genetic medicine is rapidly advancing,4 ,15 foreshadowing a potential future in which enough data points are available on enough biological systems within and across people that our current approaches to developing predictive tools may yield successful clinical utility.
Current simulation studies have demonstrated that the main determinants of the predictive validity of germline genetic variants are the heritability and the magnitude of the relation with the disease outcome of interest.16 A focus on gene-by-gene (epistasis) and gene-by-environment interactions at the population level may thus be an informative way to maximise genetic information for use in preventative medicine.9 ,17 Efforts to detect meaningful gene-by-environment interactions and epistasis, however, have been met with difficulty11 ,18 and may not be worth the cost in some circumstances.19 Further, unpredictable stochastic processes may underlie at least some population variation in disease incidence.20 ,21 Nevertheless, the reasoning that interactions are critical for understanding genetic architecture is predicated on an appreciation of the role that ‘third factors’, be the other genes or environmental exposures, play in shaping any observed genotype–phenotype association.21 ,22 In particular, it has been argued that absent the incorporation of environmental factors together with genetic factors, we will always have limited ability to predict the risk of individual disease states.20
Understanding the factors that may elicit genetic risk is critical to interpreting the magnitude of the effect,19 ,23 as the magnitude of an association will differ across populations with different distributions of other risk factors.15 This rests on some canonical concepts in epidemiology, but penetration of these concepts into other disciplines of research has been limited.
In particular, we are not aware of attempts to formalise the elements of interaction that shape risk prediction. In this paper, we use simulated data of one million separate populations to demonstrate the drivers of the association between a germline genetic risk factor and a disease outcome, drawing observations that have implications for personalised medicine and genetic risk prediction.
Methods
Causal structure of disease
We begin our simulation by creating a causal structure for a hypothetical disease. This disease is multifactorial in aetiology. Therefore, in this hypothetical scenario, disease is caused through the interaction of a germline genetic risk variant and an environmental exposure (or a set of adverse environmental exposures). By interaction, we mean that individuals exposed to the genetic risk variant and the environmental exposure will have a higher risk of disease than the additive effect of those exposed to either factor alone (we note that this is a more conservative assumption than an effect that is assumed to be multiplicatively interactive—the results of the simulation hold under assumptions of additive or multiplicative risk). The disease can also be caused in a myriad of other ways (ie, unrelated to the genetic and environmental factor of central interest); this is represented in our simulation as the background rate of disease. Therefore, any increase in the risk of disease among those with the genetic variant is a relative increase over the background rate.
There are three parameters that are varied in our simulation: the prevalence of the genetic risk variant, the prevalence of the environmental context and the background rate. For the purposes of this simulation, we shall denote the genetic variant as (G), the environmental context of interest as (E), alternative causes as (X) and the disease in question as (D). Therefore, in this paper, we are centrally interested in formally understanding how the risk ratio describing the association between (G) and (D) varies at different values of (E) and (X).
We note that the simulation we conduct is agnostic to what we define G and E to be. The simulation would be equally as accurate if instead of an environmental factor, we posited a second genetic factor (epistasis). For simplicity, we focus on labelling the second factor as an environmental factor.
Simulated populations
In order to estimate every conceivable combination of prevalence (from 1 to 100) for three factors, we needed to simulate 100*100*100 populations (1 000 000). We thus simulated 1 000 000 populations with 10 000 individuals in each population by creating data sets populated with 10 000 data points in SAS statistical software. We generated exposure probabilities for each of these populations. Each data point (individual in the population) had a preset probability of each exposure (genetic risk variant (G), environmental factor (E), and background rate (X)); we used a random number generator and a binomial probability distribution in order to assign individuals as exposed or unexposed. The exposures were assumed to be uncorrelated. The preset probability of individuals in each population having G ranged from 1% to 100% in each population; similar ranges were possible for E and the X. We used 1 000 000 populations so that the full range of the intersection of all probabilities could be exposed.
Analysis
We present in the results nine scenarios for the prevalence of environmental factors and the background prevalence of disease. These include prevalences of E and X that are likely to be found at the population level for most chronic disease (eg, low background rate, moderate-to-high prevalence of environmental factors) as well as prevalences that are extreme (eg, background rates of disease >80%). These thresholds were selected to be illustrative; the full results at any threshold are available on request. The nine scenarios were thus as follows:
Low prevalence of E (1–5%), low prevalence of X (1–5%);
Low prevalence of E (1–5%), moderate prevalence of X (25–35%);
Low prevalence of E (1–5%), high prevalence of X (>80%);
Moderate prevalence of E (25–35%), low prevalence of X (1–5%);
Moderate prevalence of E (25–35%), moderate prevalence of X (25–35%);
Moderate prevalence of E (25–35%), high prevalence of X (>80%);
High prevalence of E (>80%), low prevalence of X (1–5%);
High prevalence of E (>80%), moderate prevalence of X (25–35%);
High prevalence of E (>80%), high prevalence of X (>80%).
We estimated the risk of disease among those exposed to G compared with the risk of disease among those unexposed to G at every possible prevalence of G in the population from 1% to 100% with each of the nine scenarios. This risk ratio and risk difference was then estimated, using basic categorical data analysis in the SAS Statistical Software program. Statistical testing was unnecessary as these were simulated populations rather than samples.
Results
Figure 1 shows nine separate graphs with G prevalence in each of 100 populations on the x axis and risk ratio magnitude on the y axis. In figure 2, we show the same scenarios, with the measure of association the risk difference rather than the risk ratio. Four results of note emerge from this series of simulations.
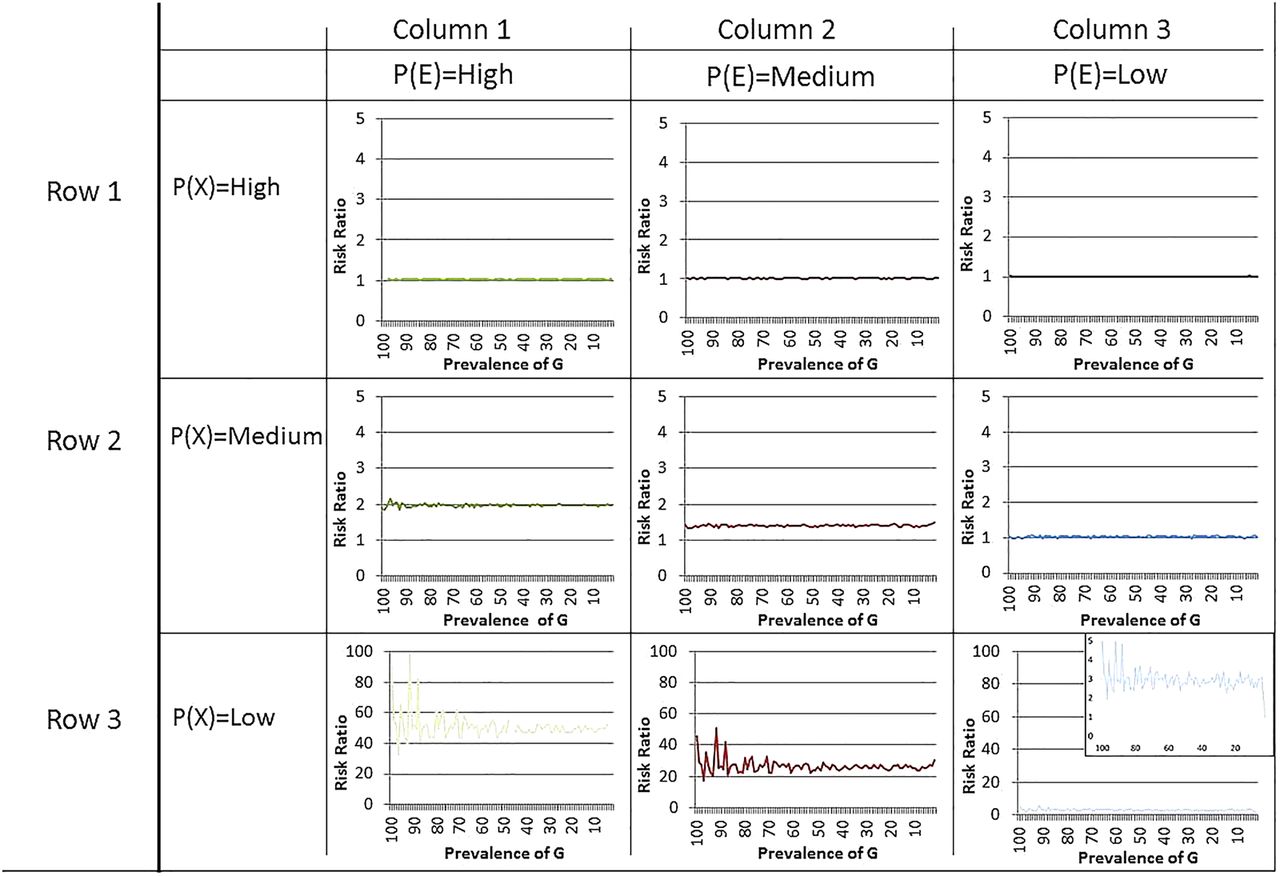
Risk ratio for the effect of gene on disease across prevalences of environmental variables and background rate of disease. G=genetic cause of disease. E=environmental cause of disease; the environmental cause requires presence in order for the genetic marker to have an effect. X=background rate of the disease—all causes that are not either G or E. Graph: y axis=risk ratio for the effect of genetic marker on disease; x axis=prevalence of genetic marker in each population.

Risk difference (excess cases per 100 persons) for the effect of gene on disease across prevalences of environmental variables and background rate of disease. G=genetic cause of disease. E=environmental cause of disease; the environmental cause requires presence in order for the genetic marker to have an effect. X=background rate of the disease—all causes that are not either G or E. Graph: y axis=risk difference for the effect of genetic marker on disease; x axis=prevalence of genetic marker in each population.
At any G prevalence, the determinant of the magnitude of the risk ratio and the risk difference is prevalence of the E and X
Based on figure 1, in six of nine graphs, the line for the magnitude of the risk ratio by gene prevalence is almost perfectly flat. For example, when P(E) is high and P(X) is moderate, the risk ratio for the effect of G on the outcome is around 2.0, both when G prevalence is 1% or when G prevalence is 99%.
There is variation, however, in the magnitude of the risk ratios when we examine across different graphs. Examining the three graphs in the row where P(X) is moderate, we can see that the risk ratio associated with G, at any prevalence, is around 2.0 when P(E) is high, around 1.5 when P(E) is moderate and 1.0 when P(E) is low. Thus, the determinant of the size of the risk ratio associated with G is the prevalence of the environmental factors that activates it.
Similarly, based on figure 2, the risk difference is constant at all prevalences of G when P(E) and P(X) are held constant, whether the P(E) is high or low, or whether P(X) is high or low. The risk difference changes as the P(E) and P(X) change, but not within particular P(E) and P(X) levels across prevalences of G.
At every G prevalence, the risk ratio and the risk difference increases as the prevalence of E increases (holding X constant at <80%)
When the prevalence of the background rate is less than 80% (as it will be in almost all conceivable circumstances), there is an increase in the risk ratio and the risk difference associated with G with increasing prevalence of E. This increase is, again, invariant to the prevalence of G. Thus, holding the background rate constant and below 80%, if the prevalence of E increases, the magnitude of the association between G and the disease will also increase. Note that the prevalence of G does not vary the size of the risk ratio.
Similarly, the risk difference also increases with increasing prevalence of E. For example, when the background rate is moderate, the disease will be attributable to an excess of five cases of disease per 100 persons when P(E) is almost ubiquitous, and almost no cases of disease when the P(E) is very rare. When the environmental cause of disease is ubiquitous and the background rate of disease is low, virtually all cases of disease within the population are attributable to G.
At every G prevalence, the risk ratio decreases as the background rate of disease increases (holding environmental cause prevalence constant at greater than 5%)
As shown in columns 1 and 2 of figure 1, as long as the prevalence of E is greater than 5%, the risk ratio associated with G will decrease as the background rate increases. The same pattern is found for risk differences (figure 2). The excess cases of disease attributable to genetic variance decrease as the background rate of disease increases. That is, as more individuals in the population are exposed to factors that cause disease regardless of whether they have the risk-raising genetic variant or not, the fewer the individuals in that population who will acquire the disease from the interaction of G and E.
When the background rate is low, there is more variability in the effect of G on disease when the prevalence of G is low
We now turn our attention to the one scenario in which the prevalence of G matters for the magnitude of the association between the G and disease. Examining the third row of figure 1, we see that there is variability in the magnitude of the risk ratio associated with G when the prevalence of the genetic variant is low in the population and the prevalence of E is greater than 5%. However, the risk ratio associated with the genetic variant in these scenarios will be large regardless. In the first column, the risk ratio ranges from 38.0 to 100.0; in the second column, the risk ratio ranges from 20.0 to 40.0. In the third column (enlarged for easier interpretation), the modal risk ratio is 3.0 but ranges from 1 to 5.
Risk differences, in contrast, are more stable across the range of gene prevalences when the background rate is low, likely due to the inherent bounds of an additive measure to be between 0 and 100 compared with a multiplicative measure such as the risk ratio which can take on values from 0 to infinity.
Discussion
Using simulations that span the range of potential possible prevalences of genes, environmental factor and unrelated factors, we show that the magnitude of both the risk ratio and risk difference association between a genetic factor and health outcome depends entirely on the prevalence of two factors: (1) the factors that interact with the genetic variant of interest; and (2) the background rate of disease in the population. These results indicate that genetic risk factors can only adequately predict disease in the presence of common interacting factors, suggesting natural limits on the predictive ability of individual common germline genetic factors in preventative medicine.
Genetic epidemiological investigations have for some chronic diseases moved towards multilocus gene scores rather than single variants, with the goal of improving predictability.24 ,25 However, the concepts that we illustrate in the present paper can be translated to any germline genetic variant or score. The ability of these multilocus scores to predict disease occurrence will depend entirely on the prevalence of the environmental factors that interact with the genetic factors in the multilocus score; further, if there is heterogeneity in the interaction of environmental factors with the variety of genetic factors across the score, the predictability of the multilocus gene score may vary substantially across populations. Four central implications for genomic medicine and public health emerge from these findings.
First, our emphasis on finding associations between specific genes and disease outcomes that can be useful for disease prediction will continue to be largely futile unless, when appropriate, they are accompanied by a joint assessment of environmental contexts and epistasis that activate particular genetic vulnerability. To date, thousands of genetic markers for complex human disease have been identified and replicated.26 Genetic epidemiology is moving towards estimating polygenic risk scores that incorporate information across the genome regarding risk for diseases. Yet these scores and the underlying associations on which they are based rely on potentially problematic assumptions about the lack of epistatic interaction and gene-by-environmental interaction.15 ,25 Genetic markers and risk scores will continue to be fundamentally unhelpful in predicting disease unless these interacting processes are conceptualised, measured, analysed and reported when appropriate.
Second, our simulation results indicate that large risk ratios for the effects of germline genetic variants are obtained when the background rate of disease is low and environmental causes of disease are common. This is likely the situation for many complex traits. For example, rare variants in Leber hereditary optic neuropathy have a strong effect (clinical penetrance of >90%) among individuals who smoke.27 Considering smoking as an environmental cause of disease, this finding corresponds to these simulation results. Among a smoking population (ie, the environmental cause of disease is ubiquitous), those who have the risk gene will almost inevitably develop the disease, whereas those who do not have the risk gene will not, leading to a large effect of the gene. The predictability of Leber hereditary optic neuropathy would be close to perfect among populations of smokers. If smoking is not considered, the overall gene–disease association estimate is modest, and the gene will have less predictability on the outcome. As the cost of genetic testing continues to decrease and the technology rapidly increases, the cost of including genetic information into prediction formulae or as conjoint tools in clinical practice will be low even if the predictive gain is marginal. The overarching message of the present work that this predictive ability gained will be a function of the prevalence of other co-occurring and competing factors, and thus will often vary from population to population.
In the present paper, we estimate the risk of disease given presence versus absence of a specific genetic variant, and there is an analogy to be drawn between our results and the literature on heritability (the proportion of variation in a health outcome attributable to genetic variation). Heritability is often interpreted as a measure of how much a health outcome is ‘genetic’ versus ‘environmental’ in an absolute sense, but in behavioural genetic research, scientists have long, and correctly, guarded against misinterpretations of heritability estimates.20 ,28 Heritability, as an expression of genetic risk prediction, is mutable and the heritability of outcomes that change over time such as heavy alcohol consumption,29 body mass index,30 and cognitive ability31 change as a function of environmental context. Therefore, the ‘heritability’ of a particular phenotype has limited utility absent a full description of the conditions (ie, prevalence of other environmental and genetic co-occurring causes) that influence that heritability.
Fourth, these observations have implications for our ability to replicate genotype–phenotype associations and potentially explain why many meta-analyses show null findings when the results of many studies are combined.14 Study design issues may underlie non-replication to some degree11 ,18; for example, it has been demonstrated that many replication attempts are underpowered to detect hypothesised differences.18 ,32 As such, a focus on genetic epidemiology has been increasing the power of studies through larger and larger sample sizes.33 We show here that a potential cause of differences across studies conducted in diverse population is varying prevalences of environmental and co-genetic factors that interact with gene markers of interest, when such interaction influences disease occurrence. In fact, if important environmental contributions to disease vary across population, we would expect sometimes radically different association magnitudes. This is not ‘non-replication’ or ‘population stratification’ per se. Rather, it is critical insight into the environmental effects that activate genes and should be explored for a greater understanding of disease mechanisms. As has been pointed out by others,34 ,35 minimising ethnic heterogeneity, for example, maximises internal validity,36 but does so at the detriment of external validity. The broader implication of our results is that to reduce disease burden at the population level by identifying causes that have the greatest impact; a focus on inclusive and diverse study designs, hypotheses, and data collection regarding potential interacting factors is perhaps more important than low p values.
Two important caveats should be noted when interpreting these results. The validity of the causal model we propose rests on the genetic factors interacting with other genes and/or environmental factors. This model will not always hold. Diseases with genetic aetiology manifest through direct Mendelian transmission and may not involve interacting factors.37 Further, evidence for mostly additive genetic effects (rather than epistasis or gene by environment interaction) has been documented for outcomes such as body mass index.38 However, for most complex diseases, genetic factors have small effects and must to some degree interact with additional factors—an array of genes or environmental risk factors—in order to have a causal impact on disease. For example, variation in an alcohol dehydrogenase gene (ALDH2) robustly predicts alcohol consumption as well as risk of high blood pressure.39 Within a population that consumes almost no alcohol, the gene variant is not predictive of blood pressure risk, but in heavy drinking populations, the gene variant is strongly predictive of blood pressure. Considering alcohol consumption as an environmental cause of disease that is potentially interacting with a gene that regulates alcohol metabolism, these results suggest that when the environmental cause is removed (alcohol abstainer population), no cases of high blood pressure can be attributable to the genetic variant. When the environmental cause of disease is ubiquitous (heavy drinking population), many cases of high blood pressure can be attributable to the genetic variant.
Second, our ability to detect environmental effects will depend on the strength of the environmental measures. Genes are, in comparison to environments, easier to measure and define,22 ,40 and to date, the search for environmental risk factors that activate genetic vulnerability has been difficult. Recent evidence suggests that increasing the sample size of individuals who are genotyped may, in some circumstances, be more beneficial for scientific inquiry compared with spending resources on measuring environmental factors;19 the utility of measuring the environment will increase as the prevalence of the environmental factors that interact with genetic sequences increases. The existing literature has identified few robust and reliably documented interactions between environmental factors and genetic variants.11 Robust genes by environment interactions have been detected, for example, for genes that clearly have a strong causal role in the exposure—for example, prenatal smoking interacting with nicotinic receptor genes in predicting birth weight.41 Similar to the example of alcohol metabolising genes, alcohol consumption and high blood pressure, we can learn a substantial amount about environmental causes of disease by studying the genetic cofactors of the environmental causes themselves.42 While capturing and measuring systematic aspects of the environment is an ongoing challenge, however, this challenge does not preclude the necessity of these endeavours. Emerging research on Environment Wide Association Studies41 and Gene-Environment Wide Association Studies43 ,44 may be avenues to bridge the gap between identified genetic variants and use prediction.
Conclusion
As Rose demonstrated more than a quarter of a century ago, the determinants of the population distribution of disease have less to do with the individual-level risk factors that promote disease within a population, and more to do with the macro-level structural causes that shape entire distributions of disease across populations.45 However, these issues are not broadly appreciated in the scientific literature and have penetrated poorly in the genetic epidemiology literature. As we become increasingly interested in understanding cause within and across contexts with different gene prevalences, different distributions of environmental risk factors, and different background rates of disorders, understanding the connections among these concepts is critical to interpreting data, comparing across studies, creating consensus around causal inference, and ultimately, determining the population-level impact of modifiable risk factors so that we may intervene.
Key messages
When common germline genetic variants are insufficient to produce disease, the predictive capacity of the genetic variant alone will be determined by the prevalence of factors that interact with the variant and the rate of the disease in the population.
Genetic variants will be strong predictors of disease only when the factors that interact with the disease are common and when the background rate of disease is rare.
References
Footnotes
Contributors KMK drafted the manuscript and led the mathematical analysis. GDS, KCK and SG provided critical revisions to the text and the content of the analytic strategy.
Funding KMK is supported by K01-AA021511. GDS is supported by the MRC as part of the MRC Integrative Epidemiology Unit. KCK is supported by R01MH093612, RC4MH092707, P51RR000165, U01OH010416 and U01OH010407 grants. SG is funded in part by National Institutes of Health grants MH 095718, MH 082729, MH 082598, and DA034244 and Department of Defense grant W81XWH-07-1-0409.
Competing interests None.
Provenance and peer review Not commissioned; externally peer reviewed.