Article Text

Abstract
Background National estimates of the upcoming diabetes epidemic are needed to understand the distribution of diabetes risk in the population and to inform health policy.
Objective To create and validate a population-based risk prediction tool for incident diabetes using commonly collected national survey data.
Methods With the use of a cohort design that links baseline risk factors to a validated population-based diabetes registry, a model (Diabetes Population Risk Tool (DPoRT)) was developed to predict 9-year risk for diabetes. The probability of developing diabetes was modelled using sex-specific Weibull survival functions for people >20 years of age without diabetes (N=19 861). The model was validated in two external cohorts in Ontario (N=26 465) and Manitoba (N=9899). Predictive accuracy and model performance were assessed by comparing observed diabetes rates with predicted estimates. Discrimination and calibration were measured using a C statistic and Hosmer–Lemeshow χ2 statistic (χ2H–L).
Results Predictive factors included were body mass index, age, ethnicity, hypertension, immigrant status, smoking, education status and heart disease. DPoRT showed good discrimination (C=0.77–0.80) and calibration (χ2H–L <20) in both external validation cohorts.
Conclusions This algorithm can be used to estimate diabetes incidence and quantify the effect of interventions using routinely collected survey data.
- Diabetes
- diabetes incidence
- population risk
- risk algorithm
- diabetes DI
- population surveys
- risk models me
This is an open-access article distributed under the terms of the Creative Commons Attribution Non-commercial License, which permits use, distribution, and reproduction in any medium, provided the original work is properly cited, the use is non commercial and is otherwise in compliance with the license. See: http://creativecommons.org/licenses/by-nc/2.0/ and http://creativecommons.org/licenses/by-nc/2.0/legalcode.
Statistics from Altmetric.com
Introduction
In medicine, prediction tools are used to calculate risk, defined as the probability of developing a disease or state in a given time period. Within the clinical setting, predictive tools such as the Framingham Heart Score1 have contributed important advances in individual patient treatment and disease prevention.2 Similarly, applying predictive risk tools to populations can provide insight into the influence of risk factors on the future burden of disease in an entire region or nation and the value of interventions at the population level.
Global estimates place the number of people with diabetes at approximately 200 million, and increasing rapidly.3 There is a growing concern that these trends may slow or even reverse life expectancy gains in the USA and other developed countries.4 Planning for healthcare and public health resources can be informed by robust prediction tools. Estimates of future diabetes incidence will alert policy makers, planners and physicians to the extent and urgency of the diabetes epidemic. In addition, a population prediction tool for diabetes can identify the optimal target groups for new intervention strategies, and determine how extensive a strategy must be to achieve the desired reduction in new cases. This insight can improve the effectiveness and efficiency of prevention strategies.
Clinical risk algorithms have been applied at the population level for other diseases,5 but with considerable challenges. Clinical risk tools usually require clinical data that are rarely available at the population level. For diabetes, several clinical risk prediction tools exist, but they require clinical data that are collected infrequently or not at all at the population level, such as fasting blood sugar,6–8 or require detailed information, such as diabetes family history.9 10 In addition, some apply only to specific subgroups of the population, such as specific age ranges, or only to those with comorbid conditions.11–13 For a population algorithm, the input variables should be representative of the entire population (ideally population-based), meaningful for health policy decision makers, available to a wide audience, and regularly collected so that estimates can be updated frequently. The creation and application of a population-based risk algorithm for diabetes is feasible because the risk factors for diabetes are well known and measured through self-reported questionnaires in population health surveys.
The objective of this study was to create a risk algorithm for diabetes incidence that can be applied at the level of populations using widely available public data. The Diabetes Population Risk Tool (DPoRT) was created and validated by individually linking three different provincial population health surveys to population-based registries of physician-diagnosed diabetes.
Methods
DPoRT derivation cohort
The cohort was derived from 23 403 Ontario residents of the 1996/7 National Population Health Survey (NPHS-ON) conducted by Statistics Canada (83% response rate)14 who were linkable to health administrative databases. Households were selected through stratified multilevel cluster sampling of residences using provinces and/or local planning regions as the primary sampling unit. The sample is proportionally representative of provinces according to the size of their populations. Excluded from the sampling frame were people living on Indian Reserves and Crown Lands, institutional residents, full-time members of the Canadian Forces, and residents of certain remote regions. The survey was conducted by telephone, and responses were self-reported. People under the age of 20 (n=2407), those with diabetes at baseline (n=894), women who were pregnant at baseline (n=241) (because baseline body mass index (BMI) could not be accurately ascertained), and men with missing baseline BMI (n=66) were excluded, resulting in 9177 male and 10 618 female subjects. Respondents were individually linked to a chart-validated population-based registry of physician-diagnosed diabetes. For further details of the breakdown of the derivation cohort, see figure 1 of the supplementary online appendix.
DPoRT validation cohorts
The first validation cohort was the Manitoba respondents of the 1996/7 NPHS (NPHS-MB) (N=10 118). The second validation cohort was from the Ontario portion of the 2000/1 Canadian Community Health Survey (CCHS-ON, Cycle 1.1, N=37 473, 81% response rate) administered by Statistics Canada. The target population of the CCHS is the same as that of the NPHS and provides data representative of 98% of the Canadian population15 16 The same exclusion criteria were applied to both validation cohorts, and, after exclusions, there were 9899 in NPHS-MB and 26 465 in CCHS-ON. The NPHS-MB cohort had a 9-year follow-up (1996–2005), and CCHS-ON had a 5-year follow-up (2000–2005); therefore DpoRT-predicted risks were generated accordingly.
Identifying respondents who develop diabetes
Survey data were linked to provincial healthcare databases that include all people covered under the government-funded universal health insurance plan. The diabetes status of respondents in Ontario was established by linking people to the Ontario Diabetes Database (ODD), which contains all patients with physician-diagnosed diabetes identified since 1991. A patient is said to have physician-diagnosed diabetes if he or she meets at least one of the following criteria: (a) a hospital admission with a diabetes diagnosis (International Classification of Diseases Clinical Modification code 250 (ICD9-CM) before 2002 or ICD-10 code E10–E14 after 2002; (b) a physician services claim with a diabetes diagnosis (code 250) followed within 2 years by either a physician services claim or a hospital admission with a diabetes diagnosis. A hospital record with a diagnosis of pregnancy care or delivery close to a diabetic record (ie, a gestational admission date between 90 days before and 120 days after the diabetes record date) was considered to relate to a diagnosis of gestational diabetes and therefore the data were excluded. The ODD has been validated against primary care health records and demonstrated to be accurate for determining incidence and prevalence of diabetes (sensitivity 86%, specificity 97%).17 18 Information on vital statistics and eligibility for healthcare coverage was captured from the Registered Persons Data Base. The ODD algorithm is applied nationally using provincial administrative registries (known as the National Diabetes Surveillance System) and has been successfully validated in several Canadian provinces.19
Variables
To ensure that DPoRT would be applicable across different populations, variables considered had to be based on established evidence, easily captured using population surveys, and captured in a consistent manner across surveys and populations. Variables included were age, height and weight, chronic conditions diagnosed by a health professional, ethnicity, immigration status, smoking status, educational achievement, household income, alcohol consumption and physical activity (based on metabolic equivalents). BMI in kg/m2 was used as an indicator of obesity.20 All variables were kept in the form released in the public use data file.
Statistical analysis
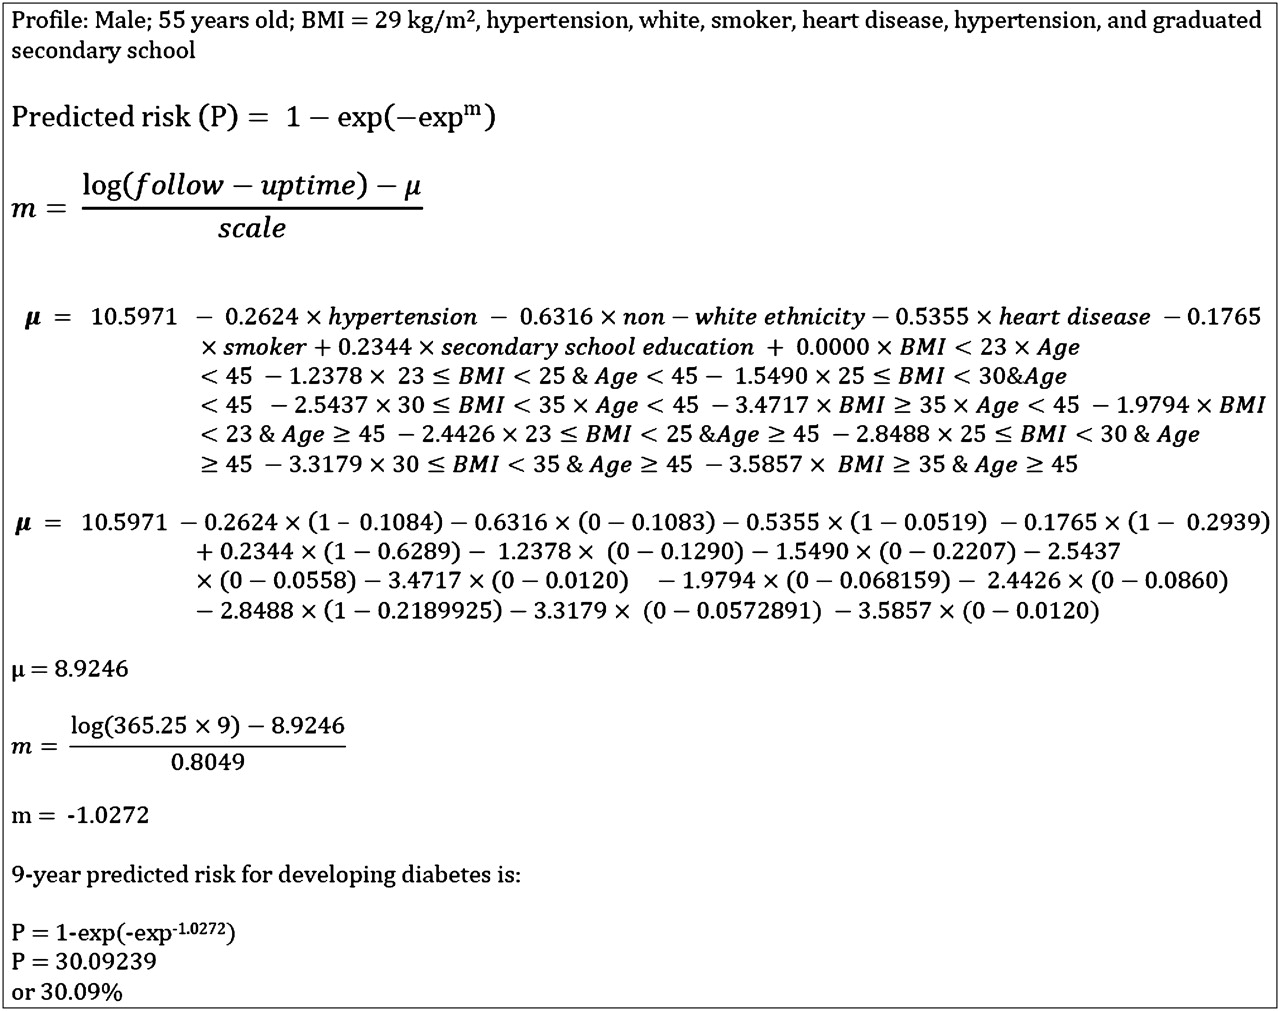
The probability of physician-diagnosed diabetes was assessed from the interview date until censoring for death or end of follow-up. The final model was fitted using a Weibull accelerated failure time model which is a time-to-event model that predicts probability of diabetes and includes time in its equation, allowing the user to predict diabetes probability for a range of follow-up periods. Diabetes functions were derived separately for men and women. Variables were added to the model in a nested fashion based on clinical importance, and the marginal statistical and predictive significance was evaluated, controlling for variables already in the model. Predicted probability for each person was calculated by multiplying their risk factor values by the corresponding regression coefficients and summing the products.21 An example of this calculation is shown in figure 1. The functional form of the model was assessed using likelihood ratio tests to compare nested parametric models.22 A plot of log(–logS(t)) versus log(t) (where S(t) = the probability of being diabetes free beyond time t) and Cox–Snell residual plots were produced to assess the Weibull distribution. Two indices of model performance were examined: discrimination and calibration. Model discrimination is the ability to correctly classify those with and without the disease based on predicted risk—that is, to rank those who will and will not develop diabetes. Discrimination is measured using a C statistic, which is analogous to the area under the receiver operating characteristic curve, a plot of sensitivity versus (1–specificity) for a binary outcome at various thresholds.23 This study uses a C statistic modified for survival data developed by Pencina and D'Agostino.24 Calibration describes the accuracy of a prediction model—specifically, the extent of agreement between predicted and observed outcomes. It is measured using the Hosmer and Lemeshow statistic (H–L test), a χ2 test based on grouping observations into deciles of predicted risk and testing associations with observed outcomes.25 In our study, it was calculated by comparing observed diabetes rates and DpoRT-predicted diabetes probabilities using a modified version of the H–L χ2 statistic for time-to-event data.26 27 To mark sufficient calibration, χ2=20 was used as a cut-off (p<0.01), consistent with the method of D'Agostino et al26 in validating the Framingham algorithms. In addition, discrimination and calibration were computed using the coefficients generated from the validation cohort and labelled ‘own cohort’. This was done to assess if the coefficients generated from the validation cohort produced significantly different predictive accuracy from DPoRT. In addition, graphical representations of predicted and observed rates were produced. Recalibration was achieved by substituting the mean values from the validation cohort to define all variables. Because of systematic case ascertainment differences between provinces, a further adjustment was applied to predicted rates outside of Ontario. To demonstrate the applicability of this tool, the sex-specific DPoRT models were applied to the most recently released national survey (CCHS 2005) to provide estimates of diabetes incidence up to 2014. Predicted diabetes cases and incidence rates were generated overall and by age, BMI, ethnicity and education.

Example use of the Diabetes Population Risk Tool to predict the 9-year risk of diabetes for a specific high-risk man.
All estimates incorporated bootstrap replicate survey weights to accurately reflect the demographics of the population and account for the survey sampling design based on selection probabilities and post-stratification adjustments. Variance estimates were calculated using bootstrap survey weights.28 29 All statistics were computed using SAS statistical software (version 9.1).
Results
All population characteristics in the derivation cohort and two validation cohorts are shown in table 1. In the development cohort, 7.78% and 6.13% of men and women, respectively, developed diabetes during the follow-up period. The derivation cohort differed from the validation cohorts in risk factor and sociodemographic composition, particularly ethnic composition (table 1).
Baseline characteristics of development and validation cohorts
Diabetes risk was strongly related to BMI and age. BMI was considered in both its continuous and categorical form; however, the best goodness-of-fit and calibration were achieved by categorising BMI and including its interactions with age. This categorisation was least likely to cause over-fitting when applied to external data while maintaining discrimination. Including only age and BMI achieved a moderate degree of discrimination (C statistic=0.70). Non-white ethnicity, hypertension and less than post-secondary education were also important factors associated with an increased risk of diabetes. For men, smoking and heart disease were important independent risk factors found to improve model characteristics; for women, immigrant status improved the model. The following variables were excluded because they did not improve the model or worsened predictive accuracy: income, physical activity and alcohol consumption. The DPoRT model for predicting diabetes risk is shown in table 2 for men and table 3 for women. Figure 1 demonstrates how the risk coefficients in DPoRT were used to calculate risk using a man with numerous risk factors as an example.
Diabetes Population Risk Tool functions for predicting 9-year risk of physician-diagnosed diabetes for men
Diabetes Population Risk Tool functions for predicting 9-year risk of physician-diagnosed diabetes for women
In the CCHS validation cohort, the DPoRT 5-year predicted (and observed) diabetes incidence rates were 4.2% (4.6%) for men and 3.4% (3.7%) for women. In the NPHS-MB validation cohort, DPoRT 9-year predicted (observed) diabetes incidence rates were 7.0% (7.1%) for men and 5.1% (4.7%) for women. Overall predicted diabetes rates differed from observed rates by ≤0.4% in both validation cohorts (figure 2 of the supplementary online appendix).

Predicted 10 versus observed incidence of diabetes for men and women in two validation datasets across deciles or quintiles of risk. The x axis refer to quantile (decile or quintile) of predicted Diabetes Population Risk Tool (DPoRT). The y axis refers to the observed (bars) and DPoRT-predicted (dotted line) probability of developing Diabetes Mellitus (DM) in a 5-year period for Ontario and a 9-year period for Manitoba. Observed diabetes rates are physician-diagnosed diabetes rates in the same time period. CCHS, Canadian Community Health Survey; DPoRT, Diabetes Population Risk Tool; NPHS, National Population Health Survey.
Observed and predicted risks closely agreed overall and across levels of diabetes risk. R2 between observed diabetes rates and DpoRT-predicted probabilities across quantiles of risk exceeded 98%. C statistics when DPoRT was applied to the validation cohorts were high (0.77–0.80) and were not appreciably lower than those generated from the ‘own cohort’ models (table 4). As shown graphically in figure 2, for men and women, observed and predicted rates of diabetes did not substantially differ across quantiles of risk in both validation cohorts (χH–L<20).
C statistics with 95% CIs and calibration χ2 statistics for Diabetes Population Risk Tool (DpoRT) and cohorts' own functions
To demonstrate the applicability of DPoRT to recent Canadian data, the predicted risk and number of new cases in the next 9 years using the 2005 data are shown in table 5. Approximately 1.7 million new diabetes cases are predicted for the subsequent 9 years with significant variability by age, ethnicity, education and levels of obesity (table 5). Risk increases sharply with increasing levels of obesity, and decreases with increasing level of educational achievement.
Predicted 9-year diabetes risk in 2005 by subgroups in Canada from the Canadian Community Health Survey (CCHS)
Discussion
This study shows that diabetes risk can be accurately predicted at the population level using self-reported measures available in population health surveys. In addition to being able to effectively rank-order subjects from low to high risk, DPoRT-predicted rates closely agreed with observed rates across levels of risk for both sexes in two external validation cohorts. DPoRT represents a novel approach that can be integrated into commonly collected population health survey data.
Similar to the clinical setting, where decisions are guided by estimation of baseline risk at the time of patient assessment, DPoRT allows estimation of baseline risk of diabetes using the current level of risk factors in the population. This approach has several advantages. Firstly, it has been widely accepted with demonstrated utility for clinical decision-making by providing an effective way to assess patient risk based on multiple risk factors. This risk assessment is then used to guide treatment or prevention recommendations. Secondly, there are well-described methods for developing clinical risk tools and assess their validity, providing a sound methodological basis to validate our approach.26 30 Thirdly, the use of simple self-reported risk factor data allows DPoRT to be used in population settings where detailed clinical data are often unavailable. Further, the use of regularly collected population surveys allows estimates to be updated frequently. The most stringent test of predictive model accuracy is the application of the model to a different population.31 32 This study shows that DPoRT is discriminating and accurate in two external populations that varied across geography and time.
Previous studies that estimate future diabetes burden have either extrapolated overall trends in diabetes prevalence or indirectly incorporated information on the influence of risk factors with various assumptions.3 33–36 Studies of diabetes lifetime risk and life expectancy are not predictive; rather they describe diabetes from a life-course perspective using a period or stationary population approach.36 37 Although these approaches are useful, they do not enable users to directly and quantitatively assess the impact of risk factors, such as BMI, on future diabetes cases. Complex modelling and simulation methods differ from the approach used in this study in that they use additional information on how populations and risk factors change over time.38 39 A strength of simulation models is that they can combine different data sources.40 However, these models often represent clinical or theoretical populations, making estimates difficult to validate in populations that are meaningful for population health planning.
Potentially important clinical values, such as fasting blood glucose, are excluded from DPoRT because they are not captured in population surveys. Although these variables may be clinically important, their use is not feasible for population risk assessment because they are not routinely collected in most populations. These omitted variables are unlikely to have a major effect on the performance characteristics of the model because of the clustering of risk factors, particularly when dealing with abnormalities of the metabolic system.41–45
A potential limitation of this study is that variables such as family history of diabetes or poor diet were not collected. These variables are also associated with the clustering of metabolic and other risk factors included in the algorithm. Using self-report measures is a limitation because these measures may be subject to reporting error. Validation studies have shown a strong correlation between measured height and weight; however, weight has been shown to be underestimated and height overestimated.46 47 It is important to note that DPoRT is designed to be applied to self-reported data, and, unless surveys or reporting patterns change, this is unlikely to affect model performance. There is evidence that simple clinical risk tools, including those with self-report data, perform as well as complex models.48 49
To ensure that DPoRT can be applied in different populations, we used variables that remained stable over time, were unlikely to be subject to serious measurement error (such as alcohol and dietary habits), and are easily captured using survey data in different populations. For example, physical activity, shown to have a protective effect on diabetes risk, was removed from the model because of the inability to capture it in a reliable and reproducible manner across surveys, as well as its lack of improvement of model accuracy. Despite considerable variable constraints, DPoRT maintained good discrimination. Additional predictive variables need to have a high independent risk (OR ≥6.9) to result in significant improvements once a discrimination of 0.8 is already achieved.50 This phenomenon was corroborated in this study, as a maximum level of discrimination was achieved using few variables.
DPoRT was developed in Canada and is most appropriate in the Canadian setting; however, like other risk tools, it may be transportable once validated and calibrated. The simplicity of the model and the fact that it was validated in two very different populations make its generalisability a genuine possibility. We recommend that, when this model is applied outside of Canada, it be validated to ensure accuracy.
The use of physician-diagnosed diabetes, as opposed to true diabetes status (diagnosed plus undiagnosed), is a limitation because the estimates may exclude people with diabetes who are not yet identified. This may reflect patients with less severe disease and/or poorer access to medical care. Physician-diagnosed diabetes is currently the most commonly used definition of diabetes at the level of populations. Although true prevalence estimates would be higher, advocates of the physician-diagnosed outcome argue that it is meaningful to people with recognised diabetes and to the treatment of patients in the healthcare system. In Canada, all residents are covered under a universal health insurance plan and thus are eligible for healthcare and access to a physician for diabetes testing. If diabetes testing/screening increases over time, predicted estimates may be lower than the observed estimates (under the assumption of increased case detection). DPoRT has been found to be accurate in different populations for different time periods; however, it could be adjusted to predict total diabetes cases using information on screening/testing in the population.
Curbing the diabetes epidemic has been identified by governments and health policy makers as a top priority for improving, and even maintaining, the health of their nations. Population-based prediction models such as DPoRT can be used to improve health planning, explore the effect of prevention strategies, and enhance understanding of distribution of the disease. This study shows that DPoRT accurately predicts diabetes incidence and is effective at predicting the population level of diabetes risk. This algorithm can be used by health planners to estimate diabetes incidence, to stratify the population by risk, and quantify the effect of interventions using routinely collected survey data. As the surveillance of risk factors and diabetes advances, DPoRT can be adapted to become more accurate, while maintaining its accessibility for decision makers.
What is already known on this subject
Risk algorithms are often used in the clinical setting to guide clinical decision making; however, they have typically not been adapted for use at the population level.
Clinical risk tools for diabetes require data that are rarely available at the population level.
Previous studies that have estimated future diabetes burden have either extrapolated overall trends in diabetes prevalence or indirectly incorporated information on the influence of risk factors with various assumptions.
What this study adds
This study develops and validates an algorithm for population-based prediction of diabetes (DPoRT), which differs from individual risk approaches.
This algorithm can be used to estimate diabetes incidence in populations and quantify the effect of interventions using routinely collected survey data on risk factors.
Population-based prediction models such as DPoRT can be used to improve population health planning, explore the effect of prevention strategies, and enhance our understanding of the distribution of diabetes in the population.
Acknowledgments
We thank Dr Michael J. Pencina, Boston University, for providing the SAS macro for calculating survival-based calibration and discrimination, Mr Refik Saskin, Institute for Clinical Evaluative Sciences, for assistance with data acquisition, and Amy Zierler for editing the manuscript.
References
Footnotes
PHIAT-DM team members who contributed to the conception and draft of DPoRT are: Les Roos, Cam Mustard, Geoff Anderson, Jan Hux, Lisa Lix, Gillian Booth, Bernard Choi and Sarah Maaten
Funding The study is funded by the Canadian Institutes of Health Research. DM holds a Chair in Applied Public Health from the Canadian Institute for Health Research and Public Health Agency of Canada. The views expressed here are those of the authors and not necessarily those of the funding agency. The funding agency had no role in the data collection or in the writing of this paper. The guarantors accept full responsibility for the conduct of the study, had access to the data, and controlled the decision to publish.
Competing interests None.
Ethical approval The study was approved by the Research Ethics Board of Sunnybrook Health Sciences Centre, Toronto, Ontario and at the University of Manitoba - Research Ethics Board in Winnipeg, Manitoba.
Provenance and peer review Not commissioned; externally peer reviewed.